S&P 500 Daily Chart Analysis For Week of August 1, 2025Technical Analysis and Outlook:
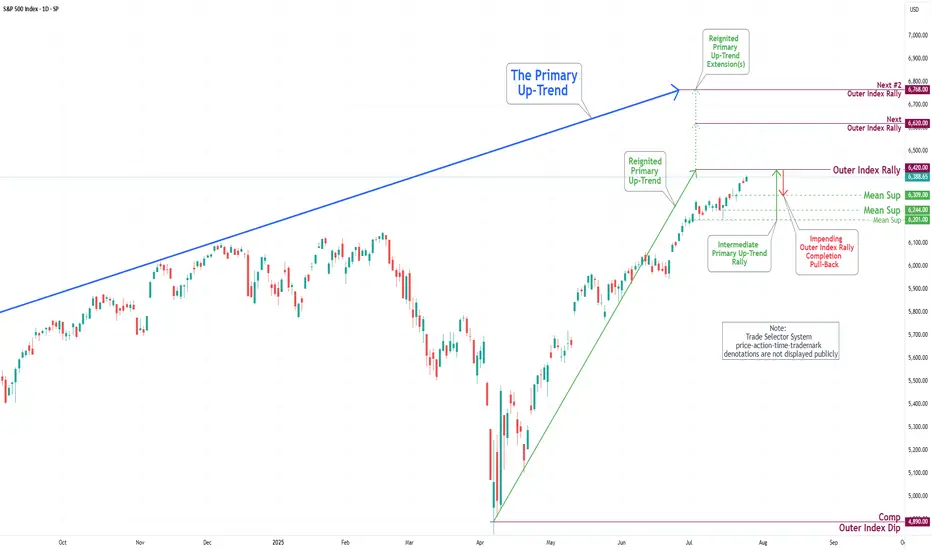
During the trading activity of the previous week, the S&P 500 Index displayed a predominantly bearish movement after completing our Outer Index Rally target of 6420, as highlighted in the prior week’s Daily Chart Analysis, with the primary objective now being to plug our Mean Support at 6200.
It is essential to recognize that the current price movement may trigger a significant further pullback to the Mean Support level of 6090. Following this downturn, it is expected that the index will resume its upward momentum, aiming for a retest of the Outer Index Rally peak at 6420.
Wallstreet

S&P 500 Daily Chart Analysis For Week of July 25, 2025Technical Analysis and Outlook:
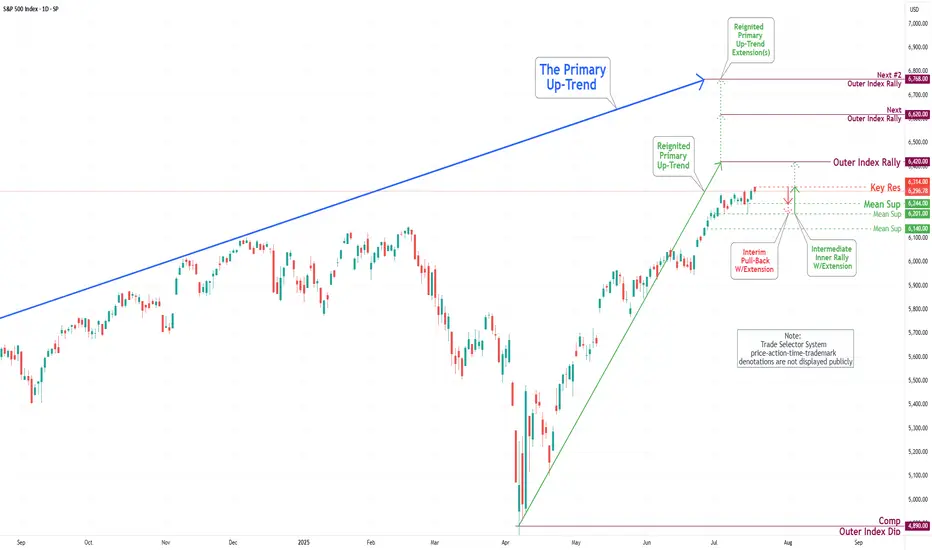
In the trading activity observed last week, the S&P 500 Index exhibited a predominantly upward trajectory. It traded around the Key Resistance level of 6314. It successfully broke through this level, with the primary objective being to complete the Outer Index Rally at 6420, as outlined in the previous week's Daily Chart Analysis.
It is crucial to acknowledge that the current price movement may prompt a substantial pullback following the completion of the Outer Index Rally, with the main target identified as the Mean Support level of 6309. Following this potential downward adjustment, it is anticipated that the index will resume its upward trend, targeting a retest of the forthcoming completion of the Outer Index Rally at 6420.
S&P 500 Daily Chart Analysis For Week of July 18, 2025Technical Analysis and Outlook:
During the current trading week, the S&P 500 Index has demonstrated a predominantly upward trajectory. It has successfully retested the Mean Support level at 6200 and established a new Key Resistance level at 6314. Currently, the index displays a bullish sentiment, with the objective for the Outer Index Rally set at 6420.
Nevertheless, it is essential to recognize that the current price action may result in a decline, potentially leading to a retest of the Mean Support at 6244 and extending to the Mean Support at 6201. Following this potential downward movement, it is anticipated that the index will resume its upward trend, driving the price action towards the Key Resistance level at 6314 and ultimately achieving the Outer Index Rally target of 6420.
SPY PRICE ACTION 16 JULY 2025This is the price action of spy at its very best as always. I have clearly discussed the important levels & have also discussed the momentum as well.
Feel free to leave your comment
NOTE:I AM NOT TRADING SPY

S&P 500 Daily Chart Analysis For Week of July 11, 2025Technical Analysis and Outlook:
During this trading week, the S&P 500 Index has shown a predominantly downward/upward course of action and created a new Key Resistance at 6280. Currently, the index exhibits a bullish bias, with the Outer Index Rally objective set at 6420. However, it is crucial to note that the current price action may cause prices to see in a new light from their current fluctuation to push toward the Mean Support at 6200 before resuming their upward movement.

S&P 500 Daily Chart Analysis For Week of July 3, 2025Technical Analysis and Outlook:
During this abbreviated trading week, the S&P 500 Index has primarily shown an upward course, hitting and surpassing our target for the Outer Index Rally of 6235. Currently, the index demonstrates a consistent bullish trend, with the following objective for the Outer Index Rally set at 6420, followed by forthcoming targets of 6620 and 6768. Nevertheless, it is crucial to acknowledge the current price action may cause prices to retrace from their current fluctuation to test the Mean Support at 6200 before resuming their upward movement.

S&P 500 Daily Chart Analysis For Week of June 27, 2025Technical Analysis and Outlook:
During the current trading week, the S&P 500 Index has predominantly demonstrated an upward trajectory, surpassing the Mean Resistance level of 6046, the Outer Index Rally target of 6073, and the critical Key Resistance threshold of 6150. Currently, the index is exhibiting a bullish trend, indicating potential movement towards the Outer Index Rally objective of 6235. However, it is essential to note that there is a substantial probability that prices may retract from their current levels to test the Mean Support at 6136 before experiencing a resurgence.

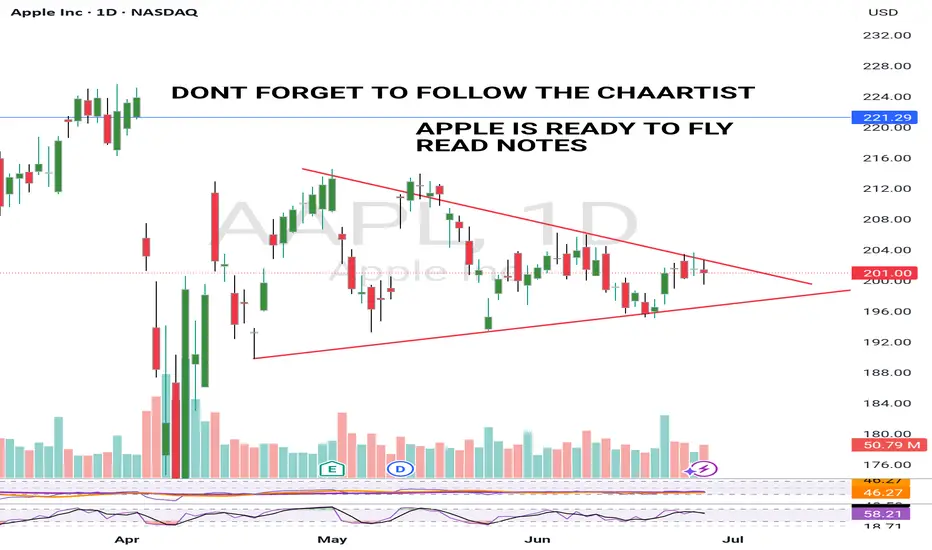
APPLE BULLISH 26 JUNE 2025Apple looks ready to breakout.It is really well squeezed now and ready to form a Green candle.
Breakout is an expectation so dont trade blindly.
I will upload video analysis Asap.
I am bullish and my price target is a minimum $220 from here.
NOTE: RISK MANAGEMENT IS A MUST
S&P 500 Daily Chart Analysis For Week of June 13, 2025Technical Analysis and Outlook:
The S&P 500 Index has displayed both upward and downward movements throughout this week's trading session, narrowly missing the targeted Outer Index Rally level of 6073. Currently, the index is characterized by a bearish trend, warranting attention towards the Mean Support level of 5940, with additional critical support identified at 5888.
Conversely, there exists a significant potential that, upon reaching the Mean Support of 5940, the index may recover and rise to the Mean Resistance level of 6046. This upward movement could facilitate an interim rally, culminating in the completion of the Outer Index Rally at 6073 and enabling the index to address the Key Resistance level positioned at 6150.

S&P 500 Daily Chart Analysis For Week of June 6, 2025Technical Analysis and Outlook:
The S&P 500 Index has demonstrated an upward trajectory during this week's trading session, surpassing the established Outer Index Rally level of 5955 and the Key Resistance level of 5965. Currently, the index is exhibiting a bullish trend, with a focus on the Outer Index Dip target, set at 6073. Furthermore, additional critical levels have been identified, including Key Resistance at 6150 and the Next Outer Index Rally at 6235. Conversely, there is a potential decline in index prices from the current level or upon completion of the Outer Index Dip 6073, which may lead to a retest of the Mean Support at 5940, with the possibility of extending the pullback to the Mean Support at 5888.


TSLA PRICE ACTION 1ST JUNE 2025This is the updated price action of Tesla. I have explained why I exited long positions. If you have any doubts, then feel free to leave a comment below.
NOTE: STAY AWAY FROM TSLA LONGS

S&P 500 Daily Chart Analysis For Week of May 30, 2025Technical Analysis and Outlook:
The S&P 500 Index has undergone considerable price fluctuations during the trading sessions of this week, successfully reaching a critical target at the Mean Support level of 5800. Presently, the index is exhibiting an upward trend with a focus on the retest of the Inner Index Dip at 5955 and Key Resistance at 5965. Furthermore, additional significant levels have been identified, including the Next#1 Outer Index Rally at 6073, Key Resistance at 6150, and the Next#2 Outer Index Rally at 6235. Conversely, there is a potential for the index prices to downfall aiming to retest Mean Support 5800 and to complete the Outer Index Dip, noted at 5730.

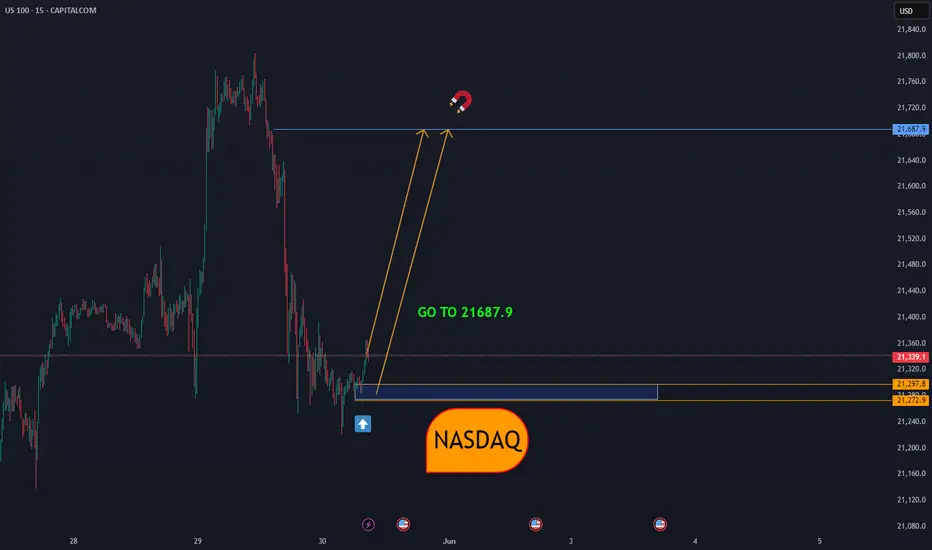
NASDAQGiven the geometry that has been created, there is a possibility of a correction towards the price of 21687.9, either from the current price or from a little lower, if the bottom of 21219 is broken, another decision must be made.
NASDAQ:NDX
S&P 500 Daily Chart Analysis For Week of May 23, 2025Technical Analysis and Outlook:
The S&P 500 Index demonstrated a consistent downward trend during this week's trading session, reaching a significant target at the Mean Support level 5828. The index is currently trending lower, targeting the Inner Index Dip at 5730, with additional marks identified at the Mean Support levels of 5660 and 5600. Conversely, the index has the potential to rebound from its present position, advancing toward the Mean Resistance level of 5860 and retesting the previously completed Outer Index Rally at 5955.

TSLA PRICE ACTION 21st MAY 2025This is the updated price action of Tesla. I have clearly discussed the new buying levels & have also discussed why I sold it.
If you have any questions, feel free to leave a comment or DM me.
NOTE: AVOID OPTIONS IN TESLA

S&P 500 Daily Chart Analysis For Week of May 16, 2025Technical Analysis and Outlook:
The S&P 500 Index showed a steady upward trend during this week's trading session, successfully reaching a key target at the Outer Index Rally level of 5955. However, it's important to note the significant downward trend due to letter completion, which could lead to a decline toward the Mean Support level of 5828. Additionally, there is a possibility of further drops to the Mean Support level of 5661. On the other hand, the index may continue to rise from its current level, potentially advancing toward the Inner Currency Rally target set at 6073.

US30 SHORT1. This is the deciding factor as it is at the high created last week and should have a lot of resistance
2. M15, M30 and H1 are overbought and there is a double top with divergence
3. This is a type 2 pattern on H4 however there is a smaller pattern on M15 below
4. Stop loss of 200 pips

S&P 500 Daily Chart Analysis For Week of May 9, 2025Technical Analysis and Outlook:
In the initial days of this week’s trading session, the S&P 500 Index exhibited a steady to low price movement pattern, successfully achieving a significant target at the Mean Support level of 5601, as indicated in last week’s Daily Chart Analysis. Subsequently, the Index experienced a robust rebound, effectively retesting the Mean Resistance level of 5692. This upward trajectory achievement established a reversal pattern for the downward acceleration to repeat the Mean Support level 5601 retest. However, it is critical to recognize the considerable risk of a sharp upward movement from the current price action, which may lead to an ascent toward the next Mean Support level of 5778. Furthermore, there exists the potential for additional escalation, potentially reaching the Outer Index Rally level of 5915 and beyond.


Financial Markets: Outlook and Risks – May 2025As May 2025 begins, global financial markets are entering the month with cautious optimism, shaped by anticipation surrounding decisions from key regulatory bodies. At the center of this uncertainty lies the U.S. Federal Reserve, whose policies continue to exert a significant influence over global asset dynamics.
After a series of interest rate hikes throughout 2023 and 2024, the Federal Reserve has adopted a more neutral stance, closely monitoring macroeconomic indicators. Despite a moderate decline in inflation and stable employment figures, Fed officials remain hesitant to declare an end to the tightening cycle. In his latest address, Fed Chair Jerome Powell emphasized the need for "vigilance amid geopolitical volatility and structural changes in the global economy."
The U.S. stock market entered May with moderate volatility. The S&P 500 index is hovering near local highs, while investors are reacting cautiously to corporate earnings reports and Fed commentary. Tech stocks are largely on the rise, driven by expectations of expanded AI integration, while companies in the industrial and energy sectors face pressure from rising input costs and supply chain instability.
Europe is facing a more complex situation, with inflationary pressures persisting, especially in the energy sector. The European Central Bank (ECB) is walking a fine line between tightening monetary policy and supporting sluggish economic growth. Major indices like the UK’s FTSE and Germany’s DAX are showing mixed signals, reflecting domestic challenges and ongoing geopolitical tensions.
On currency markets, the U.S. dollar remains relatively strong, though it occasionally dips as expectations grow for a more dovish stance from the Fed. The euro and the Japanese yen are showing periodic strengthening, backed by active central bank measures. Emerging markets such as Brazil and India are seeing increased interest in gold and government bonds as a hedge against external risks.
Beyond monetary policy, one of the main concerns for investors is the ongoing trade dispute between the U.S. and China. Tariff hikes and export restrictions on strategic goods are raising alarms about supply chain reconfigurations and capital reallocation on a global scale.
Investors around the world are searching for a balance between risk and return. Current strategies emphasize diversification, safe-haven assets, digital technologies, and ESG-focused sectors. Analysts advise a measured approach, urging investors to closely monitor macroeconomic data before making major portfolio decisions.
In summary, May 2025 marks a period of watchfulness and recalibration. Financial markets are looking to the Federal Reserve, trade negotiations, and key economic reports for signals that will likely define the tone for the months ahead.

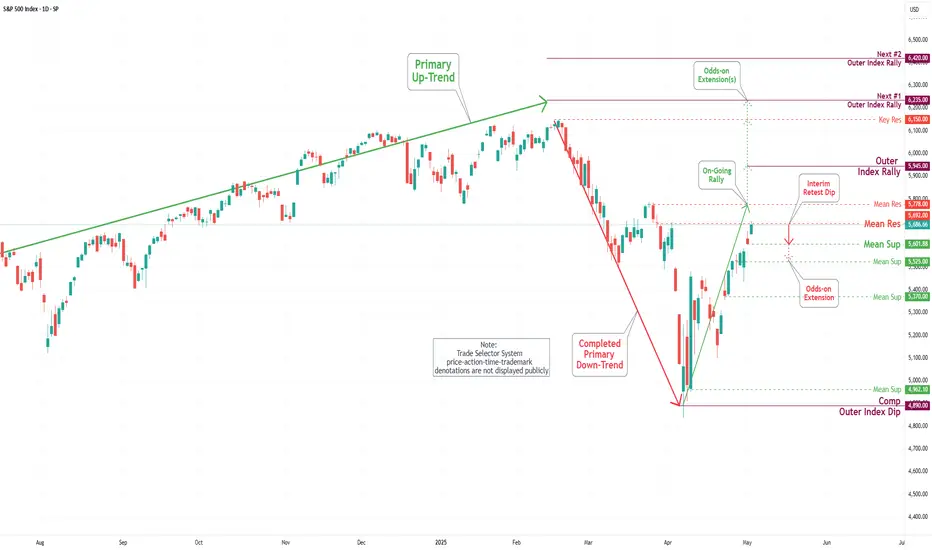
S&P 500 Daily Chart Analysis For Week of May 2, 2025Technical Analysis and Outlook:
During this week's trading session, the Index demonstrated a steady to higher price movement, achieving a key target at the Outer Index Rally level of 5550 and successfully surpassing the Mean Resistance level of 5672. This trajectory establishes the foundation for sustained upward momentum as it approaches the Mean Resistance level of 5778 and sets sights on reaching the next Outer Index Rally target marked at 5945. However, it is essential to acknowledge the substantial risk of a sharp retracement from the current price level to the Mean Support level of 5601, with the potential for further decline to the Mean Support level of 5525.
SPY WEEKLY 2ND MAY 2025Welcome to Spy weekly. I have clearly discussed the price action. If you have any doubts, feel free to leave a comment or DM me.
NOTE:DO NOT SHORT
