GBPUSD SHORT BIAS TO 1.18223REASONS:
-MONTHLY TIMEFRAME IS CURRENTLY AT A LOWER HIGH IN A DOWNTREND
-Weekly Timeframe price retraced to 61.8% and bearish candlestick closed below 38.2%
-Lower Timeframes correlate with higher Timeframes
My Purpose:
I am executing projections and trades that create generational wealth for myself and others.
Sidenote:
Learning & Applying PRICE ACTION is key. Learning & Applying PSYCHOLOGY is the lock on the door !
Wallstreetacademy

GBPAUD LONG BIASGBPAUD LONG BIAS
REASONS:
-THIS MONTHS CANDLESTICK IS BULLISH CURRENTLY
-Monthly Timeframe is still in an uptrend
-Weekly Timeframe is bullsih
- Daily Timeframe is bullish
- Lower Timeframes are correlates with higher timeframes
-PRICE RETRACED AT 78.6% and previous bullish candle closed at 38.2%
Comment and lets unpack this together !
My Purpose:
I am executing projections and trades that create generational wealth for myself and others.
Sidenote:
Learning & Applying PRICE ACTION is key. Learning & Applying PSYCHOLOGY is the lock on the door !

USDJPY LONG biasREASONS:
-Monthly , Weekly & Daily candlesticks all are Bullish currently
-LOWER TIMEFRAME Correlates with Higher Timeframes.
-ON the 1HR Timeframe price retraced to 61.8% and a bullish candlestick closed at 38.2% , meaning there are more buyers in the market currently
My Purpose:
I am executing projections and trades that create generational wealth for myself and others.
Sidenote:
Learning & Applying PRICE ACTION is key. Learning & Applying PSYCHOLOGY is the lock on the door !

AUDJPY SHORT biasAUDJPY SHORT
REASONS:
-Monthly & Weekly Timeframe Bearish
-ON DAILY TIMEFRAME Price Retraced to 61.8% and Bearish Candlestick closed on 38.2%
-LOWER TIMEFRAME Correlates with Higher Timeframes.
My Purpose:
I am executing projections and trades that create generational wealth for myself and others.
Sidenote:
Learning & Applying PRICE ACTION is key. Learning & Applying PSYCHOLOGY is the lock on the door !

USDJPY Bullish Projection Higher Timeframe confirmation
38.2 retrace level on the 4 hour chart.
4 to 1 reward risk ratio
Its a go

GBPUSD Short ProjectionGBPUSD Short projection.
Based on higher timeframesn showing more sellers in the market and buyers exhaustion on lower time frames

Aud/Usd Long results This my bias for AUD/USD and my target price for take profit. Target was reached to a T.

DJI/WALL STREET RoadmapWave Cycles for MT4
Identifies cycles derived from every major high and low and automatically paints them on the chart for you.
The ANGLE of the cycle gives you a roadmap into the future as to what type of move one can expect.
The steeper the angle the greater the tendency for a market to rally/decline rapidly.

UJ going for the bullish push!!Broken structure to the upside on 4hr timeframe... retest to the 38.2 Fibonacci price reversal zone level... nice sellers exhaustion wicks forming on the 4hr with a nice bullish engulfing candle forming

UJ retrace then DROPOn the 1 hour timeframe, UJ broke structure, on the higher timeframe UJ is sitting on the 38.2 PRZ fib level. also has a head and shoulders pattern, with exhaustion forming on smaller time frames. just waiting for a slight retest and an entry down to the 111.600 area

American Dreamers or the Intelligent Japanese? USDJPY has been an interesting pair to watch this year and here is another opportunity to take advantage of the volatility of this pair.
I will just be going into the technicals for this trade. If you want fundamental information visit www.investing.com they have great fundamentals with great breakdowns.
TECHNICALS
- The Market on Friday's close was on the level i identified as weekly support (109.300) looking at chart patterns from two months ago, we noticed that this level is extremely difficult to break and close below thus making it a level prone to reversals, and so far this has occurred.
-Daily Resistance (111.011) is our first target as this is the first level the market will face which could prove to be a little bit of a challenge as the market proceeds with its bull movement, so i would suggest profits are secured here.
-Resistance Region (111.774) is labelled this as the market can find itself caught in a brief consolidation between Daily Resistance and this level, we may encounter a retrace here as history has proven, although this shouldn't cause a big scare, keep your positions open but make sure profits have been locked before the market enters here.
-And our last target is Secondary Resistance (112.391) it should take near 2 weeks to play out so, patience will be key and your mental stability will be tested, in the past again the market does enjoy stalling here, once where are this high up we want to secured our profits and run.
Greed, Overconfidence and lack of patience will be tested in this trade, you will need to overcome greed when you notice that you are in a large profit, do not add more positions that you can not afford to lose, Overconfidence with this trade will make you want to enter positions with other currency pairs without doing the correct analysis, thus will cause you to make silly errors. And finally this trade will take time to play out properly, you will feel as if the market is going no where, that happens, the market is not always going to move, they may be long periods on consolidation but once it is broken strong movements will occur and you will wish you had stayed in the trade.

GBPUSDGBPUSD Broke monthly resistance, retested it, constant HHs,HLs, MAs are open. Our target is weekly resistance 1.3450. Safe SL is a little under 38.20% fib, which is also the tl.

AUDJPYBullish structure broke, MAs crossed over, tl broken, and under monthly resistance 88.00. First target is 38.20% fib level, 86.30.

GBPJPYAlthough GBPJPY seems very bearish, Price is staying above weekly support and respecting TL. MAs are crossing over. (Risky trade)

EURUSDHH/HLS, MAs open, Euro could possible come to Monthly Support 1.1773, or 38.20% fib, before shooting up.

GBPAUD GBPAUD should retest CTL before it continues it's downward trend. Monthly Resistance should hold.

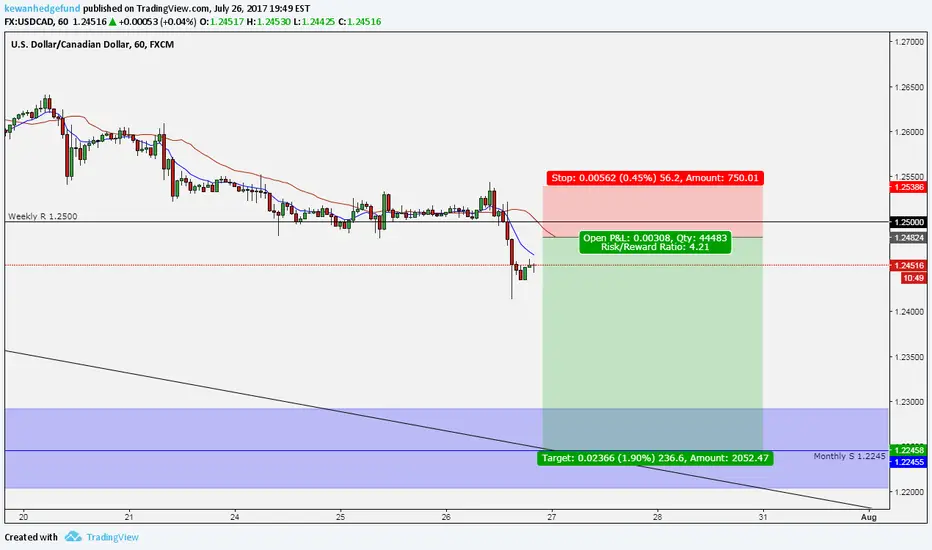
USDCADUSDCAD will continue it's downward journey till Monthly supply 1.2245 zone. UC re-tested daily resistance and, now we could see it fall.


USDCADWeekly bearish, USDCAD has been super bearish, MA's crossed over, (open), UC will try to break its previous lows on weekly, potential target for now is monthly support 1.2245 zone. Analyze bigger picture.
GBPAUDTL broken, MAs crossed over, GA could retest to 1.6430 before it drops to Weekly support 1.6250.

GBPJPYCurrently at Weekly support 144.07, if 144.67 is broken and becomes the support GJ is expected to reach back to Monthly Resistance 147.47 zone. Anyhow, if GBPJPY breaks below weekly support 144.67, GJ could potentially reach 140.00 since the trend is bearish, and MAS touching each other on daily tf.

AUDJPYAUDJPY has broke the bearish structure, MAs have been crossed over, HLs and HHs. An uptrend channel has formed and its respecting the market move. We could see a retrest at monthly s 88.00 (CT) as its upper continuation move to weekly r 90.00. Once target reached further analysis will be updated.

EURJPYEURJPY has broken the trend line on weekly, CTL has also been broken, MAS crossed over. Bullish englufing on various time frames, EJ also broke out from its consolidation zone from 128.50 to 129.60. Now EJ could retrace back to weekly R 129.69 before it shoots up to monthly R 132.00.
