WAL/USDT – Major Breakout Unfolding! 70% Upside Potential?After weeks of compressed price action and relentless seller pressure, WAL is showing signs of a potential explosive move. Is this the breakout bulls have been waiting for?
🧩 Chart Pattern: Descending Triangle — With a Bullish Twist
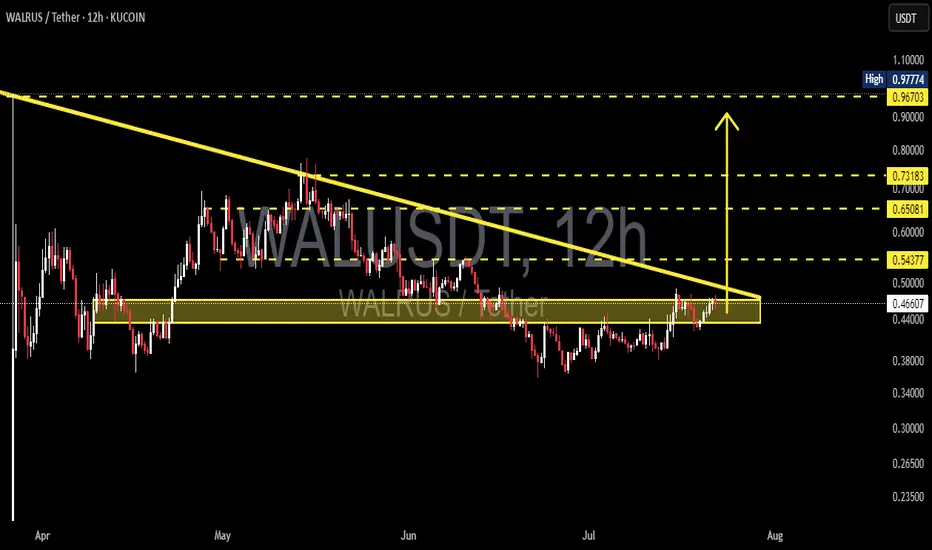
Over the past 3 months, WAL has formed a descending triangle, typically known as a bearish continuation pattern.
But here’s the twist — WAL is breaking out upwards, signaling potential trend reversal instead.
The pattern shows higher lows meeting a horizontal resistance around $0.47–$0.48, a classic sign that buyers are gaining strength.
This setup suggests buyers are slowly overpowering the selling pressure, leading to a high-probability breakout scenario.
🟡 Strong Accumulation Zone: $0.42–$0.45
This range has consistently acted as a strong support base since mid-April.
Every dip into this zone has been met with strong buyback and increasing volume.
It likely represents a smart money accumulation zone before a larger markup phase.
🚀 Breakout Target: Where Could Price Go?
Measured move from the triangle's height projects a move of ~$0.25. From the breakout level at ~$0.48, this gives a technical target around $0.73.
🎯 Bullish Price Targets:
1. TP1: $0.543 — First breakout validation zone
2. TP2: $0.650 — Previous May resistance level
3. TP3: $0.731 — Measured move target from triangle
4. Extended Target: $0.967 – $0.977 — Prior liquidity and local high zone
With sustained volume, $1.00+ isn’t off the table.
---
🔻 Bearish Scenario:
If this breakout turns into a fakeout:
Price may revisit the support zone at $0.45–$0.42.
Breakdown below this zone opens risk toward:
🧨 $0.36 — Mid-range demand zone
Further breakdown could lead to $0.30–$0.28
Confirmation of a fakeout: A strong 12H close below the yellow box support with increasing sell volume.
🔍 Additional Bullish Confirmation Signals:
Volume should spike significantly above average to validate breakout.
RSI, MACD, or EMA crossover can help strengthen the bullish thesis if aligned.
✅ Summary
WAL/USDT is currently at a pivotal breakout moment. A confirmed move above the descending triangle could trigger a major trend reversal, with targets between $0.65 and $0.73 in sight. This setup could be one of the cleanest breakout opportunities on the charts right now.
#WALUSDT #CryptoBreakout #TechnicalAnalysis #BullishSetup #DescendingTriangle #AltcoinWatch
WALUSDT
WALUSDT - Change in the trend and let's capture itWAL is currently showing a change in the trend, after a continous downtrend finally we are seeing change in the trend.
Price has held the support strongly and now we are seeing the reversal.
We have decent trade opportunity here.
Entry Price: 0.4319
StopLoss: 0.3500
TP1: 0.4828
TP2: 0.5292
TP3: 0.6374
TP4: 0.7817
Cheers
GreenCrypto

WALUSDT – Classic Accumulation to Parabolic Playbook (?)📈📚 WALUSDT – Classic Accumulation to Parabolic Playbook 🚀
What we are witnessing on WALUSDT is a textbook example of the three market phases often seen before explosive moves:
1️⃣ Accumulation/Compression Phase
Price compresses into a falling wedge pattern, reducing volatility and building hidden momentum.
2️⃣ Consolidation/Bullish Continuation
Breakout confirmed, and price moves into a flag/channel. This is the classic "cooling off" before expansion.
3️⃣ Parabolic Advance (Expansion Phase)
With the flag breakout, expect potential acceleration toward higher targets:
📌 First Target: $0.6947
📌 Next Target: $0.7292
🚀 Parabolic Zone: $0.90+
📊 Historical Proof?
✅ BTCUSD 2020-2021: Compression → Flag → 10x Parabolic Rally.
✅ TSLA 2019: Same sequence, leading to one of its most aggressive bull runs.
⚠️ Disclaimer:
WALUSDT is a meme coin, highly speculative, and fundamentally different from assets like Bitcoin or Tesla. While the technical setup looks strong, please be aware that this asset can also go to zero. Trade responsibly, manage your risk, and never invest more than you can afford to lose.
One Love,
The FXPROFESSOR 💙

#WALUSDT continues its bearish momentum 📢 As long as the price stays under $0.6000 — short BYBIT:WALUSDT.P bias remains valid.
📢 Watch for further weakness!
📉 SHORT BYBIT:WALUSDT.P from $0.5794
🛡 Stop loss: $0.6000
🕒 Timeframe: 1H
✅ Overview:
➡️ The chart shows a clearly formed and broken Bearish Rectangle, confirming a short setup after price exited the range to the downside.
➡️ The $0.6090 support level has turned into strong resistance.
➡️ Entry at $0.5794 follows a textbook breakdown and retest structure.
➡️ Target area aligns with the volume-based support near POC $0.515, offering solid R:R.
🎯 TP Targets:
💎 TP 1: $0.5725
💎 TP 2: $0.5665
💎 TP 3: $0.5600
📢 Bearish structure confirmed with increased volume.
🚀 BYBIT:WALUSDT.P continues its bearish momentum — downside potential remains active!

TradeCityPro | WAL: Squeezing Tight Before the Breakout👋 Welcome to TradeCity Pro!
In this analysis, I want to review the WAL coin for you. This coin belongs to the Walrus project, which is part of the SUI ecosystem and falls under the DePIN and Storage categories.
⚡️ After its airdrop, this project’s token has managed to maintain its hype and, with a market cap of $589 million, is currently ranked 97th on CoinMarketCap. Since this token has just recently launched, the analysis will be done on the 4-hour time frame.
⏳ 4-Hour Time Frame
As you can see in the 4-hour time frame, after this token’s launch on March 27, the price has formed a low and a high at the 0.3899 and 0.5903 zones respectively. It is still trading between these two levels and has yet to start a clear trend.
✔️ Currently, a descending triangle has formed. The price is forming lower highs, while maintaining equal lows, and each time the price touches these lows, the probability of a breakdown from the triangle increases.
📉 So, for a short position, I suggest definitely having a position open if the 0.3899 zone breaks. You can open this position earlier by entering on a rejection from the descending trendline or the break of 0.4101, but keep in mind that these are not the main triggers—they're just early entries in anticipation of a breakdown, so you’ll have a position ready if the zone breaks.
🔼 For a long position, the first high formed was at 0.4362. The price is currently above this level, but the breakout candle isn’t very strong, and the price hasn’t confirmed stabilization above this level yet. Also, this zone is very close to the descending trendline, so it’s not logical to enter a long position while this trendline remains unbroken.
📈 Therefore, for a long, wait for the break of the descending trendline and a pullback to this dynamic level before entering. The next triggers for upward movement are the 0.5167 and 0.5903 zones.
📝 Final Thoughts
This analysis reflects our opinions and is not financial advice.
Share your thoughts in the comments, and don’t forget to share this analysis with your friends! ❤️

