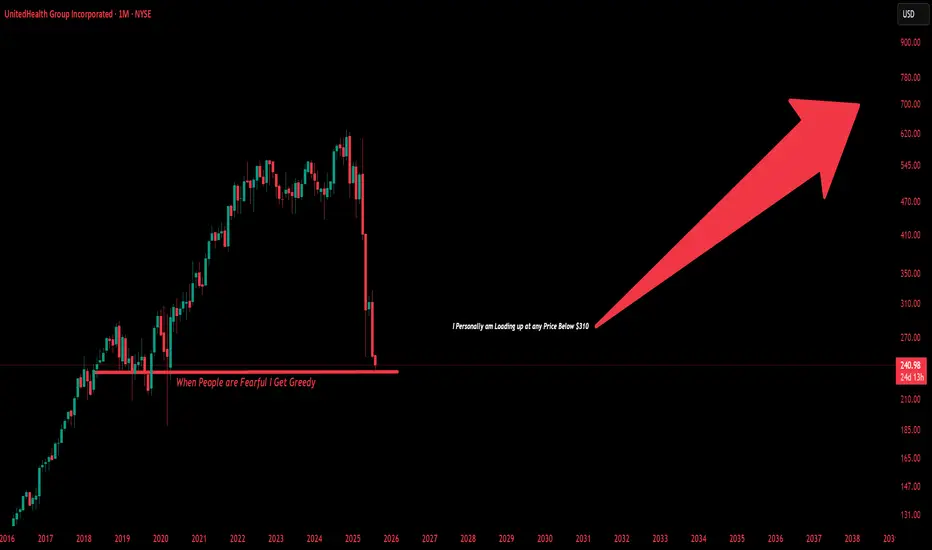
$UNH This Behemoth Is Not Going Anywhere and I am Loading Up United HealthGroup is extremely Appealing to me at these valuations. Health Insurance Is something all people need. I Don't See Medicaid/Medicare Cuts affecting NYSE:UNH To the extent People believe it will. Legislation can be temporary, This Company Produces 20B Plus in Free Cashflow Every single Year Let alone 420B in Revenue its a behemoth controlling more than 30% of American Health Insurance in terms of Market Share. The United States could never afford to socialize Healthcare the way Europe Or Canada does. Social Security/Health/Medicare already eat up 49% Of GDP. The United States is almost dependent on companies Like United Healthgroup to provide its services. This Could almost Give Companies like NYSE:UNH an opportunity to offer plans to gain more customers who before had Government assisted health insurance. While more downside is almost Guaranteed I see nothing more then even better discounts for the long-term. This is not a question of If UNH Can recover its only a question of how long will it take. We are back at Prices Pre Covid-19.
---------------------
Possible Reasons for the Major Drops:
The Big Beautiful Bill
DOJ Lawsuits
Rising Medicare Costs
Rising Expenses on Insurers
Swapped CEO Twice
Swapped CFO Once
Lawsuits
Scandals
---------------------
NYSE:UNH Fundamentals:
Price To Sales: 0.5x
Price To Earnings:10.3x
Price to Book: 2.2x
---------------------
Balance Sheet:
Cash: US$32.02b
Debt: US$104.78b
Total Liabilities: US$203.79b
Total Assets: US$308.57b
---------------------
Management Efficiency:
ROE: 21.1%
ROCE: 15.5%
ROA: 8.2%
---------------------
Dividend Safety:
Dividend Yield: 3.7%
Payout Ratio: 37% of Profits
---------------------
I recently Began Acquiring Shares around the $260 Mark and plan on continuing to load up for the long-term.
---------------------
This is not financial Advice, Just what I am doing on my own as an investor. I do not give Buy/Sell/Hold Signals.
Warrenbuffet
Warren Buffett's Approach to Long-Term Wealth BuildingUnderstanding Value Investing: Warren Buffett's Educational Approach to Long-Term Wealth Building
Learn the educational principles behind value investing and dollar-cost averaging strategies, based on historical market data and Warren Buffett's documented investment philosophy.
---
Introduction: The Million-Dollar Question Every Investor Asks
Warren Buffett—the Oracle of Omaha—has consistently advocated that index fund investing provides a simple, educational approach to long-term wealth building for most investors.
His famous 2007 bet against hedge funds proved this principle in dramatic fashion: Buffett wagered $1 million that a basic S&P 500 index fund would outperform a collection of hedge funds over 10 years. He crushed them. The S&P 500 returned 7.1% annually while the hedge funds averaged just 2.2%.
Today, we'll explore the educational principles behind this approach—examining historical data, mathematical concepts, and implementation strategies for learning purposes.
---
Part 1: Understanding Value Investing for Modern Markets
Value investing isn't about finding the next GameStop or Tesla. It's about buying quality assets at attractive prices and holding them for compound growth .
For beginners, this translates to:
Broad Market Exposure: Own a cross-section of businesses through low-cost index funds
Long-term Perspective: Think decades, not months
Disciplined Approach: Systematic investing regardless of market noise
"Time is the friend of the wonderful business, the enemy of the mediocre." - Warren Buffett
Real-World Application:
Instead of trying to pick between NASDAQ:AAPL , NASDAQ:MSFT , or NASDAQ:GOOGL , you simply buy AMEX:SPY (SPDR S&P 500 ETF) and own pieces of all 500 companies automatically.
---
Part 2: Dollar-Cost Averaging - Your Secret Weapon Against Market Timing
The Problem: Everyone tries to time the market. Studies show that even professional investors get this wrong 70% of the time.
The Solution: Dollar-Cost Averaging (DCA) eliminates timing risk entirely.
How DCA Works:
Decide on your total investment amount (e.g., $24,000)
Split it into equal parts (e.g., 12 months = $2,000/month)
Invest the same amount on the same day each month
Ignore market fluctuations completely
DCA in Action - Real Example:
Let's say you started DCA into AMEX:SPY in January 2022 (right before the bear market):
January 2022: AMEX:SPY at $450 → You buy $1,000 worth (2.22 shares)
June 2022: AMEX:SPY at $380 → You buy $1,000 worth (2.63 shares)
December 2022: AMEX:SPY at $385 → You buy $1,000 worth (2.60 shares)
Result: Your average cost per share was $405, significantly better than the $450 you would have paid with a lump sum in January.
---
Part 3: The Mathematics of Wealth Creation
Here's where value investing gets exciting. Let's run the actual numbers using historical S&P 500 returns:
Historical Performance:
- Average Annual Return: 10.3% (1957-2023)
- Inflation-Adjusted: ~6-7% real returns
- Conservative Estimate: 8% for planning purposes
Scenario 1: The $24K Start
Initial Investment: $24,000 | Annual Addition: $2,400 | Return: 8%
Calculation Summary:
- Initial Investment: $24,000
- Annual Contribution: $2,400 ($200/month)
- Expected Return: 8%
- Time Period: 20 years
Results:
- Year 10 Balance: $86,581
- Year 20 Balance: $221,692
- Total Contributed: $72,000
- Investment Gains: $149,692
Scenario 2: The Aggressive Investor
Initial Investment: $60,000 | Annual Addition: $6,000 | Return: 10%
Historical example after 20 years: $747,300
- Total Contributed: $180,000
- Calculated Investment Gains: $567,300
Educational Insight on Compound Returns:
This historical example illustrates how 2% higher returns (10% vs 8%) could dramatically impact long-term outcomes. This is why even small differences in return rates can create life-changing wealth over decades. The mathematics of compound growth are both simple and incredibly powerful.
---
Part 4: Investing vs. Savings - The Shocking Truth
Let's compare the same contributions invested in stocks vs. a high-yield savings account:
20-Year Comparison:
- Stock Investment (8% return): $221,692
- High-Yield Savings (5% return): $143,037
- Difference: $78,655 (55% more wealth!)
"Compound interest is the eighth wonder of the world. He who understands it, earns it... he who doesn't, pays it." - Often attributed to Einstein
Key Insight: That extra 3% annual return created an additional $78,655 over 20 years. Over 30-40 years, this difference becomes truly life-changing.
📍 Global Savings Reality - The Investment Advantage Worldwide:
The power of index fund investing becomes even more dramatic when we examine savings rates around the world. Here's how the same $24K initial + $2,400 annual investment compares globally:
🇯🇵 Japan (0.5% savings):
- Stock Investment: $221,692
- Savings Account: $76,868
- Advantage: $144,824 (188% more wealth)
🇪🇺 Western Europe Average (3% savings):
- Stock Investment: $221,692
- Savings Account: $107,834
- Advantage: $113,858 (106% more wealth)
🇬🇷 Greece/Southern Europe (2% savings):
- Stock Investment: $221,692
- Savings Account: $93,975
- Advantage: $127,717 (136% more wealth)
🇰🇷 South Korea (2.5% savings):
- Stock Investment: $221,692
- Savings Account: $100,634
- Advantage: $121,058 (120% more wealth)
💡 The Global Lesson:
The lower your country's savings rates, the MORE dramatic the advantage of global index fund investing becomes. For investors in countries with minimal savings returns, staying in cash is essentially guaranteed wealth destruction when compared to broad market investing.
This is exactly why Warren Buffett's advice transcends borders - mathematical principles of compound growth work the same whether you're in New York, London, or Athens.
Note: Savings rates shown are approximate regional averages and may vary by institution and current market conditions. Always check current rates in your specific market for precise calculations.
---
Part 5: Building Your Value Investing Portfolio
Core Holdings (80% of portfolio):
AMEX:SPY - S&P 500 ETF (Large-cap US stocks)
AMEX:VTI - Total Stock Market ETF (Broader US exposure)
LSE:VUAA - S&P 500 UCITS Accumulating (Tax-efficient for international investors)
Satellite Holdings (20% of portfolio):
NASDAQ:QQQ - Technology-focused (Higher growth potential)
AMEX:VYM - Dividend-focused (Income generation)
NYSE:BRK.B - Berkshire Hathaway (Value investing & diversification)
---
Part 6: Implementation Strategy - Your Action Plan
Month 1: Foundation
Open a brokerage account (research low-cost brokers available in your region)
Set up automatic transfers from your bank
Buy your first AMEX:SPY shares
💡 Broker Selection Considerations:
Traditional Brokers: Interactive Brokers, Fidelity, Vanguard, Schwab
Digital Platforms: Revolut, Trading 212, eToro (check availability in your country)
Key Factors: Low fees, ETF access, automatic investing features, regulatory protection
Research: Compare costs and features for your specific location/needs
Month 2-12: Execution
Invest the same amount on the same day each month
Ignore market news and volatility
Track your progress in a simple spreadsheet
Year 2+: Optimization
Increase contributions with salary increases
Consider additional core holdings like LSE:VUAA for tax efficiency
Consider tax-loss harvesting opportunities
Visualizing Your DCA Strategy
Understanding DCA concepts is easier when you can visualize the results. TradingView offers various tools to help you understand investment strategies, including DCA tracking indicators like the DCA Investment Tracker Pro which help visualize long-term investment concepts.
🎯 Key Visualization Features:
These types of tools typically help visualize:
Historical Analysis: How your strategy would have performed using real market data
Growth Projections: Educational scenarios showing potential long-term outcomes
Performance Comparison: Comparing actual vs theoretical DCA performance
Volatility Understanding: How different stocks behave with DCA over time
📊 Real-World Examples from Live Users:
Stable Index Investing Success:
AMEX:SPY (S&P 500) Example: $60K initial + $500/month starting 2020. The indicator shows SPY's historical 10%+ returns, demonstrating how consistent broad market investing builds wealth over time. Notice the smooth theoretical growth line vs actual performance tracking.
Value Investing Approach:
NYSE:BRK.B (Berkshire Hathaway): Warren Buffett's legendary performance through DCA lens. The indicator demonstrates how quality value companies compound wealth over decades. Lower volatility = standard CAGR calculations used.
High-Volatility Stock Management:
NASDAQ:NVDA (NVIDIA): Shows smart volatility detection in action. NVIDIA's explosive AI boom creates extreme years that trigger automatic switch to "Median (High Vol): 50%" calculations for conservative projections, protecting against unrealistic future estimates.
Tech Stock Long-Term Analysis:
NASDAQ:META (Meta Platforms): Despite being a tech stock and experiencing the 2022 crash, META's 10-year history shows consistent enough performance (23.98% CAGR) that volatility detection doesn't trigger. Standard CAGR calculations demonstrate stable long-term growth.
⚡ Educational Application:
When using visualization tools on TradingView:
Select Your Asset: Choose the stock/ETF you want to analyze (like AMEX:SPY )
Input Parameters: Enter your investment amounts and time periods
Study Historical Data: See how your strategy would have performed in real markets
Understand Projections: Learn from educational growth scenarios
🎓 Educational Benefits:
This tool helps you understand:
- How compound growth actually works in real markets
- The difference between volatile and stable investment returns
- Why consistent DCA often outperforms timing strategies
- How your current performance compares to historical market patterns
- The visual power of long-term wealth building
As Warren Buffett said: "Someone's sitting in the shade today because someone planted a tree a long time ago." This tool helps you visualize your financial tree growing over time through actual market data and educational projections.
---
Part 7: Common Mistakes to Avoid
The "Perfect Timing" Trap
Waiting for the "perfect" entry point often means missing years of compound growth. Time in the market beats timing the market.
The "Hot Stock" Temptation
Chasing individual stocks like NASDAQ:NVDA or NASDAQ:TSLA might seem exciting, but it introduces unnecessary risk for beginners.
The "Market Crash" Panic
Every bear market feels like "this time is different." Historical data shows that patient investors who continued their DCA through 2008, 2020, and other crashes were handsomely rewarded.
---
Conclusion: Your Path to Financial Freedom
Value investing through broad index funds and dollar-cost averaging isn't glamorous. You won't get rich overnight, and you won't have exciting stories about your latest trade.
But here's what you will have:
Proven strategy backed by decades of data
Peace of mind during market volatility
Compound growth working in your favor 24/7
A realistic path to serious wealth creation
The Bottom Line: Warren Buffett's approach works because it's simple, sustainable, and based on fundamental economic principles. Start today, stay consistent, and let compound growth do the heavy lifting.
"Someone's sitting in the shade today because someone planted a tree a long time ago." - Warren Buffett
Educational Summary:
Understanding these principles provides a foundation for informed decision-making. As Warren Buffett noted: "The best time to plant a tree was 20 years ago. The second-best time is now" - emphasizing the educational value of understanding long-term investment principles early.
---
🙏 Personal Note & Acknowledgment
This article was not entirely my own work, but the result of artificial intelligence in-depth research and information gathering. I fine-tuned and brought it to my own vision and ideas. While working with AI, I found this research so valuable for myself that I could not avoid sharing it with all of you.
I hope this perspective gives you a different approach to long-term investing. It completely changed my style of thinking and my approach to the markets. As a father of 3 kids, I'm always seeking the best investment strategies for our future. While I was aware of the power of compound interest, I could never truly visualize its actual power.
That's exactly why I also created the open-source DCA Investment Tracker Pro indicator - so everyone can see and visualize the benefits of choosing a long, steady investment approach. Being able to see compound growth in action makes all the difference in staying committed to a strategy.
As someone truly said: compound interest is the 8th wonder of the world.
---
Disclaimer: This article is for educational purposes only and does not constitute financial advice. Past performance does not guarantee future results. Always consult with a qualified financial advisor before making investment decisions.

"Nifty 50 Chart Turns Cautious: Downside Risk Builds"1. **Rising Wedge Breakdown:**
* The index had been trading in a **rising wedge** pattern (purple converging lines).
* A **bearish breakdown** has occurred, suggesting potential for further downside.
* The price broke below the lower trendline with strong red candles and rising volume, validating the bearish move.
2. **Bear Flag Breakdown:**
* A smaller **bear flag** or **descending channel** pattern within the wedge broke down as well, reinforcing bearish sentiment.
3. **Support Zone Tested:**
* Price is currently hovering around a critical **horizontal support zone** between **24,081 – 24,240**, marked with black lines.
* The index is sitting just above this zone, and a clean break below could accelerate selling.
4. **Long-Term Uptrend Line:**
* A longer-term ascending trendline lies just below the current price (\~24,050 area).
* This could act as **last-resort dynamic support** before a larger correction.
---
* **Immediate Resistance**:
* 24,240 – Minor horizontal resistance
* 24,400 – Former support now turned resistance
* **Immediate Support**:
* 24,081 – Horizontal support
* 23,900–24,000 zone – Next key demand area
* 23,700 – Long-term trendline & psychological support
---
**Volume Analysis:**
* Recent volume spike on red candles indicates **stronger participation from sellers**.
* Bearish momentum is likely to continue unless volume dries up and bullish candles appear at support.

Buffett Steps Down, Berkshire Shares Pull Back from Record HighBuffett Steps Down, Berkshire Shares (BRK.B) Pull Back from Record High
Berkshire Hathaway has released its quarterly report, which came in slightly below analysts’ expectations:
→ Earnings per share: actual = $4.46, forecast = $4.72
→ Revenue: actual = $90.8bn, forecast = $89.7bn
However, the bigger news was not the weaker results, but the decision of legendary 94-year-old Warren Buffett to step down as head of the company after nearly 60 years in charge. According to Reuters:
→ Vice Chairman Greg Abel will take over leadership;
→ Buffett will still influence decisions and has said he does “not intend to sell a single share of Berkshire”.
In pre-market trading today, BRK.B shares are priced around $526, compared to Friday’s close above $541, which marked a historic high. The decline suggests a natural negative reaction by market participants to the news.
Technical Analysis of BRK.B Stock Price
The Berkshire Hathaway stock price is moving within an upward channel, and:
→ In 2025, it has outperformed the broader equity index, showing a strong recovery following the early April market selloff;
→ Following the recent news, the price will likely retreat from the upper boundary of the channel toward the median line, which may act as support (as it did in late April, as shown by the arrow).
The recent price action appears to be a false bullish breakout above the $535 resistance — a bearish signal.
It’s possible that the initial emotional market reaction may fade, and BRK.B shares could continue to outperform the S&P 500 (tracked via the US SPX 500 mini on FXOpen). Whether this scenario plays out will depend on the leadership and decisions of Greg Abel, especially as the company now holds a record cash reserve of nearly $350 billion.
This article represents the opinion of the Companies operating under the FXOpen brand only. It is not to be construed as an offer, solicitation, or recommendation with respect to products and services provided by the Companies operating under the FXOpen brand, nor is it to be considered financial advice.

Bitcoin $45k in 45 Days. Believe it or Watch It!Sometime people don't believe predictions because they need proof. Watch and learn people. Don't get caught holding the bag. Just ride the waves. No ema no alerts just market structure. I trade for fun and accuracy. This is a discipline sport so please watch and act accordingly. But this will play out exactly as expected. Go USA! #blackrock

Believe or Not- Blue SeasonBefore Donald Trump gets credit based on tariff's or anything like that I wanted to share the future of SPX 500 with everyone. It's definitely about to explode to a new all time high. Watch and learn. Market 101- Let's go USA!

Berkshire Hathaway | No More Apple Pie & Bank Bread!No More Apple Pie and Bank Bread | Buffett’s Recipe for Market Caution
Berkshire Hathaway has recently disclosed its earnings amid fluctuating around a $1 trillion valuation. A notable update is its continued reduction of stakes in overvalued assets, including a 20% decrease in holdings of Apple and Bank of America, boosting its cash reserves to $325 billion
Although Warren Buffett himself isn't favoring share buybacks at present, Berkshire Hathaway stands as a compelling investment option
Why Berkshire Hathaway's $325 Billion Cash Pile Signals Market Caution
The company's net earnings remain subject to significant fluctuations due to rules requiring valuation changes of investment holdings. However, there was a slight decline in operating earnings, mainly driven by lower insurance underwriting income. Despite this, that segment is historically volatile, and year over year aka YoY, the company has maintained strong performance.
Yea2date aka YTD, operating earnings have risen over 10%, totaling just under $33 billion compared to just below $29 billion last year. This points to an annualized earnings estimate of approximately $44 billion, implying a price2earnings aka P/E ratio of about 22, without factoring in over $320 billion in cash and significant investment holdings.
Excluding cash and investments, the adjusted P/E ratio is closer to single digits. Share buybacks have paused, reflected in a ~1% decrease in the outstanding shares YoY, signaling Berkshire's assessment of current market valuations.
Segment Highlights
The various business units within Berkshire Hathaway showcase its robust asset base and earning capacity. Insurance underwriting income saw a sharp YoY drop, but other business areas performed strongly. Income from insurance investments remained solid, and BNSF, its railroad subsidiary, also showed strong results despite a double digit YoY decline.
Berkshire Hathaway Energy continues its growth, cementing its position in the utility sector with significant renewable energy ventures. For context, NextEra Energy (NEE), with a market capitalization of $160 billion, posted quarterly earnings around 10% higher.
Berkshire's other controlled and non-controlled businesses contribute over $13 billion annually, underpinning its diversification and consistent earnings performance. This strength across segments underscores its formidable financial health.
Market Context
Currently, market valuations are elevated by historical standards.
Excluding periods of earnings dips, market enthusiasm is exceptionally high, with the S&P 500 P/E ratio nearing 30x, approaching levels last seen in 1999. Buffett and Berkshire appear to view a 3% yield from such a P/E as unattractive, especially when bonds offer higher returns.
The 2008 Playbook
Berkshire's track record of effectively utilizing its cash reserves is notable. Excluding its insurance float, the company still holds $150 billion in cash.
During the 2008 financial crisis, Berkshire leveraged its liquidity for strategic investments in companies like General Electric, Swiss Re, Dow Chemical, and Bank of America, as well as finalizing the full acquisition of BNSF in 2010. This proactive use of capital proved advantageous.
The current strategic sale of assets suggests Berkshire is preparing for potential market downturns. Given high S&P 500 valuations, reallocating part of an S&P 500 position into Berkshire Hathaway could be wise, ensuring exposure to a cash-rich portfolio capable of seizing future opportunities. Meanwhile, Berkshire’s earnings are valued lower than the broader market, potentially minimizing major downturn risks.
Investment Risks
A key risk is that timing the market is inherently challenging, with the adage "time in the market beats timing the market" serving as a caution. If Berkshire's market outlook is incorrect, its $300+ billion in cash could underperform while broader markets remain strong, which would diminish its appeal as an investment.
Final Thoughts
Berkshire Hathaway has taken the bold step of liquidating some of its most significant and priciest holdings, opting to incur capital gains taxes to increase liquidity. This move has bolstered its cash position to $325 billion, $150 billion above its float level. Meanwhile, its strong operational businesses continue generating healthy cash flow.
Drawing on its successful strategies during the 2008 crisis, Berkshire appears to be positioning itself for another downturn amid current high market valuations. We advise investors to consider shifting part of their S&P 500 exposure into Berkshire Hathaway for enhanced diversification and potential benefits in a market correction, long story short Berkshire Hathaway remains a robust investment opportunity but wont make millionaire!
What do you think moonypto fam?

Why Invest in CONMED Corp (CNMD)?Why Invest in CONMED Corp (CNMD)?
Strong Earnings Growth – CONMED has experienced a remarkable increase in earnings, with EPS surging by 104% year-over-year and net income rising by 105% YoY. This indicates strong financial performance and profitability momentum.
Attractive Valuation – The stock is currently trading at a P/E ratio of 13.79, which is significantly lower than its historical averages. This suggests that CNMD may be undervalued relative to its past performance and industry peers.
Consistent Revenue Growth – The company reported revenue of $1.31 billion for the last year, marking a 5% increase compared to the previous period. This steady growth highlights CNMD’s ability to expand its market presence.
Improving Margins and Efficiency – CONMED has seen an increase in operating income (+66% YoY), operating margin (+58% YoY), and return on assets (+104% YoY), demonstrating better cost management and operational efficiency.
Dividend and Low Payout Ratio – The company pays a dividend of $0.80 per share, yielding approximately 1.35%, with a conservative payout ratio of 18.6%. This allows room for future dividend increases while maintaining financial flexibility.
Healthcare Sector Stability – As a medical technology company specializing in surgical devices, CONMED operates in a defensive sector that tends to be resilient during economic downturns. This provides investors with a level of stability.
Solid Balance Sheet and Liquidity – The company has a current ratio of 2.3, indicating strong short-term liquidity. Additionally, its quick ratio of 0.94 suggests it can cover its immediate liabilities effectively.
Final Thoughts:
CONMED presents a compelling investment case due to its strong earnings growth, attractive valuation, improving profitability, and stable position in the healthcare sector. However, potential investors should always consider market conditions and individual risk tolerance before making investment decisions.

Reasons to Invest in CVS Health (CVS)Reasons to Invest in CVS Health (CVS)
Strong Market Position
CVS Health is a leading healthcare company with a diversified business model, including retail pharmacies, insurance, and healthcare services. Its extensive network provides a competitive advantage.
Attractive Valuation
CVS is currently trading at a P/E ratio of approximately 12.23, which is lower than its historical average of 17.55. This suggests the stock may be undervalued compared to its long-term performance【41】.
Consistent Free Cash Flow (FCF)
The company generates significant free cash flow, which allows it to invest in growth, reduce debt, and return capital to shareholders.
Dividend and Shareholder Returns
CVS has a stable dividend policy with a payout ratio that allows for sustainable growth while reinvesting in the business【40】.
Resilient Business Model
The healthcare industry is defensive, meaning CVS can perform well even in economic downturns. The company benefits from consistent demand for prescriptions and healthcare services.
Future Growth Potential
CVS is expanding its healthcare services through acquisitions and technology-driven solutions. Investments in Medicare, pharmacy benefits, and digital health are expected to drive long-term growth.
Would you like a deeper fundamental comparison between CVS and its competitors?

Occidental Petroleum - Warren Buffett's Strong EndorsementWhy Buying Occidental Petroleum (OXY) is a Good Investment
Warren Buffett's Strong Endorsement
Berkshire Hathaway, led by Warren Buffett, has been consistently increasing its stake in OXY, holding over 25% of the company. Buffett's long-term approach and confidence in OXY suggest strong fundamentals and future growth potential.
Solid Financial Performance
OXY has a P/E ratio of 20.95 and a profit margin of 19%, showing strong profitability in the energy sector. Its ROE of 15% indicates effective management of shareholder equity.
Strong Free Cash Flow (FCF)
The company generates around $1 billion in free cash flow, which enables it to reduce debt, buy back shares, and pay dividends—key factors Buffett looks for in an investment.
Favorable Industry Trends
With growing global energy demand and OXY's focus on low-cost production, the company is well-positioned to benefit from higher oil prices and long-term energy market stability.
Debt Reduction & Financial Strength
OXY has significantly reduced its debt-to-equity ratio (0.85), strengthening its balance sheet after the Anadarko acquisition. Buffett prefers companies that prioritize financial discipline.
Carbon Capture & Future Growth Potential
OXY is a leader in carbon capture technology, positioning itself for long-term sustainability as the world moves toward cleaner energy solutions. This gives it a competitive edge in the evolving energy market.
Buffett's Potential Full Acquisition
With Berkshire Hathaway increasing its stake and securing regulatory approval to buy up to 50% of OXY, there is speculation that Buffett may eventually acquire the entire company. This could drive further price appreciation for OXY shares.
Conclusion
Buffett's heavy investment in OXY, combined with strong financials, solid cash flow, and promising energy market trends, makes the company an attractive value play for long-term investors.

What makes a good director?This analysis is provided by Eden Bradfeld at BlackBull Research—sign up for their Substack to receive the latest market insights straight to your inbox.
I’ve been spending a lot of time thinking about good governance and good boards. There is a lot that can be said about bad boards, but a lot less is said about what makes a good director. So what makes a good director? I'll start with a quote from Grandpa Buffett’s recent letter (published yesterday):
During the 2019-23 period, I have used the words “mistake” or “error” 16 times in my letters to you. Many other huge companies have never used either word over that span. Amazon, I should acknowledge, made some brutally candid observations in its 2021 letter. Elsewhere, it has generally been happy talk and pictures.
I have also been a director of large public companies at which “mistake” or “wrong” were forbidden words at board meetings or analyst calls. That taboo, implying managerial perfection, always made me nervous (though, at times, there could be legal issues that make limited discussion advisable. We live in a very litigious society.)
Also worth his thoughts on CEOs and schooling (I have never really understood the point of an MBA:
One further point in our CEO selections: I never look at where a candidate has gone to school. Never!
Of course, there are great managers who attended the most famous schools. But there are plenty such as Pete who may have benefitted by attending a less prestigious institution or even by not bothering to finish school. Look at my friend, Bill Gates, who decided that it was far more important to get underway in an exploding industry that would change the world than it was to stick around for a parchment that he could hang on the wall. (Read his new book, Source Code.)
Not long ago, I met – by phone – Jessica Toonkel, whose step-grandfather, Ben Rosner, long ago ran a business for Charlie and me. Ben was a retailing genius and, in preparing for this report, I checked with Jessica to confirm Ben’s schooling, which I remembered as limited. Jessica’s reply: “Ben never went past 6th grade.”
Anyway — some thoughts on what makes a good director, from observation:
Accountants and lawyers rarely make a good director. There are exceptions¹, but often I think a “professional” is conflated with a “good businessperson”. Think of the “professionals” who have sat on the board of Fletcher Building and added dubious value.
Founders, and owner-operators (or former owner-operators) often make a good director because they innately understand what makes a business tick. To quote the Druck’s former boss — “it’s all cash in, cash out, son”
Trust is crucial. To paraphrase St. Charlie Munger — “a web of trust is important…and be careful whom you trust”
The tick boxes that many boards do these days are rarely useful. There is an inordinate amount of focus on tick boxes, and not enough on the actual business activities.
Directors who see their duty to the shareholders and company tend to be best. This seems obvious, but is not always put into practice.
Industry experience, funnily enough, is also important. You need to understand what you sell, who your customer is, and how you make a buck.
A strong CEO is also important — think about Buffett, Gates, or Jobs. A board should provide guidance, but the CEO should be the guiding light.
If you have the fortune of having a great CEO, you ought to let them do their thing and not micro-manage them. Micro-management has never worked out, and is the domain of mediocre mid-level executives who eat depressing food.
Equally, a strong board is important — while you want your CEO to be an all-star, you don’t want those little dogs that live in handbags as board members — that defeats the point.
Sadly, not many CEOs are too amenable to pit bulls.
High compensation is not important. Ideally your board members should be independently wealthy. If a large part of their income is derived from their board comp, you will find they magically seem to have roles on five different boards — all in different industries.
To wit, from Buffett (quoting him a lot today, I know!): “Over the years, board “independence” has become a new area of emphasis. One key point relating to this topic, though, is almost invariably overlooked: Director compensation has now soared to a level that inevitably makes pay a subconscious factor affecting the behaviour of many non-wealthy members. Think, for a moment, of the director earning $250,000–300,000 for board meetings consuming a pleasant couple of days six or so times a year. Frequently, the possession of one such directorship bestows on its holder three to four times the annual median income of U.S. households.”
To that effect, just because a board member is on another board is not an endorsement.
Buying stock in a company with your own money, if you are a director, is a good thing. Being “truly independent” and having no stock is a warning sign — the director’s interests are aligned with his or her director’s fees, rather than the trajectory of the company.
¹ If you are one of my lawyer or accountant friends — you know who you are — you are the exception.

Will Berkshire Hathaway hit $525 before a healthy correction?📈 Introduction Berkshire Hathaway (BRK.B) has shown a consistent pattern of growth over the past years, forming well-defined bullish channels with predictable wave lengths. The current price action suggests a potential healthy correction before another upward rally that could see prices reach the $525 mark.
💡 Key Observations from the Chart
1 - Channel Dynamics:
The price has respected two major ascending channels over the last few years. Each channel has shown waves of sustained upward momentum, lasting approximately 731 days and 790 days, respectively. This consistent cyclicity points to a reliable trend structure.
2 - Correction Phase Ahead?
Based on historical patterns and technical indicators, we might see a short-term correction into the $450-$460 range. This is supported by:
Overbought signals from the Stochastic Oscillator (75/77).
A potential test of the lower boundary of the current ascending channel.
3 - Upside Potential to $525 ~ $550+
After the correction, the next bullish phase could see prices push toward key resistance levels at $491.67 and ultimately $525.90. The confluence of the SMA and VWAP levels reinforces this projection, with strong support near $457.51 acting as a springboard for the next rally.
What’s Next?
The stock remains in a long-term uptrend, and the current dip should be seen as an opportunity rather than a threat. With volatility at 9.63%, the market appears poised for a calculated breakout in the medium term.
What do you think?

BOUNCE FOLLOWED BY LOWER PRICES FORECASTEDWhile the higher degree long-term outlook for this dividend giant is bullish, the short-term outlook is not likely to bring new all-time highs. Earlier this year we anticipated new all-time highs, but that changed when KO hit it’s 63.18 low last week. What changed the forecast was the technicals surrounding that low. While the price action is currently cooked to the downside, there are no clear indications of a reversal, with the weekly RSI indicating more room to the downside, and the MACD supporting that theory. This tells us to turn to the most telling indicator, which is volume, which indicates there is still strength to the downside. That said, we know the market does not move in straight lines and a strong bounce off the 63.18 low is likely. We currently forecast that bounce to target the round number zone of 70, forming a B-Wave rejection of higher prices, that will be followed by a C-wave, which will likely target the weekly point of control around 60. With that in mind, C-waves can truncate their targets, especially when the ticket involved is a popular long-term dividend target like KO, and we are talking about a long-term low that will create a significant buying opportunity. That said, if you can deal with the near-term volatility, the 63 zone may not be a bad entry zone.

Berkshire Hathaway Inc. New (log)Hello community,
Weekly graph on logarithmic scale.
A quick look in the rearview mirror.
What can we say about the performance of the fund of the "god" of investment, except BRAVO!
A little quote that I love:
"Wall Street is the only place where people get into a Rolls Royce to get advice from those who take the subway."
Make your own opinion, before placing an order.
► Thank you for boosting, commenting, subscribing!

Berkshire Hathaway Testing Crucial Levels: Will the Bulls WIN? Berkshire Hathaway (BRK.B) is approaching key levels that could dictate its next big move!
Upside Potential : A break above $465.04 could push the stock toward the next target at $473.18, where bulls are likely to step in for a rally. Watch for increased momentum if price closes above these resistance levels.
Downside Risk: If the stock fails to hold the current support around $459, a drop toward the lower support zone at $448.29 could be in play. Bears should be ready for action if the price breaks below this level.
Stay sharp, traders—both scenarios present strong opportunities. Keep an eye on price action and volume!
Happy Trading
Mindbloome Trader

Understanding Warren Buffett’s Investment PhilosophyWarren Buffett is arguably one of the most successful investors of all time. Over the years, he has developed a set of principles and strategies over his career. He was inspired by the teachings of key financial thinkers like Phil Fisher, Benjamin Graham and Charlie Munger.
Key Influences
Phil Fisher
Fisher’s approach focusses on quality companies with long-term growth potential, emphasizing focused portfolios and long-term holdings. He believed in gathering information about a company beyond what’s readily available. His lessons on maintaining a focused portfolio and committing to long-term holdings are clear influences on Buffett’s patient, value-driven investment philosophy.
Benjamin Graham
Known as the father of value investing, Graham’s core principle was to buy stocks at a price lower than their intrinsic value, creating a margin of safety (MOS). This strategy helps mitigate risk and increase the likelihood of future gains. Buffett absorbed Graham’s teaching on finding stocks that are undervalued and buying them at the right price— definitely a large contributor of his investment success.
Charlie Munger
Munger is Warren Buffett’s long-time business partner. He introduced the concept of economic moats, which refers to a company’s long-term, sustainable competitive advantages. Munger advocates investing in businesses that can fend off competition and maintain profitability over time. This philosophy drives Buffett’s focus on companies with strong market positions and solid long-term potential, favoring these over shorter-term, speculative opportunities.
Buffett's Investment Approach
1 - Buy for the Long Term. Buffett’s strategy emphasizes identifying companies that can consistently perform well over long periods. He holds stocks for years, or even decades, often looking for opportunities where other investors may overlook value.
2 - Buy at the Right Price . Buffett is known for his discipline in waiting for the right moment to invest. His approach ensures he doesn’t overpay, instead seeking stocks when they are priced below their true value, maintaining a margin of safety.
3 - Buy the Right Stocks . Buffett doesn’t just buy cheap stocks, he buys quality companies with sustainable advantages. His goal is to invest in firms with strong business models that will continue to perform well regardless of market conditions.
Warren Buffett emphasizes investing in companies with simple and clear business models , ones that fall within his circle of competence. He prefers to thoroughly understand the operations, products, and long-term prospects of a company before making any investment.
This principle is combined with in-depth analysis of how the company operates and how sustainable its valuations and future growth prospects are. If a business model is too complex or outside his expertise, he avoids it.
He prioritizes companies with integrity and transparency in their management. He believes in backing leaders who are passionate, have strong vision and execution capabilities and who use shareholder funds wisely. Trusting management to run the company effectively, with efficiency and accountability, is critical for long-term success in Buffett’s eyes.
Investing in quality companies isn’t enough—Buffett also insists on buying them at attractive prices. He maintains a strict discipline of buying with a margin of safety, ensuring the price paid is lower than the company’s intrinsic value. This means waiting for opportunities to buy great businesses at fair prices rather than settling for fair businesses at attractive prices , which may not perform well over time.
Buffett has made many of his lessons and strategies available to the public through his letters to shareholders and partnership letters. These documents offer insight into his investment approach, decision-making process, and lessons from both successes and failures. There are several key books that capture Buffett’s life, philosophy, and strategies in greater detail:
Warren Buffett’s Ground Rules
The Warren Buffett Way
Buffett: The Making of an American Capitalist
The Warren Buffett Portfolio
The Snowball: Warren Buffett and the Business of Life
Each of these resources provides a comprehensive look into the mind of one of the most successful investors of all time, offering practical advice and detailed case studies of his investments.
________________________________

SPX Technical Analysis BreakdownHere is my technical breakdown of SPX on the 4 HOUR time frame...
We started the month of May with an up-trend trend line bounce on a key support level which saw SPX climb slightly passed the support zone to surpass another key zone
After this climb, we saw it accumulating in a RANGE from 14th May - 29th May, where it eventually broke to the downside. Normally this is a trade we would enter as it's a big volume range break, however, it broke downwards to touch a key support zone. In my experience this is NOT a trade worth taking as they are opposite confirmations.
Later in July we finally got the RANGE trade we were looking for, when 17th June - 5th July we saw it's ACCUMULATING RANGE break with large volume to the UPSIDE. This trend was worth entering as it was heading towards a key resistance area, a great place to exercise your exit strategy.
Once SPX hit the key resistance zone it bounced off and formed a downward trend line that would also be hit later down the line, confirming its relevance.
When SPX hit the resistance line it found plenty of BULL TRADERS on the key SUPPORT level and bounced back up to touch the key RESISTANCE level on 20th AUGUST, where once again it touched the downward trend line.
WHAT TO LOOK FOR NOW -
I'm watching to see if SPX enters the resistance zone and breaks the trend-line and exits the zone, that's two confirmations for an uptrend which makes me confident in the long trade.
On the other side, i'm waiting for the trend to retest key support zones where I will be waiting for a key zone breakout or bounce back to the resistance level.

AAPL: Warren Buffett accelerates sale of Apple sharesBerkshire Hathaway, led by Warren Buffett, has dramatically reduced its holdings in Apple Inc., marking a significant shift in its investment strategy. Over the past seven quarters, Berkshire has been consistently selling off its Apple shares, with the process intensifying in the second quarter of 2024. During this period, Buffett disposed of over USD 75 billion in stocks, including a substantial portion of his Apple holdings, reducing Berkshire’s stake in Apple from 789 million shares at the end of Q1 to 400 million.
The massive sell-off contributed to Berkshire Hathaway’s cash reserves reaching a record high of USD 276.9 billion. Buffett’s strategic move reflects broader market sentiments, where investors are increasingly cautious, favouring the security of high-yield US government bonds amid expectations of a rate cut by the Federal Reserve.
Technical analysis of Apple Inc. (NASDAQ: AAPL)
Reviewing Apple’s stock performance in light of recent developments:
Timeframe : Daily (D1)
Current trend: the stock is in a downtrend, exacerbated by the negative sentiment pervading the stock market and Buffett’s significant sell-off
Resistance level : 225.60 USD
Support level : the previous support at 214.50 USD has been breached
Short-term target : if the downtrend continues, the next target could be 181.45 USD following a rebound from the broken support
Medium-term target : a continued decline might see the stock reaching 172.70 USD
Potential uptrend scenario : if market conditions improve and the stock reverses its current trend, a potential growth target could be set at 235.00 USD
Investors and market watchers should closely monitor Apple’s stock, particularly in the context of Berkshire Hathaway’s reduced exposure and broader market dynamics. A significant divestment by a major investor like Buffett could influence other stakeholders and affect Apple’s stock performance in the near to medium term.
—
Ideas and other content presented on this page should not be considered as guidance for trading or an investment advice. RoboMarkets bears no responsibility for trading results based on trading opinions described in these analytical reviews.
The material presented and the information contained herein is for information purposes only and in no way should be considered as the provision of investment advice for the purposes of Investment Firms Law L. 87(I)/2017 of the Republic of Cyprus or any other form of personal advice or recommendation, which relates to certain types of transactions with certain types of financial instruments.
Risk Warning: CFDs are complex instruments and come with a high risk of losing money rapidly due to leverage. 65.68% of retail investor accounts lose money when trading CFDs with this provider. You should consider whether you understand how CFDs work and whether you can afford to take the high risk of losing your money.

Berkshire Hathaway Trims Apple Stake, Cash Reserves Hit New HighBerkshire Hathaway (NYSE: LSE:BRK ), the conglomerate led by legendary investor Warren Buffett, released its Q2 2024 financial report, revealing significant portfolio adjustments and a surge in cash reserves. The company's strategic moves have sent ripples through the market, reflecting a cautious stance amid economic uncertainties.
Major Reduction in Apple Holdings
In a surprising move, Berkshire Hathaway (NYSE: LSE:BRK ) slashed nearly half of its Apple holdings, reducing its stake from 790 million shares to 400 million shares—a substantial 49% decrease. This follows earlier reductions, including a 1% sell-off in Q4 2023 and a 13% cut in Q1 2024. The decision to pare down Apple, which has been a cornerstone of Berkshire's portfolio, underscores Buffett's strategic shift in response to potential changes in U.S. tax policy. At the annual shareholder meeting in May, Buffett cited the expectation of a possible increase in U.S. tax rates as a key reason for taking profits on his Apple position.
Record Cash Reserves
Berkshire Hathaway's cash reserves soared to an unprecedented $276.9 billion, up from $189 billion in Q1 2024. This massive increase was bolstered by $75.5 billion in stock sales during the quarter. The substantial liquidity positions the company advantageously for potential market downturns or opportunistic acquisitions.
Systematic Reduction in Bank of America Stake
In addition to trimming its Apple holdings, Berkshire Hathaway has been steadily reducing its position in Bank of America, its second-largest holding. Regulatory filings indicate that in the 12 trading days leading up to August 1st, Berkshire sold approximately $3.8 billion worth of Bank of America stock. This systematic reduction reflects a broader strategy of rebalancing its portfolio amid evolving market conditions.
Strategic Implications
Berkshire Hathaway's moves highlight a cautious yet opportunistic approach. The significant increase in cash reserves suggests that Buffett and his team are preparing for potential market volatility and looking to capitalize on future investment opportunities. By reducing exposure to major holdings like Apple and Bank of America, Berkshire is diversifying its risk and positioning itself to navigate an uncertain economic landscape.
Market Reaction
The response of the market to Berkshire Hathaway's (NYSE: LSE:BRK ) financial report has resulted in polarized opinions. While certain investors interpret the divestment in Apple and Bank of America holdings as a prudent risk management tactic, others express apprehension regarding the potential repercussions for these stocks, given Berkshire's influential standing in the market.
At the time of writing, LSE:BRK stock has experienced a decline of 3.42% and is currently trading with a weak Relative Strength Index (RSI) of 37.83, signaling a potential trend reversal subsequent to a prolonged bearish trend. Notably, the majority of moving averages portray a bearish trend, a substantial observation considering the widespread decrease in both stock and crypto assets today.
Conclusion
Berkshire Hathaway's Q2 2024 financial report underscores the company's adaptive strategy in a dynamic market environment. With record cash reserves and a rebalanced portfolio, Berkshire Hathaway remains well-positioned to seize future opportunities while mitigating risks. Investors will be closely watching Buffett's next moves as economic conditions evolve.
For more detailed insights and analysis on Berkshire Hathaway's strategic adjustments and their market implications, stay tuned to our updates.

Time to short, TP 208.53Following daily and got a short signal from my indicator.
TP1 214.62
TP2 208.53
SL Stop above 222 candle close.

Million dollar stock.Berkshire Hathaway breaking out versus Gold*Note #BRK does own Barrick Gold #ABX
Very interesting chart pattern
25 years in the making
The close of September should mark a confirmed breakout, of Warren Buffet's famous holding company, against Gold on a quarterly basis.
More evidence of a Melt Up in paper assets? And the continuation of the Bull market in the "roaring 20's"
If this is a continuation structure the amplitude suggests that one Berkshire Share, could be converted into well over 530 ounces of Gold.
At current prices that would equate to over a million dollars per share!

PG - A stock to buy for the long termFor long-term investors, Procter & Gamble presents a compelling opportunity due to its strong fundamentals and growth prospects. PG’s consistent financial performance, characterized by steady revenue growth and robust profit margins, underscores its resilience and ability to generate shareholder value. The company’s strong brand portfolio and market leadership in key product categories provide a competitive moat, ensuring long-term revenue stability.
The company’s strong balance sheet and cash flow generation capabilities provide a solid financial foundation for dividend growth and share buybacks while also investing in growth opportunities. For long-term investors, this translates to both income and potential capital appreciation.

Chubb Stock Jumps After Buffett's Berkshire Reveals $6.7B StakeChubb shares ( NYSE:CB ) jumped over 8% in late trade on Wednesday after Warren Buffett's Berkshire Hathaway revealed a $6.7 billion stake in the Zurich-based insurer. Buffett recently told shareholders that property-casualty insurance provides the core of Berkshire's well-being and growth. Berkshire had been building its position in Chubb since 2023, but had not previously disclosed the stake after the SEC granted it permission to keep the holding confidential.
Berkshire's stake of nearly 26 million shares in Chubb ( NYSE:CB ), one of the world's largest publicly traded property-casualty insurers, had a market value of around $6.7 billion as of March 31, making it the conglomerate's nineth largest holding. The investment is driven by Berkshire's heavy footprint in the insurance industry, which Buffett recently told shareholders that "property-casualty insurance" provides the core of Berkshire's well-being and growth.
The stock has continued to track higher since bottoming out in June last year, with the trend gathering momentum after the 50-day moving average crossed above the 200-day MA to form a bullish golden cross signal. Recently, the stock has traded within an ascending triangle, indicating a continuation of the longer-term uptrend.
Moreover, Chubb ( NYSE:CB ) has a Relative Strength Index (RSI) of 71.75 which is overbought hence, a trend reversal might lurk in the corners.
