After over a day of retracement What is next for BTCWatch closely as we have a descending trend line forming that could lead to an EPIC bounce! Don't buy the initial break out (IMO) wait for the retest and resumption! Good luck out there and Have a Terrific Taco Tuesday!
Watch

AFTER 2 WEEKS OF MASSIVE MANIPULATION TO THE DOWNSIDE! ADABTCADA BTC pair is finally getting released from it's shackles! Watching the bloodbath that was the ADA/BTC chart over the past 2 weeks. ADA is finally seeing the light of day! CAUTION! More Manipulation could still be in PLAY! I'm personally looking to long after a foothold over 0.00001900 is found but THINGS ARE LOOKING UP AND WE SHOULD BE READY FOR AN INTENSE BREAKOUT!

What to EXPECT from Ol' BTC in the next 12hThis is a look at the scenarios I think most likely for BTC in the next 12 hours.. I would definitely say we have a high probability of breaking the ATH by tomorrow however there is a 25% (IMO) that we fail to hold the short-term trend and break to lower support before we bounce. It is the weekend coming up so don't rule out foul play for OL' Bitty!

ADABTC PAIR IS BREAKING OUT!WATCH FOR A REBOUND OFF THE TRENDLINE! IF we bounce we could easily see a bigger move to new ATHs! Do not trade until we have a confirmed bounce! If you get in now I'm confident you'll be profitable within at least a week but we want to wait to see if we can get a better ticket on the train so to speak!

ADA BTC PAIR INDECISIVE!!WHAT FOR CRITICAL SUPPORT around 2100 SATS! If this breaks too heavily we could be headed for the mid 1900s SATS BEFORE a V-SHAPED RECOVERY!!!! IF this happens or if it holds 2100, I expect a brand new buy round to begin with exponential GAINS!! KEEP YOUR EYES PEELED!!!

ADA and BTC pair WATCH CLOSELYWe have broken out of the descending wedge and have entered a very bullish flag! Watch for continued trading in the support and be prepared for a breakout! Potential for breaks to the lower side are possible but less likely!

BTC IS PRIMED TO BREAK OUTA Double bottom has just formed on the 1h chart and on the 4h hour chart has crossed above the 60 & 120 MA retraced and his now headed back above them! This historically during a bull run has led to 100%+ rallys!!! GET READY


ADA looks CLEARED FOR TAKE OFF! ADA BTCI have highlighted the double bottom formation as well as the VERY BULLISH GREEN DOT ON EVERY TIME FRAME UP TO 3H (should appear on the 4h and greater soon!)
The RSI is in the 30 range and the trigger waves are signaling a reverse trend about to go down! GET READY!!!

ETH and USDT taking a breathWATCH THE NEXT 2 hours for next confirmation of short term trend! LETS GET IT!

Weekly Outlook! 3/1 - 3/5Here we go over last weeks video and we take a look at a few things we are keeping an eye on for the coming week!

Bearish-Crab PatternGood morning and good weekend to everyone. We now are climbing steady. We since noon yesterday now can see a trend going up successfully. The market has flipped a switch to follow another Flubberbuster. We now have a Bearish-Crab pattern. We all on February 11 are going to a 1.10 mark. Small dip is able to be possible at 1.05 this evening. We on the 10 at 2:30 will enter a dip down to .9103030 or lower. This morning we all can see dip after 1.05. On February 9 we all can see a dip to .92916 or less. Not moneies advice. The gains forward.

A Hunch And A Pretty Picture Show OMU Headed For 18.50When looking at OMU using the 15min, 4H and 1D charts you can tell that when it broke its resistance it meant business. Tradingview has many analysis that carefully point this out. We want to look at the W chart. Yup! The chart where one candle is an entire week. That one!
Since we are all about grand perspective, we'll be following this over time and using it as an opportunity to learn about how financial services companies (who may argue, are refusing to move with the times and honour the new rules of their markets) will fair in this new world.
This chart illustrates an inverted head-and-shoulders:
showing entry above 13.00,
a stop loss level around 11.25 and
a possible take profit at 16.50.
But for the purposes of this watching exercise we are more interested in the ledge created between late January 2020 and mid February 2020 of 17.99. We believe OMU will continue to rise, it will beat those ledge levels and kiss 18.50 - possibly riding those level for a while before falling again.

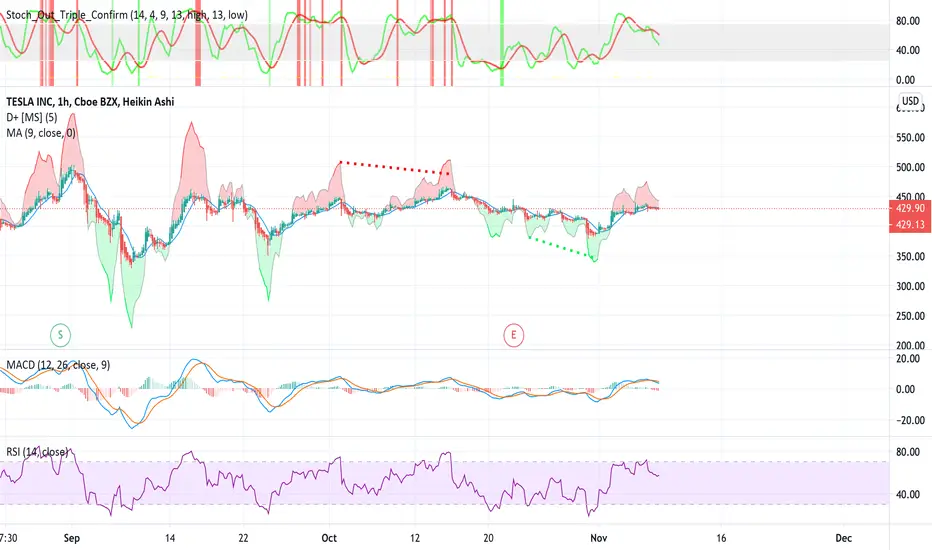
Shorting Watch Party Part 2We are getting closer and closer to Teslas correction. With an RSI of 79.6 and growing bearish divergence from Divergence+, I will be going with the 4 hour chart when a sell signal is given and will short Tesla to $500 a share. MACD shows room for more growth as bullish divergence is growing, but it will soon come to an end. We may see the fall of Tesla start this week. I will let you know when I buy into my position and position info. Still watching at this point.
Best of luck to everyone looking to short Tesla!

TSLA Still Has Room To Fall Still watching TSLA, based on technical indicators I believe is still has room to fall before putting in a big call position.
nzdusd short then longprice hits that 38.2 today and sendsa reversal back to the 78.2 level by tommorow watch out

XPEL: Ascending Triangle, confirmed and filled 100%Ascending Triangle, confirmed and filled 100%
Watching for the next move
If it flags, may move even higher.

MAXR: Possible reversal after confirmed ascending triangleAscending triangle, confirmed
May reverse on a down trend after 2018 gap fill.
Watching

GBPUSD TechnicalsHere's s full analysis of GBPUSD daily timeframe. The pair is making an obvious higher highs and higher lows from the daily perspective'
Along with confluences around the current price, I am extremely neutral on this and would follow through for a buy or sell signal in the week

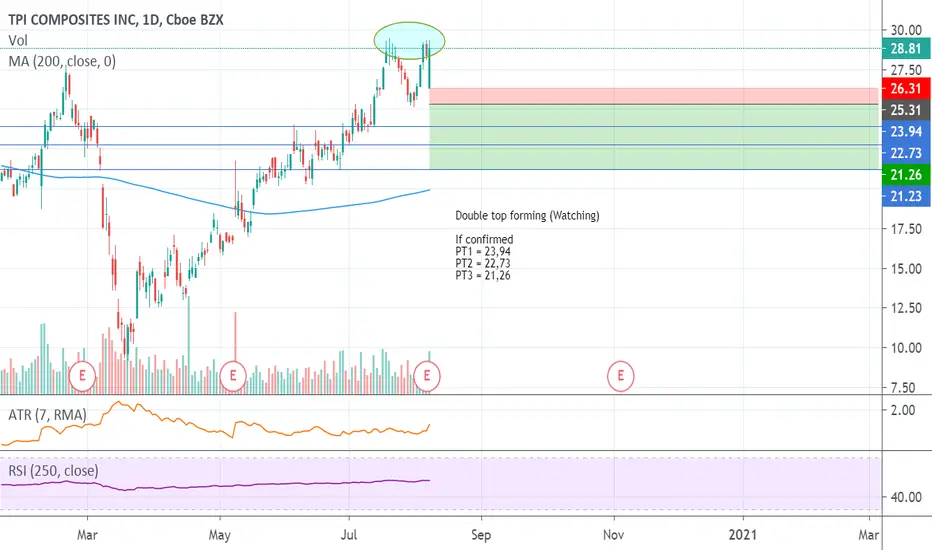
TPIC: Double Top forming, WatchingDouble top forming (Watching)
If confirmed
PT1 = 23,94
PT2 = 22,73
PT3 = 21,26
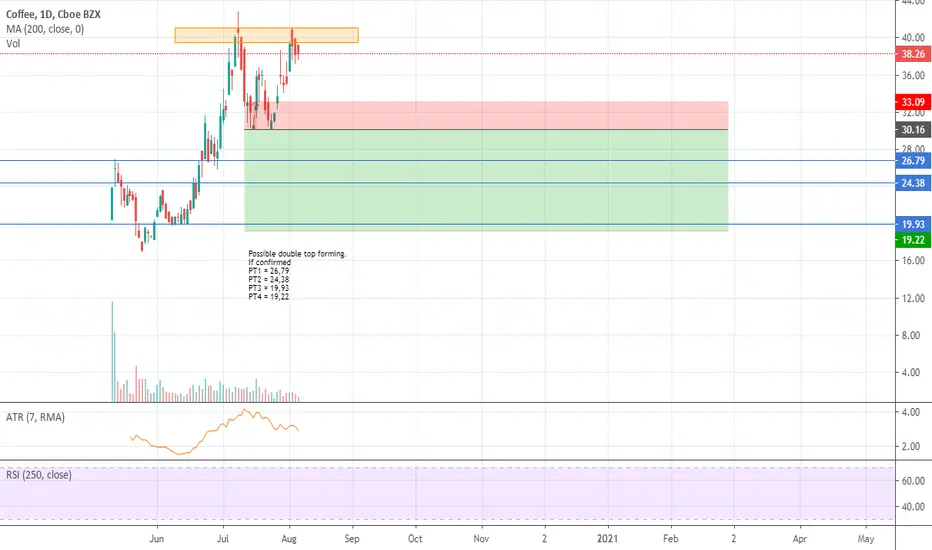
KC: Possible double top forming, watchingPossible double top forming.
If confirmed
PT1 = 26,79
PT2 = 24,38
PT3 = 19,93
PT4 = 19,22
AUDJPYLooking for short-term entry on AUDJPY. Retracement probable, with ~even risk:reward. For improved entry, wait for consolidation/chop between 75.3 and 76.3.
Risk-off sensitive. Manage exposure accordingly.

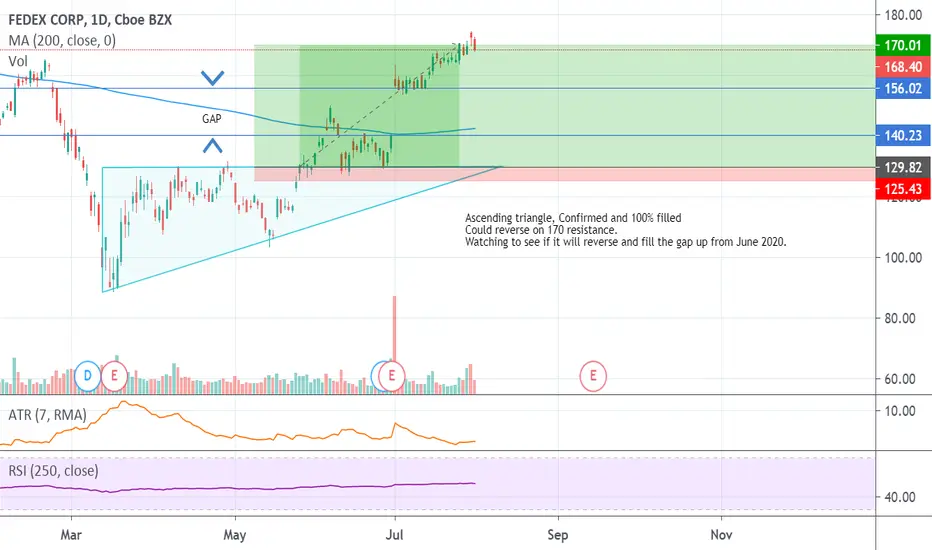
FDX: Ascending triangle, Confirmed and 100% filledAscending triangle, Confirmed and 100% filled
Could reverse on 170 resistance.
Watching to see if it will reverse and fill the gap up from June 2020.