#EURUSD 1H Potential riseHello Traders
I see the EUR/USD bullish wave and the price has fallen in a corrective manner. I expect another bullish wave to start from here.
Wave-analysis

Indicators for trading using Bill Williams' Profitunity strategyI published 3 indicators for trading using Bill Williams' Profitunity strategy. For each indicator, I have added a visual and detailed description in English and Russian. In this post I will briefly describe these indicators and how I use them together.
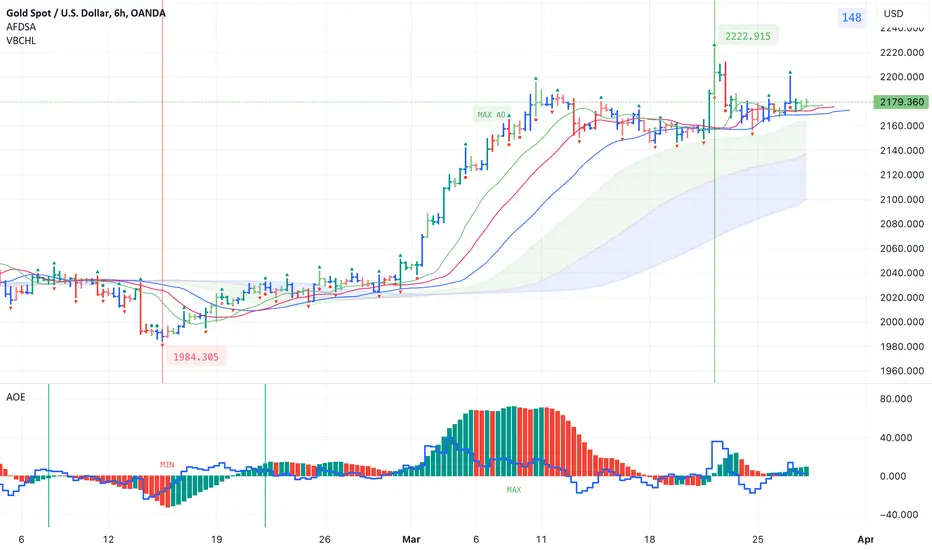
AFDSA indicator (Alligator + Fractals + Divergent & Squat Bars + Signal Alerts)
Includes Williams Alligator, Williams Fractals, Divergent Bars, Market Facilitation Index, Highest and Lowest Bars, maximum or minimum peak of the Awesome Oscillator, and signal alerts based on Bill Williams' Profitunity strategy:
Bullish and Bearish Divergent Bar Signal + Squat Bar + Green Bar + Fake Bar + Awesome Oscillator Color Change + AO Divergence.
Crossing the green line (Lips) of an open Alligator.
Formation of a fractal.
Signal about the breakdown of the last upper or lower fractal.
Signal about the appearance of a new maximum or minimum peak of AO in the interval of 140 bars from the last bar.
I also added an Alligator display for the higher timeframe, for example, if the chart timeframe is 1 hour, then the higher timeframe will automatically be 4 hours, if the chart timeframe is 4 hours, then the higher timeframe will be 1 day, etc.
AOE Oscillator (Awesome Oscillator + Bars count lines + EMA Line)
Includes the Awesome Oscillator with two vertical lines at a distance of 100 and 140 bars from the last bar to determine the third Elliott wave by the maximum peak of AO in the interval from 100 to 140 bars according to Bill Williams' Profitunity strategy. Additionally, a faster EMA line is displayed.
I also added display of the AO line for the lower timeframe instead of the EMA line if the Moving Average Line values (method, length and source) are equal to the Awesome Oscillator values in the indicator settings. For example, if the chart timeframe is 1 day, then the lower timeframe will automatically be 4 hours, if the chart timeframe is 4 hours, then the lower timeframe will be 1 hour, etc.
VBCHL indicator (Visible bars count on chart + highest/lowest bars, max/min AO)
The indicator displays the number of visible bars on the screen, including the prices of the highest and lowest bars, the maximum or minimum value of the Awesome Oscillator. The values change dynamically when scrolling or changing the scale of the chart, but with a delay of several seconds, so this feature is included in a separate indicator so as not to slow down the work of other indicators.
Indicator settings
In the AFDSA indicator I use the following settings:
By default, the Squat Bar is colored blue, and all other bars are colored to match the Awesome Oscillator color, except for the Fake bars, which are colored with a lighter AO color. But I also enable the display of "Green" Divergent bars in the "Green Bars > Show" field.
I enable the display of Alligator for higher timeframes in the "Alligator for higher timeframe > Enable" field.
In the indicator style settings, I disable the display of the highest and lowest bars, maximum and minimum AO peak labels, because these labels are also displayed by the VBCHL indicator depending on the number of visible bars in the chart window.
Only after opening a position, I enable all additional alerts in the “Enable all additional alerts” field (after changing this field, you need to re-create the alert for the current chart): crossing the green line of an open Alligator, formation of a fractal, appearance of a new maximum or minimum AO peak.
In the settings of the AOE oscillator, I enable the display of the AO line for the lower timeframe instead of the EMA line, setting the same values in the fields for the Moving Average Line (method, length and source) and Awesome Oscillator.
In the VBCHL indicator settings, I only enable the simple display text style for labels in the "Simple display text style for labels" field.
As a result, when analyzing the current chart, I immediately see all the signals on the chart, the location of the bars relative to the Alligator on the higher timeframe and changes in the Awesome Oscillator on the lower timeframe. And thanks to the VBCHL indicator, I quickly select the desired timeframe for analyzing the 5-wave Elliott impulse, focusing on the interval of 140 bars, and immediately see whether there is divergence between the maximum AO peak and the following lower AO peak in this interval.
GOLD, will CPI news confirm the downtrend?Hello everyone,
after a predicted pullback from 1980 area Gold reached it's highest point at 2088 and turned bearish again. To be honest I didn't expect the move to extend so high, but these things can happen. Finally it's likely that Gold topped out wave B at 2088 and started wave C with the main target at 1920. So far nothing new (check my latest analysis).
How will CPI news effect Gold tomorrow?
There is no clear answer to this question, as we have to observe the next move of the dollar, which started a slight counter trend. If it will break over the local resistances formed within the last days, Gold will fall further.
Important levels for Gold
Resistance area: 2040 - 2050
Support areas: 2000 - 2010 and 1970 - 1980
Elliot wave analysis
If wave C started at 2088, we probably have seen most of the first wave down, which you can see in red on the chart. I don't see an impulsive decline, so this scenario is quiet likely. The exact position for the subwave count are always hard to figure out, so please look for confirmation before you make a trade.
Trade idea
Sell 2032-2040 with TP 2010 and SL 2051
Buy 2000-2010 with TP 2030 and SL 1998

EURUSD Short term Bearish for wave 4, then one more 5th wave up?EURUSD Short term Bearish for orange wave 4, then one more 5th wave up

Imaginary wavesAgain as with the levels, first ima tell how to locate both real & imaginary waves, then I'll explain the principle itself, what are they, why it works etc, why we need em & how to use em. It's really easier this way.
Let's start with imaginary waves.
First, pls read the linked "Imaginary levels: fair price aka value", it has an explanation and another common example & about the imaginary levels.
As with imaginary levels, imaginary waves are, well, imagined xd, when there's nothing else, but a decision has to be made.
Look at the chart as if you're in 2k13 (when ASAP dropped Trap Lord) as in the previous example in the linked study, we have an overridden wave 520-1923.7, we have an imagined fair price level somewhere around 1200.
When we have an overridden wave -> we have the imaginary fair price level somewhere ~ in the middle of this wave -> that fair price level divides the real wave into 2 imaginary waves.
As with imaginary levels, imaginary waves can be used for further processing.

BTC LONG TRADE hello traders
You have placed a pending buy order for Bitcoin at the level of 18768.92. I expect the correction to end at these levels and an Bullish impulse wave will start targeting the tops.

TESLA - Time to recharge batteries? Looking at Tesla from an Elliot Wave perspective shows a very bullish uptrend since inception of the stock itself. Corrections & Bear Markets are there to beat you down and make you want to give up, and once in a while we are do for a big one. Looking at the chart I see a completion of Macro wave III which started in June of 2019. This was a huge move for Tesla gaining approx. 3,350%. Yes you heard that right, so when we see a large pull back, we shouldn't question it.
The current correction can have many complex variations in Elliot Wave Theory, so far I see an ABC down complete, a correction up for wave (X), and now working on (Y) which should be in 3 waves as another ABC that could bring the price down to $138 as a 1:1 extension of wave A from top of wave (X). If it decides to go even deeper, suppose we have a drastic recession in the world markets including U.S., then the price is allowed to go as low as $28 or a 1.618 fibonacci retracement from wave B of (Y).
In a slightly more bullish view, suppose the elections get markets to have a bear market rally and prices start going up, then we have a possibility that we are still not done with wave B of (Y) show in red colored ABC. However, I see this rally too is likely to fail if it happens; in the end gravity will win brining Tesla down somewhere in the support box (area outlined). Here, a longterm probable bottom as well as a reversal to the upside is likely.
Cheers,


DXY this weekaccording to wave analysis we can predict the future movement of DXY over all DXY is going to fall this week

HDFC BANK LONG TERM ELLIOT WAVE ANALYSISHDFC bank is one of the largest private sector and biggest bank of INDIA and WORLD'S 10 th largest according to market capitalization .
HDFC bank is among top nifty 50 index stocks and one of the largest bank in bank nifty index with 28% weightage . According to ELLIOT WAVE ANALYSIS it has completed one big cycle and moving towards third wave which is considerd biggest waves among ELLIOT 'S 5 WAVES . Price has taken support near 1250 which was earlier a strong support zone.
Weekly candle has also broken channel and looking bullish .It is the best stock to consider for long term investment .

Acala - How it startedLook at the bbands and how expanded they were during the downturn ever since launch

AUDJPY Long IdeaI'm expecting an impulsive move to the upside to complete wave 5 on the daily timeframe or at least retest the high before we start to short!
If, however, there is no push to the upside we can begin looking for shorts soon.

BTC ANALYSIS Possible scenario for the price of Bitcoin now
We may get a bearish wave that may reach the level of 19340, after that an upward wave may reach the level of 23800 and the correction will be completed and we will get a bearish wave that may reach the level of 16500

HEAD & SHOULDERS In the daily time frame, a head and shoulder pattern is formed, which according to the resistance area, we are expected to see a growth after the pullback.
The first growth to the first zone and the second growth to the second zone .

btcusdt base on elliot neowave in 15min time framedepend on last analysis if we analysis btc on 15 time frame we have an Horizontal expanded triangle and wave E starting to be complete

Ziliqua Elliot Wave Analysis key buy areaAdvanced Elliot Wave analysis as depicted on chart.
Please like and follow for more!!

Call me crazy, but this is following the same pattern…BTC $34k $34k - $35k price target then to the moon…..join the trend don’t miss out new bottom coming in hot. Ride the bull wave up to $45K. I am taking profit at $35500 then swapping to bullish position.

Bear Flag Retraced 39200 Support - confirmed downtrendAccording to how bitcoin moves, it must break through a support then retrace back to it in order to confirm the trend. Here we see bitcoin dropped past $39,200 support and has finally touched it again to close in the hourly. In this situation I am entering bearish trade position. I see a bear flag on the hourly, please comment below if you have further insight or price prediction! Nobody seems to know what’s about to happen I’m just following the trend and taking into account that MACD and RSI are not favorable right now. Short term BULLISH people will tell you to buy because they want to sell to YOU :)
Entry $39,200
Stop Loss $39500
Take Profit $29,500
bearish
* obviously bitcoin is bullish long term*

Analysis way - Buyers Vs Sellers ShiftsAnalyzing buyers vs sellers .
Very simple way of analyzing and trading supply demand in its purest form.
Identify where buyers has stepped in and showed interest in price and where is potential that they can step in again.
Identify where sellerss has stepped in and showed interest in price and where is potential that they can step in again.
Drop timeframe lower and -
1. see that for example Buyers are defending that level. and there is interest of buying.
2. identify shift of buyers vs sellers. see that the buyers have won battle against the sellers.
Price target: In uptrend price keeps breaking highs consistently. Once this stops and market keeps breaking lows trend changes. This highs and lows act as price target that If trend would continue price should hit and break higher.
Shifts: Shift where buyers won the battle against sellers and via versa.


Bitcoin Banana Wave Analysis Bullish Sentiment, low circulating supply. Selling alts to accumulate more BTC.

US30 SHORT IDEA #COMPLETED ONE WAVE.As I Mentioned in my previous idea of US30. Dow Jones Reached to the safe close level and reversed back and might fall again after getting resistance from the drawn level. It might goes till 4th wave and may reverse back and make ABC pattern of Elliot wave. after making B, I will post idea here for trade, till C point

USD/CAD - EWTUSD/CAD - Price may enter a correction soon. Waiting for confirmation to see if Wave 5 actually ended or if it will extend more.
If the price starts to retrace more, then it can touch the areas marked on the chart, otherwise, it can still continue on the upside for a short while.
The Content is for informational purposes only. You should not construe any such information or other material as legal, tax, investment, financial, or other advice.
Happy trading! :)
