SiaCoin On the move UP, Breakout of structure confirmedAs per my previous analysis here:
Breakout of structure has occurred and it seems that we may be at the start of an Elliott Wave 3 in progress. Price action has not been able to breach the lower major support area and is now bullish in trend. It also seems that a borderline FLAG pattern 'may' be forming, which may also confirm the possibility of an elliott wave 3 impulse count. TDI shows mid-band price action, from a previous sharkfin with blood in the water that may suggest a possible move downward to test the lower support region again, however due to the fact that the slant of the TDI bands is in an upward direction, this possibility is low probability in my opinion.
I shall continue to hold my previous position on the breakout as I believe this coin has huge potential in the crypto market and once 1st August time period has passed, we should see a much clearer view of the market and possible opportunities to purchase more Siacoin.
----------------------------------------------------------------------------------------------------------------------------------------------------------
DISCLAIMER: This chart is for sharing and educational purposes only and is not intended to be a signal service or similar.
This chart analysis is only provided as my own opinion, based on my own analysis and comes with absolutely no warranty that this analysis is correct, whatsoever. Do not trade this chart if you do not have your own strategy. Trade only with your own strategy at your own risk. Plan your trade and trade your plan... and IF in doubt, stay out.
.....::::: If you like this chart, please click on the THUMBS UP ! :::::.....
----------------------------------------------------------------------------------------------------------------------------------------------------------
Wave3

Possible Wave 3 on breakout of wave 2 structure?The Hydroponics Company FPO, which manufactures Medicinal Cannabis, seems to be ready to breakout of a wave 2 structure, where TDI shows the middle of the range band has just been passed, which most likely indicates additional moves downwards before a breakout of structure to begin a wave 3 impulse on the 4Hourly and Daily charts. Not enough price action exists for proper EMA analysis, however, I have chosen to use Support and Resistance to predict possible future movements and trend direction. The information that I have shows a wedge has been formed and a breakout occurred during the end of June where currently (in July) a wave 1 has possibly been completed as well as wave 2 correction.
It is in my opinion, based on technical analysis as well as fundamentals (which include Medicinal Cannabis licences being granted this month), that this stock would be good to LONG and hold either long term or exit on the top of Wave 5 structure.
----------------------------------------------------------------------------------------------------------------------------------------------------------
DISCLAIMER: This chart is for sharing and educational purposes only and is not intended to be a signal service or similar.
This chart analysis is only provided as my own opinion, based on my own analysis and comes with absolutely no warranty that this analysis is correct, whatsoever. Do not trade this chart if you do not have your own strategy. Trade only with your own strategy at your own risk. Plan your trade and trade your plan... and IF in doubt, stay out.
.....::::: If you like this chart, please click on the THUMBS UP ! :::::.....
----------------------------------------------------------------------------------------------------------------------------------------------------------

Sugar (SB1) should be close to completing wave 3 I'm looking for wave 3 to complete at 12.67, where wave v of 3 will be 61.8% the length of wave i thru wave iii subtracted from the top of wave iv. It should just be a matter of time before wave 3 completes and a corrective rally in wave 4 takes over.
As the correction in wave 2 corrected a large part of wave 1, we should expect wave 4 to only correct a minor part of wave 3. A 38.2% correction of wave 3 will see wave 4 moving up to 16.03 before turning lower again in wave 5 towards 9.98.
Regarding the corrective pattern of wave 4 it should turn into either a flat or a triangle to alternate from wave 2.

Alternate 'Short' View on EURUSD!Hi All,
I am sharing an alt view on Eur short as it also makes sense from an EW perspective - my rule when it comes to analysis is to not rule anything out until it is unvalidated so this could also be in play.
Alternative Short Count:
Wave 1: Off the break of the triangle, there has been an impulsive wave down.
Wave 2: I have this wave as a double ZZ retracing to 90% of the impulse wave 1
Forecast count: Next wave here would be wave 3 which would be be a massive decline of EUR and possible first target is 0.9745 which is 1.618% extension
My action plan is to follow this retracement happening right now and watch the nature of the movements, i.e. corrective or Impulsive decline. Below are possible move that could play out. I have already taken a short position as per my last post so watching to see which of the below plays out.
A) ZZ (5-3-5)
B) Flat (3-3-5)
C) Impulsive decline as wave 3 - This will be a brutal move to the downside if this count is in play so watching the nature of this is key
In both counts a short is in play and both counts will close the gap also... Let's see what this week brings!
Don

WHO IS READY FOR USDCAD TO FINALLY FALL?Hi All,
Interesting moves this week and based on the count, I think Looney is looking like it is about to fall and start wave 3. Please see my count update below.
Count update:
Big picture: From the screenshot below, I have been tracking the final wave 5 of wave C of an ending diagonal which has hit a key fib level where wave A = C at 100%. This is followed by a shape impulsive wave down which generally signifies a change in trend.
From the top:
Wave 1: 5 wave impulsive to the downside. I initially thought this was a potential wave C of an expanded flat but having recounted the final wave 5 up (which was an ending diagonal) I have changed my count to reflect this and have labelled 1.3795 as the top.
Wave 2: This is a clear ABC flat wave that retraced to 78.6% of the wave 1 impulse
Wave 3 (Current wave): I have marked out the possible FIB extensions for wave 3; Target 1 = 1.3526 Target 2 = 1.3376 target 3 = 1.3132
This Friday's session will be a massive indication that this count is right so let's see how it plays out
Happy Trading!

Overall Bullish Trend with great EMA and Harmonic Entry LONGIt seems we have a great opportunity to LONG this stock, as price action has progressed through structure almost reaching the Blueberry EMA, which would provide a high probability Entry LONG as well as breakout of structure going LONG.
Overall structure shows bullish trend but I'd advise caution on entry as we could see larger retracements down to the bottom channel if fundamentals show any adverse results.
It also seems there could be a high probability Bullish Bat Harmonic pattern forming, which could provide additional trading opportunities to SHORT this stock as well, through the progression through the bullish price action / trend and accompanying significant profits.
My Elliott wave count shows we are almost mid-way through a Wave 3 Cycle Period which means a LONG trade on this stock would be for several years (long term).
TDI shows shark fin (green) out of the water and blood (red) in the water, thus indicating a high probability of upwards move from the previous oversold position.
----------------------------------------------------------------------------------------------------------------------------------------------------------
DISCLAIMER: This chart is for sharing and educational purposes only and is not intended to be a signal service or similar.
This chart analysis is only provided as my own opinion, based on my own analysis and comes with absolutely no warranty that this analysis is correct, whatsoever. Do not trade this chart if you do not have your own strategy. Trade only with your own strategy at your own risk.
Plan your trade and trade your plan... and IF in doubt, stay out.
.....::::: If you like this chart, please click on the THUMBS UP ! :::::.....
----------------------------------------------------------------------------------------------------------------------------------------------------------

Possible completion of Wave 2, setup for Wave 3 LONGIt seems we may have a confirmation of the end of a Wave 2, ready to trade a Wave 3 LONG.
TDI in this instance shows almost oversold position and would correspond directly with the price action and structure.
The Mustard, Ketchup, Mayo and Blueberry EMAs have also all crossed (note Crossing of Ketchup and Blueberry EMAs) suggesting an imminent reversal to go LONG.
Entry on this stock would be on breakout of Structure as shown by the trendline breakout point (in RED).
Caution always advised.
----------------------------------------------------------------------------------------------------------------------------------------------------------
DISCLAIMER: This chart is for sharing and educational purposes only and is not intended to be a signal service or similar.
This chart analysis is only provided as my own opinion, based on my own analysis and comes with absolutely no warranty that this analysis is correct, whatsoever. Do not trade this chart if you do not have your own strategy. Trade only with your own strategy at your own risk.
Plan your trade and trade your plan... and IF in doubt, stay out.
.....::::: If you like this chart, please click on the THUMBS UP ! :::::.....
----------------------------------------------------------------------------------------------------------------------------------------------------------

Overall Bullish trend to complete a wave 3 with butterfly entryIt seems we have an overall LONG on a BULLISH trend for a Wave 3 completion.
There is also a possible Bullish Butterfly pattern available in the Hourly chart to use as an Entry point on this stock. All EMAs show Bullish trend confirmation with TDI also giving previous overbought signal confirmation on the potential Bullish Butterfly about to form.
In my opinion this stock is headed for much more bullish trend for at least another year until it reaches the upper channel trendline, where a Wave 4 correction/consolidation will form before another Impulse wave 5 will continue the upward trend. With this stock, the only way is up.
----------------------------------------------------------------------------------------------------------------------------------------------------------
DISCLAIMER: This chart is for sharing and educational purposes only and is not intended to be a signal service or similar.
This chart analysis is only provided as my own opinion, based on my own analysis and comes with absolutely no warranty that this analysis is correct, whatsoever. Do not trade this chart if you do not have your own strategy. Trade only with your own strategy at your own risk.
Plan your trade and trade your plan... and IF in doubt, stay out.
.....::::: If you like this chart, please click on the THUMBS UP ! :::::.....
----------------------------------------------------------------------------------------------------------------------------------------------------------

This Alternate count is now my preferredHi All,
I've been looking at EUR, DXY, Cable, and Swissy for a while now and my counts are all pointing to USD falling. (Please review my previous posting) - This also tells me that the looney will be falling as well.
Revised count:
Wave 1 - From the top labelled as (c), A clear 5 wave impulse down
Wave 2 - Flat correction
Wave sub 1 of 3 - from the top labelled c, another clear 5 wave impulse down
Wave sub 2 of 3 - Flat correction
Elliot wave guideline: Both corrective flat wave 2 retraced to around 90% of the previous impulse - an indicator of a flat correction termination point.
Forecast wave - We should now see the beginning of a wave 3 to the downside
Let's see what the French Elections hold as the results could push the USD down (Finally)
Happy Trading

FBR Fastbrick (ASX) Possible Wave 3 LONG?It seems that FBR (FastBrick Robotics Ltd - House Building Robotics Company) has already completed a wave 2 and is now on it's way 1/4 way through a wave 3 Impulse wave. Based on company fundamentals and performance, it seems that this not only would be great to long, but also great for investment portfolio investment stock. In my opinion, I see this company as a fast growing company that will reach significantly high price range in the months/years to come. I'm going to LONG this stock and retain it as investment stock. Great find in my opinion.
Here is the source for additional information which I've based my fundamental analysis on.
shareprices.com.au
My technical analysis is displayed in the chart above.
----------------------------------------------------------------------------------------------------------------------------------------------------------
DISCLAIMER: This chart is for sharing and educational purposes only and is not intended to be a signal service or similar.
This chart analysis is only provided as my own opinion, based on my own analysis and comes with absolutely no warranty that this analysis is correct, whatsoever. Do not trade this chart if you do not have your own strategy. Trade only with your own strategy at your own risk.
Plan your trade and trade your plan... and IF in doubt, stay out.
.....::::: If you like this chart, please click on the THUMBS UP ! :::::.....
----------------------------------------------------------------------------------------------------------------------------------------------------------

TGT Target 100% confirmation of Wave 3 Impulse going SHORT !It seems we have a 100% confirmation of TGT (Target) going SHORT on a wave 3 on Intermediate, Minor and Minute Periods. MACD, RSI and Stochastic all show oversold positions and we shall see on next open of market, how far down the price action gap will take us before we see an upwards move on a correction because continuation of downwards Impulse move. SMA also indicates bearish trend continuation.
This is a Very Dangerous sign for Target as this impulse is on an Intermediate period, which means if it continues this way, the stock is headed downwards very fast. A great SHORT opportunity here is at the breakout of a Fibonacci move, for some significant profit. I shall now await for a corrective structure to form within the Wave 3 move, to then take a short on this, all the way to the bottom of wave 5.
----------------------------------------------------------------------------------------------------------------------------------------------------------
DISCLAIMER: This chart is for sharing and educational purposes only and is not intended to be a signal service or similar.
This chart analysis is only provided as my own opinion, based on my own analysis and comes with absolutely no warranty that this analysis is correct, whatsoever. Do not trade this chart if you do not have your own strategy. Trade only with your own strategy at your own risk.
Plan your trade and trade your plan... and IF in doubt, stay out.
.....::::: If you like this chart, please click on the THUMBS UP ! :::::.....
----------------------------------------------------------------------------------------------------------------------------------------------------------

May have finished wave 2. Now wave 3 dropsYou can see 5 waves within wave 1 and abc correction within wave 2 very clearly. If wave 3 is next, this will be a big drop. Keep in mind, Wave C within wave 2 could have more bullish room to go.

AUDNZD wave 3 on the GOAUDNZD is started a new impulse wave 3. Target wave 3 will be complete at 1.0860 area

GBPJPY looking for a buying breakoutWe are looking for a breakout buying opportunity for wave 3 around 160.00

GBPJPY wave analysisHello guys,
What do you think about this wave analysis? It seems we are on the beginning of the 3rd wave hear (the biggest move according to Elliot). ABC retracement is completed between 0.382 and 0.5 fib retracement levels. We can see the pair gaining more volume on 0.5 fib level with the huge bullish candlestick. Even though I am already long on this trade (see my related idea GBPJPY showing a bullish retracement ), I just feel as sharing this Wave analysis. SL is set few pips below 0.5 fib level.


New idea for GOLDFrom the previous analysis(link below). I think gold is going down and yes it went down from the 1338 to 1315
But, I think I was wrong. Maybe, wave (iii) has not revealed itself yet.
I will use this new wave count for the next week.
This set up will invalid if price below 1300.

RCOM - Wave 3 in Progress After Completing ABC Flat PatternThere is an opportunity to invest as the price action is moving up to Wave 3 after confirming and completing a regular flat corrective structure. Now we shall short corrections and high jumps in price movements.
Target 1: 56
Stop: 49

EURUSD short. Awaiting breakout to sellPullbacks and short-term corrections marked on the chart in blue are for illustration purpose only. They hold no significance in terms of price or time. Read EURUSD weekly outlook 15th – 19th August 2016 for complete details.

Nifty : Just an analysis... Now there will be 1000 reasons and theories why Nifty dropped down from 8720's.To check n validate whether those are right or wrong is not our job and that's not worth our time. Let those reasoning's be right, it cant make any real money, but if you have traded in right direction with your trade plan( Be it fundamental or technical) ,if you made money you are far better than those empty theories.Don't we know from start of august itself, Nifty is gonna be weak with GST passing (Sell on News ) ? Enough of past discussions, lets get back to field work !
Nifty took out the support zone of 8580's, though we don't have any valid support on hourly till it reaches trendline
which is also Fib extension 2.0 if you draw fibs on Wave 1 and we do have fib extension 1.618 in the 8580's support zone, so easily that can pass as Wave 3. Well, I don't wanna predict where exactly Nifty ends its wave 3. So what we are looking for ??
Scenario 1 : if the Blue trendline support is broken enter short ( I really expect Nifty won't break it just like that, so we will get pullback to 8570's zone before breaking the supportline - that's the pullback area we are waiting to enter shorts. Use very strict stops if this happens.
Scenario 2 : Can touch supportline and bounce back breaking upwards above redline, Enter longs in Nifty only after our 8570's zone is crossed. This will be safe entry according to Me, to initiate long positions.
Scenario 3 : If Nifty ends wave 3 around 8570's n bounces up, I won't be taking any positions bcos I'm unsure about the move till red upper trendline is taken out.
Final Scene : Well, who knows ? That's Nifty's Style,Boss !
Thanks for your Likes..Happy Trading !


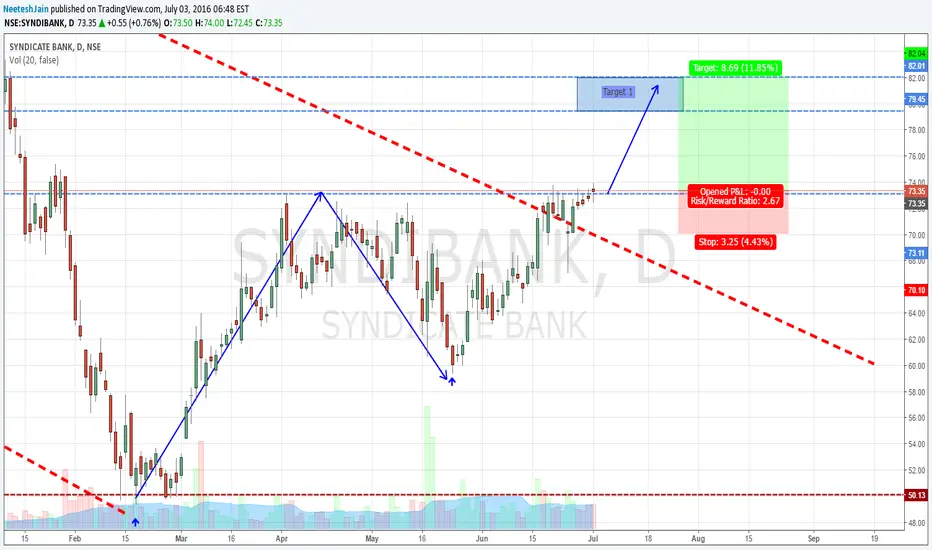
Syndicate Bank - At Start of Wave 3 (Its Time to Get In)As per analysis, it seems that there will be a breakout to the wave 3 as previously the charts shown a higher low. If it breaks through the level of 74, then we might see a big rally moving up to the levels of 80-100.
It is a good time to get in with minimum risk.
BTC / USD in Potential Wave [3] - Updated ChartA quick update to my wave count posted about two months ago. I modified the timeline of the labels - price targets remain the same. The sideways movement lasted longer than I had anticipated. Price stability in the low 400s area created a nice base for the recent rise in price.
Review the old post on cryptowaves.com for detailed commentary. Note that I changed the labels slightly in the updated chart I posted today because I had a mistake in the labeling of the wave degrees in the post from February.
cryptowaves.com
