BTS bounce. the waves labeled is a chart for reference, using the initial high of last years June price as greater Wave 1, the correction that ensued thus far as wave 2, and where we are is the beginning of wave 3 of 3.
not sure of time table, but the price projection is using a minimum of 1.1618 times the length of wave 1 to calculate the minimum price movement we could expect for wave 3.
and then using the height of wave 1, to be in a 1:1 correlation of wave 5.
gooooo bitshares
Wave3

BTC - It's the Final Countdown.Folks, I came to the realization last night and this morning of two things. Firstly we have formed the predicted head and shoulders and we now have a 1000 point potential drop from the neck line which is around 9k ... so 8k for this next wave. Second is, the waves from 9.99k down to 8.98k and the back up to 9.4k just confused me. I don't want to bore you with detail, but we though a 5 impulse wave followed by an ABC. Weird. Well, it became clear this morning, I was looking at far to small of a time frame. It became clear to me that the impulse down is likely far from over, and we are forming wave 3 now.
The question is where does it stop. If we assume that this down wave is an ABC, BTC could stop soon (anywhere from here - which I doubt - down to around 7750 level, likely 8k to 8.2k). That is the blue wave theory ... which assumes BTC is actually in a grand impulse up and it will start forming wave 3 after this wave down completes.
However, if this is an impulse down, purple wave 3 completes, BTC bounces up a bit and then we fall again to form wave 5 ... that's the grand wave shown in red ... taking us down to the 6.8/6.9k mark, and completing WAVE E of a triangle wave. As you know, wave E is difficult to predict, and can over-extend.
So, it will be interesting to see the action of this current wave, and in particular what happens next. The two directions are clearly opposing, one saying we could go up to 11.7k to test that peak, the other saying BTC could go to 6.8k or lower.
Remember, only a fool relies on one potential outcome.
Do not make financial decisions on this information. For educational purposes only.

Bigger wave 3 and smaller wave 2 correctionI completed wave 2 and on its wave 3. It is also in the correction of wave 2 of wave 3. Let's see if we can see 11000 soon. If you want to learn more, Subscribe to me on YouTube. I am about to start putting tutorial videos on there. www.youtube.com

XVGUSD wave 3 of 3 to begin?seeing a larger degree wave 3 to begin.
higher highs, very bullish on XVGUSD and XVGBTC
if this timetable is valid and begins to move in this direction with the price of BTC at a relatively 'stable' price of ~10k we can extrapolate a Satoshi value of ~1250 satoshi as the next target before a pull back and subsequent LEAP to higher highs (relative) and then ultimately new all time highs.
what is everyone else seeing?
comment Bull or Bear - trying to determine that im not looking at this with bias bullish goggles on
kinda like beer goggles :) but for crypto

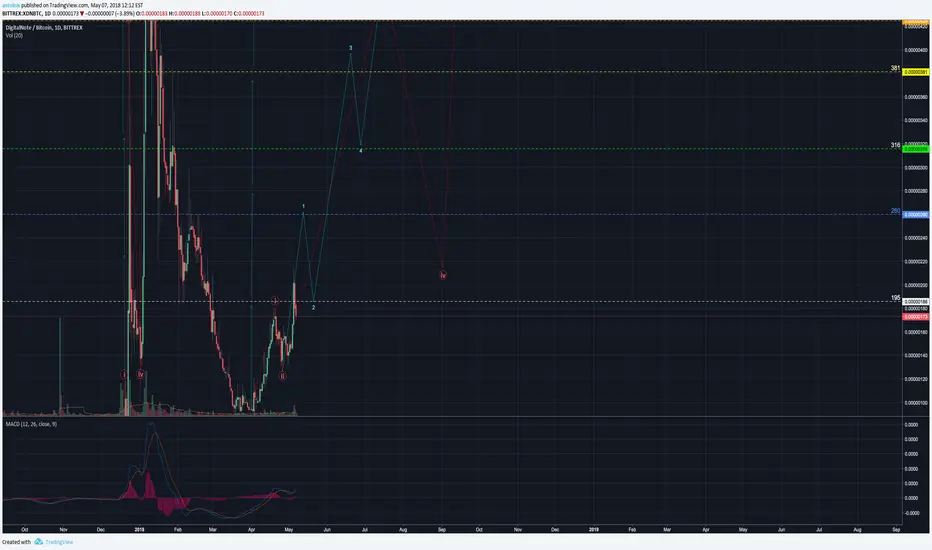
XDN chart updatenotes for reference
very bullish pattern formation - hodl the next 6 months and expect huge gains - take profits at terminal end of wave 3. sharp fall
My Take On Chicago Bridge Elliott Wave MovementsEverything looks upward moving for CBI. Although a test came for dropping below the bottom at 12.10 on April 23, the bleeding stopped at 12.12. I believe the stock is currently in:
Grand Supercycle: 1
Supercycle: 5
Cycle: 1
Primary: 3
Intermediate: 1
Minor: 3
Minute: 3
This chart displays my projected path through end of August 2018.
The chart below is the projected movement through May 7.
The chart below is the projected movement thorugh May 21.
I will continue to monitor this movement as I am long with exit plans around August-September 2018. My ultimate target is 31.00 by September. Also expect 24.00 before end of July.

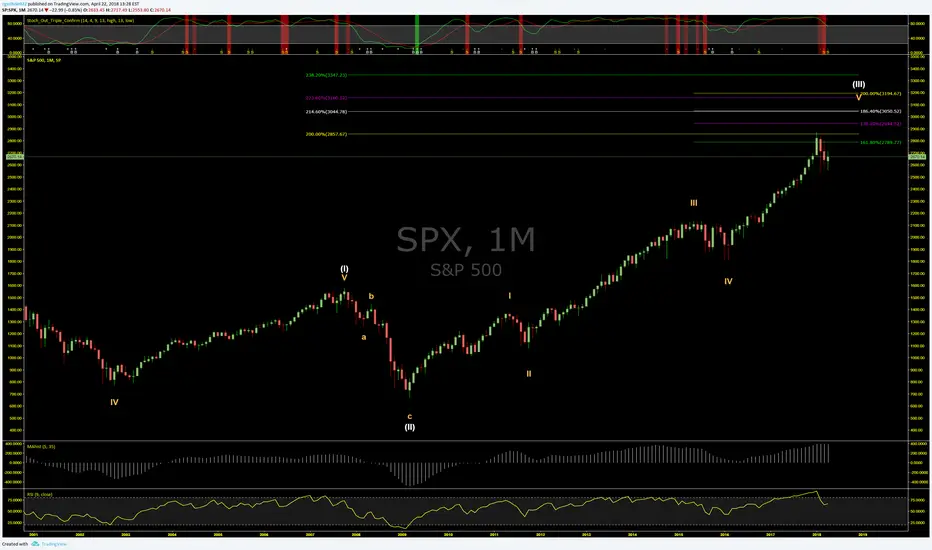
My Elliott Wave Analysis Found Next Major Market TopBased on my analysis of the Elliott wave that began around 1993, we are coming to the top of the third SuperCycle wave. SyperCycle Wave 1 ended with the market top in 2007 prior to the popping of the housing bubble. SyperCycle Wave 2 ended at the bottom in 2009 and we have been in SyperCycle Wave 3 ever since.
I project the market top to occur between November 1 and December 31 this year (2018). The good news is my projected level is 18% higher than where we are now. My market top for the S & P 500 is between 3160.12 and 3194.67. Based on this timeframe, I wonder if the real world catalyst rekates to the North Korean peninsula matters, surprise in 2018 mid-term elections or some other event.
I encourage other Wave Analysts to share your thoughts.


Breaking Down CBI Wave 3Currently CBI has just begun the important wave 3. Based on the statistics observed during the current overall Grand Supercycle Wave (white roman numerals), our current wave 3 will most likely end around 31.41 around the end of August 2018.
This will provide massive gains if buying stock and even larger ones with call options.
The solid yellow lines represent the average levels observed throughout the Grand Supercycle. The average Fibonacci Extension from Wave 1 is 105.78% which is move to at least 22.66. The average days observed for a wave 3 coincides with the end of August 2018. The median Extension is 177%, and 176.4% is a Fibonacci number so this area is why I believe the movement should go at least here by the end of August.
I have arrived at the solid red lines when the standard deviation is applied (added) to the average of the days elapsed and Fibonacci Extension percentages.

good price and time to Buy as you see i think the big retrasment of ripple is finished and it could be a good price for Long and buyer's .

BTC Giant Inverse Head and Shoulders Completes Today?Good morning campers. I'm your Uncle Ernie and I welcome you to Tommys Holiday Camp.
(The camping with a difference!)
Okay, so... we could complete this huge inverse H&S today if it can just bust thru that 0.382 fib,
and that yellow neck line. But it needs to bust thru decisively, eh?
If it can do that and not look back... we may get that acceleration of Wave 3...
at least the subwave 3 portion of the larger WAVE 3 that is ideally in progress.
What do you think?
Wakey Wakey -- Eggs and Bakey!

Cardano ready for wave 3?I believe we are at the end of Wave 2, and thus the start of wave 3 with a target of 11000 sats.
RSI is bullish, and the daily MACD is ready to cross. So let's hope for the best :-)

euraud is in a good price for LONGeuraud is in a good price for LONG. i am wating for a good trigger point .


ConocoPhillips still on track to drop by end of FebruaryMy Cycle wave 3 top appears to have been originally off by 7 trading days. This does not appear to impact the pending drop. The estimated upcoming bottom for COP is around 56.20 on March 5, 2018.

update to BTSnice movement last night, check previous post for more in depth analysis.
time to accumulate more before this goes UP

BTS USD pair bullish future. #bitshareslong term projection.
only price has been projected, not time. But i think this time frame is fair.
wave 3 to begin

Intel Set To Lead Intermediate Bears DownAlthough, harder to identify at first, Intel Corporation is in the process of Grand Supercycle Wave 3. The stock has most likely met a near-term top or will do so no later than tomorrow, January 23. Our short-term target is 40.50 by the end of February. Our Intermediate target is 30.00 by June of 2019. Once the stock reverses up from this 30 mark, the stock should fly high for a while. Finally, the long-term target is 78.00 well out in to the future (2022-2024). As always, the rest of the stats will be up shortly on our site.

Tron Finished Corrections?TRX finished a 5 wave impulse and is correctly experiencing corrections. A WXYXZ correction has been completed and TRX could soon start impulsing. The 5 wave impulse could be the subwaves of intermediate wave 1. That means the biggest wave (wave 3) has yet to come. I used the fibonacci extensions at 1.618, 1.272, and 1 to set the targets.

Status Coin About to Gain Some StatusSNT just completed some major corrections and has already started impulsing up, starting primary wave 3 (pink). SNT have just started the first leg of intermediate wave 1(dark blue) and is currently on minor wave 3 (black). By using a 1.618 Fibonacci Extension of minor wave 1 for wave 3 and a 1 to 1 Extension for wave 4, we get a first target of $0.62 This is just the beginning for this coin as we are not even done the first intermediate wave yet! This coin would be one of my top picks for holding and forgetting.

XVG about to EXPLODEXVG is forming a symmetrical triangle, which usually is a powerful continuation signal. The symmetrical triangle also happens to be the corrective wave of wave 1 in the form of a ABCDE pattern, and its completion signals that wave 3 will start soon. Since wave 3 is usually the longest, XVG probably will hit at least $0.39 (1 to 1 Extension). However, because the crypto market is so bullish, XVG will most likely exceed that target, possibly reaching $0.65 (1.618 Fibonacci Extension) or more.
In addition, within the symmetrical triangle, there are three falling wedges. The first two wedges led to a noticeable spike in price but failed to bring a decisive breakout. But as the saying goes, "Third time is the charm," the third wedge (the one XVG is currently forming), will likely bring an all time high. Market trends tend to come in sets of three (sometimes two). For instance, the impulse waves have 3 motive waves (waves that drive the price up) before a correction. Also, the triple combo corrections and the WXYZ corrections have 3 corrective sub-waves before starting another impulse. Once three of whatever pattern happens, the price is likely to change. XVG's three corrective wedges could signal the end of the corrections.

Neo; Short Term CorrectionNeo just completed five sub-waves, and after 5 waves, a correction occurs. The correction usually is between the 0.382 and the 0.618 Fibonacci retracement.
We can open a short position with a tight stop just above the peak and a target at the 0.382 Fib retracement level, which gives us over 1:5 risk to reward ratio. That means, we only have to be right about 1/6 of the time to make this trade profitable.
If we zoom out and look at the bigger picture, we see that Neo is only on intermediate wave 3. It has one more wave to go, and it will likely bring us another all time high. We set our buyback zone according to the Fibonacci retracement levels of 0.382 and 0.618.
