Potential Reversal Ahead: Elliott Wave AnalysisHello friends,
Welcome to RK_Chaarts,
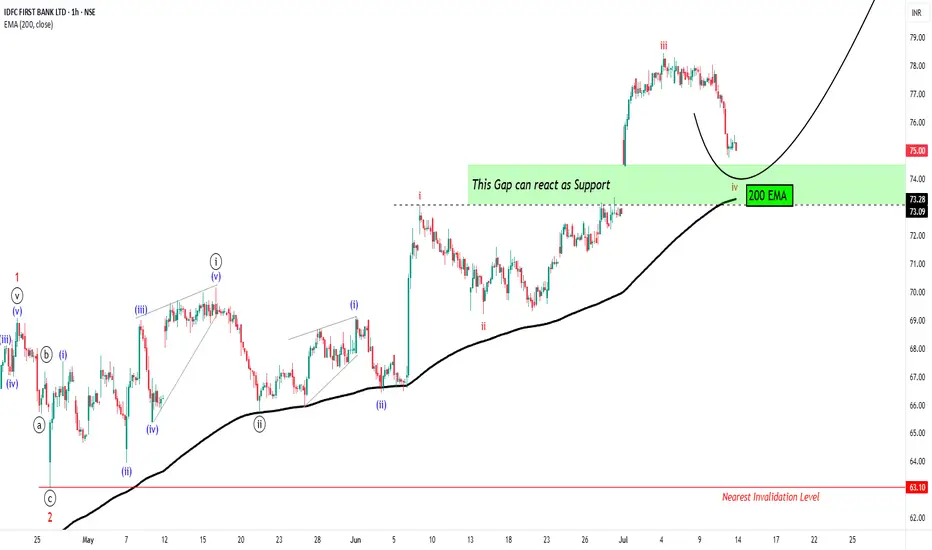
Today we're going to analyze chart of stock named IDFC First Bank, based on Elliott wave theory.
Today, we're analyzing the chart of IDFC First Bank using Elliott Wave theory. On the chart, we've marked the Elliott Waves, indicating that:
- Red wave 1 and 2 (Minor degree) have ended
- Price is unfolding into red wave 3 (Minor degree)
- Black wave ((i)) and ((ii)) (Minute degree) have completed
- Black wave ((iii)) (Minute degree) is ongoing
- Blue wave (i) and (ii) (Minuette degree) have finished
- Blue wave (iii) (Minuette degree) is in progress
- Red wave i, ii, and iii (Subminuette degree) have completed
- Possibly in the correction phase of red wave iv (Subminuette degree)
We observe that the price gapped up, retraced to correct wave iv, and is now supported by the gap zone. Along with 200Exponential Moving Average is also at Gap level which can also provide a good Support to same view.
Our estimate suggests a high probability of a price reversal. However, market uncertainties exist.
Potential price targets: 81, 93, and 100+
Nearest invalidation level: 73.09 (wave iv should not overlap wave i)
Please note that this analysis is for educational purposes only. I'm not a SEBI-registered analyst, and you should consult your financial advisor before trading or investing.
Let's see how the market unfolds. This entire study is shared solely for educational purposes. Thank you so much.
I am not Sebi registered analyst.
My studies are for educational purpose only.
Please Consult your financial advisor before trading or investing.
I am not responsible for any kinds of your profits and your losses.
Most investors treat trading as a hobby because they have a full-time job doing something else.
However, If you treat trading like a business, it will pay you like a business.
If you treat like a hobby, hobbies don't pay, they cost you...!
Hope this post is helpful to community
Thanks
RK💕
Disclaimer and Risk Warning.
The analysis and discussion provided on in.tradingview.com is intended for educational purposes only and should not be relied upon for trading decisions. RK_Chaarts is not an investment adviser and the information provided here should not be taken as professional investment advice. Before buying or selling any investments, securities, or precious metals, it is recommended that you conduct your own due diligence. RK_Chaarts does not share in your profits and will not take responsibility for any losses you may incur. So Please Consult your financial advisor before trading or investing.
Wave5
Bitcoin could reach as high as $250,000.I think Bitcoin could reach as high as $250,000 per coin in wave 5, as crypto often experiences extended fifth waves—similar to what we see in commodity markets like gold and silver. It’s possible for it to go even higher than this, but I believe $250,000 is a very realistic target.
As always, stay profitable.
– Dalin Anderson

#btc #elliottwave long buy setup wave 5 30Mar25This count is based on my assumptions so anything can happen not a trading or financial advice just for educational purposes only kindly do your own ta thanks trade with care good luck.

#btc #btcusd #elliottwave long buy setup wave 5 22Jan25This count is based on my assumptions so anything can happen not a trading or financial advice just for educational purposes only kindly do your own ta thanks trade with care good luck.

#usdjpy #elliottwave long buy setup wave 5 17Jan25This count is based on my assumptions so anything can happen not a trading or financial advice just for educational purposes only kindly do your own ta thanks trade with care good luck.

#btc #btcusd #elliottwave long buy setup wave 5 14Jan25This count is based on my assumptions so anything can happen not a trading or financial advice just for educational purposes only kindly do your own ta thanks trade with care good luck.

Bank Of IndiaSharing my view on Bank of india based on elliott wave theory, where price seems to complete correction phase, but here is the tricky part if price breaks, price will move up.but, if it breaks 137 price level then and then only we can consider the start of wave 5, untill then it will correction uptrend and price can remain sideways.

#btc #btcusd #elliottwave long buy setup wave 5 9Jan25This count is based on my assumptions so anything can happen not a trading or financial advice just for educational purposes only kindly do your own ta thanks trade with care good luck.

#xauusd #elliottwave long buy setup wave 5 9Jan25This count is based on my assumptions so anything can happen not a trading or financial advice just for educational purposes only kindly do your own ta thanks trade with care good luck.

new wave 5 targets on ada since deep wave 4 correction
in above mentioned idea i outlined most passive targets on ada. Today there was a impulsive weekly Candle that take off ada to 10% 24h pump as only coin in top 10 .
Just for the bigger Picture that means ADAs marketcap pumped from 40 to 44billion dollars in1-2 days 4 billion on top thats massive. As iam in that market since 2017 i learned if ada pumps that hard out of nothing, that is a superb sign of outperforming next days.
New Target
1,47 minimum up to 1,70$ in a normal wavecount scenario
INFO:
if alt season starts my targets probable are nonsense because ada will rise much higher
If BTC dumps then all alts including ada will dump to. Then the Chart needs a new point of view and analysing.

#xauusd #elliottwave long buy setup wave 5 13Dec24This count is based on my assumptions so anything can happen not a trading or financial advice just for educational purposes only kindly do your own ta thanks trade with care good luck.

#xauusd #elliottwave long buy setup wave 3 of 5 12Dec24This count is based on my assumptions so anything can happen not a trading or financial advice just for educational purposes only kindly do your own ta thanks trade with care good luck.

DXY Formed Wave Pattern!Looking for Impulse Up.
DXY formed 1,2,3,4,5 & a now wait for wave b to get in with wave c. It's important to have your own rules on RR and adhere to them. This trading idea is intended to assist you and enhance your knowledge. If you have any questions, please ask me in the comments.
Learn & Earn!
Wave Trader Pro

#xauusd #elliottwave long buy setup wave 5 11Dec24This count is based on my assumptions so anything can happen not a trading or financial advice just for educational purposes only kindly do your own ta thanks trade with care good luck.

#btc #btcusd #elliottwave long buy setup wave 3 of 5 of 1 8Dec24This count is based on my assumptions so anything can happen not a trading or financial advice just for educational purposes only kindly do your own ta thanks trade with care good luck.

#xauusd #elliottwave long buy setup wave 5 5Dec24This count is based on my assumptions so anything can happen not a trading or financial advice just for educational purposes only kindly do your own ta thanks trade with care good luck.

ACHR: Long Position @ Wave 5 (Elliot)Step 1: Ride the Wave 5 Momentum
ACHR is about to start its Wave 5 rally, offering an excellent short-term long opportunity.
Currently we're in the middle of Wave 4 and we will likely experience 3 to 5 days of accumulation/indecision before Wave 5 starts.
Let’s break it down:
Slow Stochastic Bullish Momentum
The Slow Stoch oscillator is signaling strong bullish momentum, albeit in overbought territory. This is typical during Wave 5 and suggests further upside potential before the trend exhausts. Staying with the momentum while it lasts can be very rewarding.
Massive Volume Spike
In the last three weeks, ACHR has seen a significant increase in volume, indicating strong buying interest. Volume often leads price, and this kind of activity strengthens the case for continued upward movement. The surge in interest can drive the stock toward its next key resistance around $9.84.
Fundamental Catalysts Driving Momentum
Recently, ACHR has achieved major milestones, such as progress on FDA approvals and securing new contracts and orders. These developments add to the bullish sentiment, attracting more traders and creating a supportive backdrop for the rally.
Trade Execution: Enter a long position now to take advantage of the current momentum and aim for a target near $9.84 (the resistance zone). Consider tightening your stop-loss to protect profits as the stock approaches this level.
Step 2: Exit, Wait for the ABC Correction, and Re-Enter for a Bigger Move
After completing Wave 5, the market is likely to enter a corrective ABC phase. This is where it’s smart to exit your position and wait on the sidelines. Why? The correction will likely bring the price down to a more attractive level, allowing for a better risk-reward setup for the next big move.
Once the ABC correction concludes, re-entering around the key support zone sets up a new long opportunity with an eye toward the Q1 2025 target of $12. The long-term fundamentals of ACHR and its growing momentum in the market make this a high-probability setup.
Trade Execution: Watch for the corrective phase after Wave 5 completes. Use Fibonacci retracement levels or support zones to identify a potential re-entry point.

#xauusd #elliottwave long buy setup wave 5 3Dec24This count is based on my assumptions so anything can happen not a trading or financial advice just for educational purposes only kindly do your own ta thanks trade with care good luck.

#btc #btcusd #elliottwave long buy setup wave 5 30Nov24This count is based on my assumptions so anything can happen not a trading or financial advice just for educational purposes only kindly do your own ta thanks trade with care good luck.

#dxy #elliottwave long buy setup wave 5/c/b 29Nov24This count is based on my assumptions so anything can happen not a trading or financial advice just for educational purposes only kindly do your own ta thanks trade with care good luck.

#btc #btcusd #elliottwave long buy setup wave 5 28Nov24This count is based on my assumptions so anything can happen not a trading or financial advice just for educational purposes only kindly do your own ta thanks trade with care good luck.

#xauusd #elliottwave #gold long buy setup wave 5 28Nov24This count is based on my assumptions so anything can happen not a trading or financial advice just for educational purposes only kindly do your own ta thanks trade with care good luck.

#xauusd #elliottwave long buy setup wave 5 15m 22Nov24This count is based on my assumptions so anything can happen not a trading or financial advice just for educational purposes only kindly do your own ta thanks trade with care good luck.
