Volume Spread Analysis - Understanding Traps & ConfirmationDespite the fact that the so-called “Big Players” in the game of ups and downs we call the market have the power to manipulate it in ways some cannot even imagine, what they ultimately seek is a healthy market. I’ve mentioned in previous posts that the market behaves like a living organism — and like any organism, it must be healthy in order to grow.
In simple terms, the traps institutional players set are there because they need cash flow — liquidity — to achieve that growth. But why do they need to use traps at all? The answer lies in the numbers: one institutional player is equivalent to hundreds, if not thousands, of uninformed or poorly trained retail traders. So, to sustain growth, they are not just inclined but sometimes forced to create traps.
Now imagine this: in a market with enormous capital, one big player is equivalent to 100 retail traders. If 25% of those traders were skilled — truly good at the game — think of how much more cash flow would occur, and how much healthier and more stable that growth could be.
But don’t be fooled — while big players may benefit from a small portion of skilled retail participants, it’s not their actual goal. Still, it wouldn't hurt them either, as long as liquidity and volatility are preserved. In fact, a higher percentage of skilled players could deepen liquidity and reduce the need for extreme manipulation.
However, if too many retail traders become skilled, the game tightens. Profit margins shrink. The edge that institutions hold becomes harder to maintain. And in such a scenario, consistent profitability becomes more difficult — for everyone.
As I’ve emphasized in previous ideas, there is a way to understand institutional traps — and one of the keys is learning how to interpret the Relative Strength Index (RSI) properly. However, since RSI is by nature an oscillator, its signals require confirmation. And what better tool to use for confirmation than Volume — specifically through the lens of Volume Spread Analysis (VSA)?
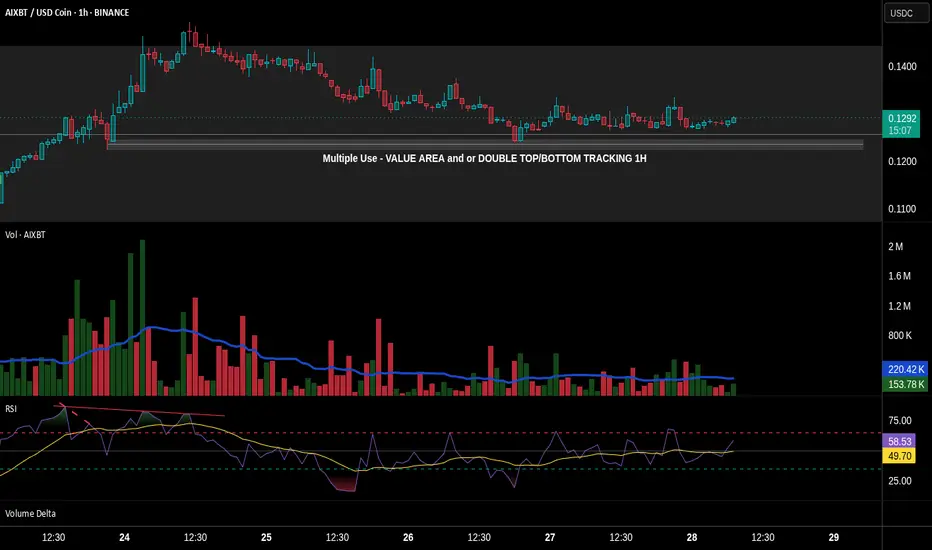
In this post, we’ll partially explore how these traps are revealed, using basic tools available on TradingView. We'll also uncover a potential trap in the chart of AIXBT/USD Coin from Binance, using the 1-hour time-frame.
🔹 1. Pre-Top Volume Cluster
Let’s begin at the very top of the chart. Just before this top, we can spot a bullish volume cluster — four consecutive volume spikes with rising price. In VSA, such a cluster often suggests that the current trend is reaching exhaustion.
⚠️ Important Note: Not all clusters mark a reversal. Even if we see one or two bearish candlesticks after-ward — even if they are engulfing — that alone does not confirm the reversal. The real signs are already present in the volume indicator.
As I’ve said in the past, in previously posted ideas: Big Players always leave footprints. Learning to read those footprints is the language every serious retail trader must eventually understand. And one of the clearest footprints is what we’ll discuss next.
🔻 2. The Buying Climax
A Buying Climax is a tell-tale sign of professional distribution — it appears (in our case) as a large bullish volume spike accompanied by a bearish candlestick, signaling the potential end of a rally.
In our AIXBT/USD Coin chart, we observe two buying climaxes:
• The first comes at the end of the bullish volume cluster, followed by a bearish candle.
• The second follows right after, repeating the same bearish confirmation.
🧠 Even though price was making a new Higher High — these repeated climaxes on increasing volume suggest supply is entering the market, and the uptrend is likely unsustainable.
✅ Conclusion
This is just one piece of the larger puzzle, but even basic tools like RSI and Volume, when read in the context of structure and intent, can reveal traps set by institutional hands. The more we train ourselves to see these signs, the closer we get to trading in harmony with the market’s true rhythm — not against it.
Now let’s take a look at another signal that hints at a possible reversal. But before we continue, keep in mind: what I’m about to describe doesn’t always play out in the simplified way I’ll mention here. The market behaves differently at any given moment — so this kind of analysis always requires a careful and adaptive approach.
This time, I’m referring to a smaller bearish cluster, made up of three volume spikes, each of them clearly above the 20-period Moving Average — and appearing just before the bullish cluster I highlighted earlier.
• The fact that the first spike in this bearish group breaks above the MA is a strong signal that bearish pressure is stepping in.
• The fact that all three spikes remain above the MA adds weight to that signal.
However — and this is crucial — just like I mentioned before, this alone doesn't confirm a reversal. It still requires confirmation.
Even though this smaller bearish cluster forms a new low, and even though it aligns with a bearish RSI divergence marked with a dashed trend line, it’s not a signal to enter a trade. Why? Because volume confirmation is missing. And that's exactly why RSI alone isn't enough. It can point to weakness — but not confirm the turn.
True confirmation only comes with the next bullish volume spike, which:
• a) breaks above the MA,
• b) is higher than the first bearish spike in the previous cluster,
• c) appears with an engulfing candlestick, and
• d) is supported by an RSI plot that follows the move.
This collective behavior — the interaction between price, volume, and momentum — is not random. It’s one of the many harmonies that exist in the market’s structure. And learning to recognize these harmonies is key to understanding when the market is genuine — and when it's trying to trap you.
🔚 Conclusion
All of this leads me to one conclusion — based not just on theory, but on direct experience.
We’ve all seen the countless videos across platforms where retail traders explain things like RSI divergences as if they’re guaranteed signals. But the truth is: not all of these videos are made by successful traders — and blindly following them can be dangerous.
Early in my trading journey, I made that exact mistake. I followed those “educational” videos without question, and nearly blew my account in the process.
Can you imagine what would happen if someone entered a trade solely based on the divergence we discussed — without waiting for confirmation?
If you’ve followed this chart example to its end, you already know the answer.
Worse, this kind of psychological frustration often leads to even bigger mistakes — especially if you haven’t applied one of the simplest protective tools: the Stop Loss. And sadly, many traders skip it.
So let this be a reminder:
A divergence is not a signal. Confirmation is everything.
Let’s now take things a step deeper — by partially revealing something that remains known only to a small circle of elite traders.
Something that’s rarely discussed in public — yet sits hidden in plain sight.
Many traders know that Volume Spread Analysis (VSA) is based on the teachings of Richard Wyckoff and expanded through Tom Williams in Master the Markets. And yes — the most of VSA’s power comes from those principles.
But that’s only part of the story. What did these two big names revealing in secret code using multiple paragraphs and terminologies, but purposely do not reveal it in simple words in a few lines. And they are doing the right thing. Because if I said to myself that if everyone knew that then the market might crashed, then for sure they had that thought as well
What truly sets VSA apart, and what gives it its real power, is that it operates in two distinct languages.
🧩 The Hidden Language of VSA — What Most Don’t See
Let’s now go a step deeper — by partially revealing something known only to a few traders who’ve spent enough time observing the market beyond surface-level signals.
Something that’s often overlooked, yet has always been in plain sight.
We all know that VSA stands for Volume Spread Analysis.
And we commonly refer to “spread” as the distance between the open and the close of a candlestick. This is what many traders fixate on — the relationship between price movement and volume.
But that’s only part of the story.
What did names like Wyckoff and Tom Williams really reveal?
They spoke in code — long paragraphs, obscure terminology, layered ideas — never quite saying "this is the hidden key" in a few plain words.
And they were right to do so.
Because I’ve thought the same thing myself:
If everyone knew this… if it was simplified and passed around like a hack… the market could collapse into chaos.
If I’ve had that thought, I’m certain they did too.
So instead, they left trails. Patterns. Puzzles.
They left the second language in the open — but made sure only those with patience, discipline, and time in the charts would ever truly hear it.
There are things the open and close can’t tell you, but...
That… is part of what I meant earlier when I said VSA speaks in two languages.
Some of you already sense what I’m pointing toward.
For the rest — keep watching.
You’ll know it when you see it.
And once you do, you’ll never unsee it again.
Let’s begin with what most traders already know.
We say "spread" in VSA to refer to the range between the open and the close of a candlestick. This spread, in relation to volume, tells us whether a candle shows strength or weakness.
• A wide spread on high volume may signal professional activity.
• A narrow spread on high volume could suggest absorption or hidden effort.
This is the first language — the most commonly taught, and the most widely shared.
But what about the second?
Here's where things get interesting.
Let’s revisit our AIXBT/USD Coin chart, and specifically the large engulfing candlestick that forms around 18:30, just after the very top.
Now ask yourself:
• 🔍 Where did this candle open?
• 📍 What previous zone did it revisit or retest? What’s the story behind on that retest?
• Have you noticed the macro scale Hidden bearish divergence between RSI & PA?
What you're seeing is not just a rejection.
It’s a trigger zone — a price level left behind earlier by institutional activity.
This candle, with its precise open, combined with the volume behavior, is no coincidence. It's not just a rejection — it's a setup, part of a pre-engineered trap. By stealing what Tom Williams said: Big players are simply saying to uninformed traders – “thank you for your money”.
The interaction of price levels over time, the zones formed by previous activity, and how volume behavior aligns with those zones to signal intent.
Most traders never see this and even fewer can interpret it.
Why This Matters
That engulfing candlestick is not just a visual cue — it's a multiple level footprint.
It confirms everything we discussed earlier about how the market is manipulated — often in ways most traders can’t even begin to imagine. Two opposite forces within a zone. One prevails while the other reveals a future!
So now, let this sink in:
To truly master VSA, one must learn to read both languages.
The visible structure, and the hidden context.
One without the other is incomplete.
Now you know why Confirmation is so crucial.
That’s all for now. I hope that all the above paragraphs were able to give you a hint of how things work! And remember: Everything I write is just a small glimpse of the whole that needs to be considered.
Until next time — stay safe, trade wisely, and never stop learning.
Waveanalyis
GBPUSD [Possible longsHere' how I'm watching GBPUSD for a potential buy trade. I reckon the buy would hold, although I'd be risking 0.5% of my equity because we didn't see the market take out previous high with deliberate candle closes, and that could mean that there are sellers lurking somewhere around.
However, until the sell is confirmed, the trend is our friend.
DYOR

Elliott Wave | Bearish End Confirmed? | Last Chance Before the DBINANCE:SOLUSDT
The current structure suggests we are approaching a key decision point. Price has completed an a-b-b correction and is now reacting within the 61.8%-88.7% Fibonacci retracement zone, which could trigger a relief bounce before further decline.
📉 **Bearish Outlook:**
- The recent structure confirms a completed a-b-c move, leading to a potential Wave (B) retracement.
- The final bearish target lies in the "End of Bear" zone (~109 USD), where a final capitulation may occur.
- If we break far below **109 USD**, expect an accelerated sell-off.
📈 **Bullish Scenario?**
- The 78.6%-88.7% Fibonacci retracement zone could push SOL towards a short-term bounce before resuming the bearish trend.
- A valid long trade is possible if this support holds.
⚠️ Key Levels to Watch:
✅ Bullish Rejection Zone: 78.6% - 88.7% Fibo
❌ Break Below 105 USD = Full Bearish Confirmation
---
### 📌 **Trading Plan:**
1️⃣ Potential Short-Term Long if 78.6% - 88.7% Fibo holds.
2️⃣ Target: Resistance before wave (C) completes.
3️⃣ Short Confirmation** after rejection OR break below 105 USD.
‼️ Risk Management:
- If price fails to hold, a deeper correction is expected.
- Trade with proper stop-loss & confirmations!
💬 What do you think? Will we see a short-term bounce before the bear takes over?

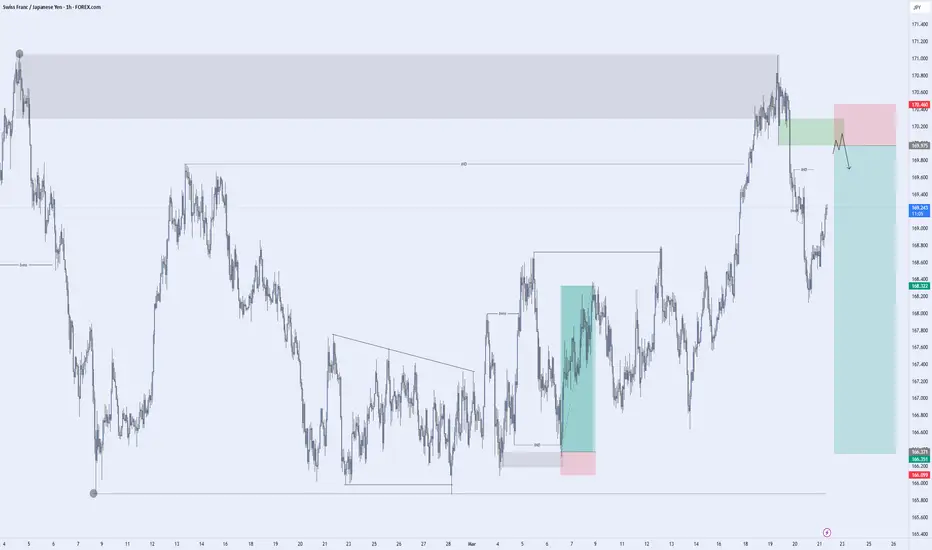
CHFJPY Possible Trend Continuation Hi Traders, here's my breakdown on FOREXCOM:CHFJPY for a potential sell trade .
So we've basically run into structure supply, LTF Flip.
Entry model : Breaker +Inducement + RTBb
Let's hope we get triggered, and most importantly, don't get stopped out lol
#Stay Reactive.
LIKE & FOLLOW
Amazon: Volatile!The Amazon stock has shown significant volatility recently but managed to recover its temporary losses of over 7% just as quickly. We still position the stock within the turquoise wave 3, which should have additional upside potential. Once this high is established—something that may have already occurred—we anticipate a wave 4 pullback before wave 5 completes the larger magenta wave (3) further to the upside. As you can see in the daily chart, this magenta wave (3) acts as a subwave of the green wave , which in turn should lead to the peak of the even larger beige wave III. Following this, we expect a more pronounced wave IV correction before another round of impulsive rallies drives the stock to new highs.

BITCOIN CYCLE CONCEPT, FIB ORBIT & TIME-ZONEBTC CYCLICAL pattern
1 Complete Cycle = 5 UP (green sine-wave) + 3 DOWN (red sinewave)
24 Jan 2025,
BTC entering Fib extension 0.618 (purple). Fib Circle orbit approaching 5.385 extension.
Expect 5 UP green wave to complete around jul-sept 2025 marked by red X-marks whereas Fib time-zone extension of 1.272 coincides with top of green sine-wave 5
Sine-wave cycle study was credited to Lars von Thienen at FSC

EUR/USD price dropEUR/USD price decline is bearish for the next 2 weeks to 10 days
Entry in the range of 0.05645
Successful trade ((Stop Loss)): 0.06465
First target ((Take Profit)): 0.03250
Second target ((Take Profit)): 0.03040
Try to consider a risk to reward of maximum 3 and stick to the suggested entry and exit points

DXY LAST CORRECTION WAVE (WAVE C)Currently, from my perspective, DXY is probably in a corrective wave (ABC). WAVE B, is not yet done but anticipating an end at 99.099 price level. After then comes the last WAVE C then the bearish trend or thread continues....
Let's see how this goes.
WAVE A = 5 WAVES
WAVE B = 3 WAVES
WAVE C = 5 WAVES

XAUUSD Trading plan for the week of May 4, 2024Looking at chart D, we see that with the current price level, the candle has not yet closed above 2430, so we will have 2 plans for next week.
Last week we saw
Information that the Fed still has no plans to cut interest rates and even extends the expected time to reduce interest rates is continuously given by Fed officials. This creates concern that the USD will not weaken, so in the weekend sessions, gold price had a strong adjustment from 2450 to 2332 in the last 2 sessions of the week.
This week we pay attention to two important news: Prelim GDP q/q, Unemployment Claims and Core PCE Price Index m/m
With the forecast decrease in GDP and increase in Unemployment Claims, it is showing the consequences of the tightening economy. Besides, the news of Core PCE Price Index m/m decreasing is a very good sign to help the Fed have monetary plans. currency to run a stable economic development. But we still have to wait for the actual data to be released and it will affect the trend this week.
Looking at chart D, we see that with the current price level, the candle has not yet closed above 2430, so we will have 2 plans for next week.
First plan
- According to the Elliot principle, wave 4 has completed and now the gold price is in wave 5 and this wave 5 is confirmed when the candle closes above 2430.
- Wave 5 will include 5 small waves i ii iii iv v
- Currently, the price correction last weekend has completed wave i and is preparing to complete wave ii to start wave iii
- Looking at the Weekly frame momentum indicator, this indicator has reversed in the oversold area combined with the daily frame momentum as shown on the chart, we see that the momentum has approached the oversold area, signaling that the downward price momentum has weakened.
So our trading plan for next week is to go to the H1 area to find candlestick reversal signals to Buy at this price range of 2334.
Second backup plan
- If the price continues to decline and breaks out through the 2278 area, we will use this backup plan
- At that time, the price continues to complete wave c in the corrective wave abc
- We have measured the target of ending wave C at area 2211
- Then our trading plan waits for the price to reach this target area and then we enter H1 to look for reversal signals at the 2211 price range to buy up.
Note: Sufficient TP, SL to be safe and win the market‼ ️Change data plan will be updated later.
Deekop's analysis is only a personal opinion with a desire to share its views with the community. I'm not always right. But my analysis always reflects my meticulous evaluation of what is best for an investment.

GBPUSD Wave Outlook: Anticipating an Upward TrendDear Traders,
Trust you are doing great.
Below is my outlook of the GBPUSD currency pair from Elliott wave perspective.
Expectation: Another upward wave targeting 1.27202 level.
Key Factors:
1. Presence of an upward motive wave pattern comprising five components (1)/(A)
2. Completion of a corrective pattern resembling an expanded flat
3. Correction (B)/(2) reaching a 50% retracement of the prior wave
4. Correction (B)/(2) finding robust support.
Validity: Analysis remains applicable unless the starting point of the (1)/(A) wave is breached.

BNBUSDT | ABC Pattern - Pullback Entry & Target Mega BullflagA bullish scenario for long-term view after a confirmed descending triangle breakout with a potential pullback entry position targeting ABC pattern at 100% - 161.8% Fib extension upper resistance of the mega bull flag.
S1/S2: pullback descending triangle support / ema20w zone
T1: 100% fib extension +50%
T2: 161.8% +90%
Indicator: RSI week - tapping into OB area with no sign of bearish divergence.

Today, is the gold target 2145 or 2088? Please check the analysi📣 Hello Mates!
We are witnessing a continuing upward trend for Gold, as it has surged by an astonishing 1000 pips within just a week in a buy trend!
🔮 Based on our analysis, we anticipate that Gold may ascend to levels of $2134 or even $2145 before reverting to a downward trajectory to fulfill our target at $2088.
🔑 Remember, money management is crucial. Before employing our analysis, please conduct your own research and refrain from investing more than 2% of your portfolio.
📈 Our Resistance Levels are spotted at:
- 2130
- 2145
📉 And our Support Levels are set at:
- 2088
- 2065
Stay tuned for further updates and trade smartly! 📊

GOLD / USD; Analysis & Trading Plan (05-MAR-24)Hello Traders !! Here is my Gold Analysis & Trading Plan
GOLD in term of structure has been completed. ONLY SELL setup from now on.
Trade With Care,
WAVE HUB FX
----------
Please follow me and like if you agree or this idea helps you out in your trading plan
Disclaimer: This is just an idea. Please do your own analysis before opening a position. Always use SL & proper risk management.
Market can evolve anytime, hence, always do your analysis and learn trade management before following any idea.

Porsche Automobil Holding (PAH3): On the Fast TrackPorsche (PAH3): XETR:PAH3
Our analysis of Porsche Automobil Holding focuses on the stock's price movement since the lows during the COVID-19 crisis at 28.48 EUR. Since then, Wave (1) in blue has expanded to 102 EUR, currently serving as a local high. Subsequently, a remarkably unusual and complex Wave (2) has been observed, which appears atypical at first glance. Upon closer examination, this phase is identified as a flat correction, which falls just above the 78% level, slightly insufficient for a regular flat. In Elliott Wave analysis, as well as in other analyses, it is sometimes necessary to stretch certain rules to reach a conclusion. Whether this is invalid or not is difficult to say at this point.
Currently, the stock suggests that Wave C in red has not yet been fully completed, as the extension of Wave (iii), as expected, took a corrective trend reversal at 41.48 EUR. If this is the case, we are currently witnessing the formation of Wave (iv), with the stock possibly falling one last time with Wave (v) before finally bidding farewell to the overarching Wave (2). The exact timing for this remains open and uncertain. However, as long as Wave 1 does not become invalid, a downward trend is expected for Porsche stock. Potential significant entry points for us could lie in a retest of the Wave (iii) area at 41.90 EUR or even lower. The exact coordinates are yet to be determined, but until then, we anticipate a declining price for Porsche stock.

#Gravita india stock give breakout off its cup and handle neckline -944. as per me stock can reach 1017 its first target and final target can be 1066-71. stock fundamental is good to as its earning is getting better in every result. its only for education purpose only am not responsible for your lose.

What is the best XAUUSD trading strategy?When it comes to trading XAUUSD (Gold/US Dollar), there’s no one-size-fits-all strategy. The “best” approach is highly individual, depending on your trading style, risk tolerance, and personal preferences.
In this article, we will explore four popular trading strategies for XAUUSD:
Trend Trading
Breakout and Retest Trading
Swing Trading
Scalp Day Trading
We will consider strategy pros and cons, trader personality factors, highest potential yield, stop losses and other lifestyle factors.
📈 Trend Trading
The concept of this strategy involves identifying and following the prevailing trend in the XAUUSD market. Traders buy when the trend is upward (bullish) and sell or short-sell during a downward (bearish) trend. The main focus is to capture gains through large movements rather than small fluctuations.
Trend Trading uses technical indicators like moving averages, trendlines, or MACD to identify trends and enter trades.
Pros:
Following the dominant trend in XAUUSD can lead to significant profits, especially in strong, sustained market movements.
It’s relatively easier to identify and follow trends, making it suitable for both beginners and experienced traders.
By trading with the trend, traders potentially reduce their risk exposure.
Cons:
Trend traders might enter a trade after a trend has been established, potentially missing early profits.
Misidentifying a trend can lead to losses, especially in volatile markets.
This strategy requires patience, as holding positions for longer periods can lead to substantial drawdowns during retracements.
Suited personality: Ideal for patient individuals who are comfortable with holding XAUUSD positions for longer durations.
📈 Breakout and Retest Trading
For breakout and retesting, traders look for moments when XAUUSD price breaks out of its typical trading range or surpasses a significant resistance or support level.
This strategy capitalizes on the momentum that follows a breakout. A retest phase, where the price returns to the breakout point, often serves as the entry point.
Breakout and retest trading use chart patterns and volume indicators to identify potential breakouts and confirm their strength.
Pros:
Traders can capitalize on new trends early, potentially increasing profits.
This strategy provides clear signals for entry (breakout) and exit (retest failure).
It works well in various market conditions, especially during high volatility periods.
Cons:
Traders may encounter false signals, leading to premature entries and losses.
This strategy demands rapid responses to market changes, which can be stressful.
Setting stop-losses can be challenging, particularly in volatile markets.
Suited personality: Breakout and retest trading is best for decisive traders who can act quickly and are comfortable with a higher level of risk and uncertainty with Gold.
📈 Swing Trading
Swing traders hold positions in the XAUUSD market for several days or weeks to capture gains from short- to medium-term price movements or “swings.”
This approach balances between the longer-term view of trend trading and the short-term nature of day trading.
Swing trading uses a combination of technical analysis and a basic understanding of market fundamentals to identify potential swing opportunities.
Pros:
Requires less screen time than day trading, allowing for a more balanced lifestyle.
Swing traders take advantage of market “swings” or short-term trends, often leading to substantial gains.
Allows for diversification of trades over different time frames and assets.
Cons:
Positions might have to be held through periods of adverse market movements.
This strategy needs a good understanding of market fundamentals and technical analysis.
Holding positions overnight can expose traders to unexpected market events.
Suited personality: Ideal for gold traders who have the patience to wait for the right opportunity, and are comfortable with holding positions for several days.
📈 Scalp Trading
Scalping involves making numerous, rapid trades on small price changes in the XAUUSD market, accumulating profit from these minor fluctuations.
Scalp trades are held for a very short duration, often just minutes, and require quick decision-making and execution.
This strategy has a strong focus on liquidity, volatility, and using smaller time-frames like one-minute to fifteen-minute charts for precise entry and exit points.
Pros:
Scalpers can make numerous trades in a day, accumulating profits from small price movements.
Short holding periods reduce exposure to large market movements.
Offers an engaging and dynamic trading experience
Cons:
Requires constant market monitoring and quick decision-making throughout your trading period, however your trading period could be as little as 1 hour a day.
Risk to reward per trade are typically smaller as many scalping strategies aim for a 1:1 to 1:3 risk to reward
Suited personality: Scalping is best suited for people who can make quick, decisive moves. It’s most suitable for personalities who like to do highly focused work in small burst time periods and for traders who don’t want to hold positions overnight.
Which XAUUSD Strategy Gives The Highest Yield?
Determining which XAUUSD trading strategy can provide the highest yield and profits is a complex question and highly dependent on market conditions, the trader’s skill level, risk management, and the ability to consistently execute the strategy. However, we can explore theoretical scenarios for each trading style using a $10,000 trading account over a 6-month period, with each trade risking 1% from a stop loss. We will also consider the compounding effects of growing a trading account and trading Gold exclusively.
📈 Trend Trading
Yield Potential: Moderate to High
Trend trading can yield substantial returns over time, especially in strong, consistent market trends.
Scenario Example:
Assuming a conservative estimate of 3% profit per successful trade.
With 10 good trend-following trades over 6 months and compounding gains, the overall profit could be substantial.
However, the growth rate would be slower compared to scalp trading due to fewer trades and a longer holding period.
📈 Breakout and Retest Trading
Yield Potential: Moderate
This strategy can be profitable in volatile markets, but it may offer lower compounding effects due to fewer trades compared to scalping.
Scenario Example:
Assuming an average profit of 2% per successful trade and around 15 trades over 6 months.
The compounding effect would be present but less dramatic than scalping due to fewer trades and potentially more varied outcomes.
📈 Swing Trading
Yield Potential: Moderate
Swing trading can offer good returns, especially if large swings are captured, but the compounding effect is less pronounced due to the longer duration of trades.
Scenario Example:
With an average of 4% gain per successful trade and about 8 trades over 6 months.
The compounding effect would contribute to growth, but the overall yield would be less compared to scalp trading due to the lower number of trades and slower turnover of capital.
📈 Scalp Trading
Yield Potential: Very High
Scalping, with its high frequency and quick profit opportunities, offers the highest yield potential, especially when compounded.
Scenario Example:
Assume an average gain of 1.5% per trade, with 2 trades each day.
Trading 20 days a month, this results in 40 trades per month.
With compounding, each win adds more to the account balance, which then increases the amount risked (and potentially gained) in each subsequent trade.
Over 6 months, this compounding effect, coupled with a consistent win rate, could significantly amplify the initial $10,000 investment, potentially doubling it or more, depending on the exact win rate and consistency of the trader.
Considering all of the above strategies, scalp trading shows the highest potential for compounded yield due to its high frequency, larger per-trade gains and ongoing compounding effects. It also requires a high level of skill and consistency. Each XAUUSD trading style has its own risk-reward balance and compounding potential, and the choice should align with the trader’s capabilities, risk tolerance, and trading goals.
Stop Loss Considerations for XAUUSD Trading Strategies
These trading styles each have its unique characteristics that can influence the likelihood of hitting a stop loss. When a stop loss is hit, your current position is closed instantly, ending the trade, resulting a loss. Understanding these following factors is crucial for effective risk management and XAUUSD strategy selection.
📈 Trend Trading
Delayed Entry
Trend traders often enter a trade after a trend is established, which can increase the risk of a reversal hitting the stop loss.
Length of Trends
If a trend unexpectedly shortens or reverses, stop losses may be hit more frequently, especially in highly volatile markets.
Drawdowns During Retracements
Trends often have retracements. If the XAUUSD retracement is deeper than expected, it might hit the stop loss before resuming the trend.
📈 Breakout and Retest Trading
False Breakouts
A common risk in breakout trading is the occurrence of false breakouts, where the price breaks a key level but then quickly reverses, often hitting the stop loss.
Volatility Spikes
Around breakout points, volatility can spike, which can cause prices to fluctuate rapidly and hit stop losses unexpectedly.
Re-test Failure
If the price fails to re-test successfully and instead reverses quickly, it can lead to hitting the stop loss.
📈 Swing Trading
Overnight and Weekend Risk
XAUUSD swing trades are often held for several days, exposing them to overnight and weekend risks where gaps can occur, potentially hitting stop losses.
Market News and Events
Swing traders might be more exposed to the impact of scheduled economic events or unexpected news, which can cause sudden market moves.
Changing Market Sentiment
As swing trading involves a longer time frame, a shift in market sentiment or trend can lead to stop losses being hit before the anticipated move materializes.
📈 Scalp Trading
Rapid Price Fluctuations
Given the short time frame of XAUUSD scalp trades, rapid and unexpected price movements can easily hit tight stop losses.
Spread and Slippage
In scalp trading, the cost of the spread and potential slippage can be significant relative to the trade size, increasing the likelihood of hitting the stop loss. It’s important to trade with a broker with low spreads
Market Noise
Scalp trading is often affected by market noise (random price fluctuations), which can trigger stop losses more frequently compared to other styles.
Each trading style has its specific factors that can lead to the triggering of stop losses. Understanding these can help in refining stop loss placement, strategy selection, and overall risk management.
Best XAUUSD Strategies Based On The Trader
So we’ve finally made it to our key breakdowns and suggestions based on trader preferences. Based on the various aspects of XAUUSD trading strategies we’ve explored above, here are some suggestions tailored to different types of traders and objectives.
👤 What is the best XAUUSD trading strategy for beginners?
Trend trading is generally the most suitable for beginners. This style’s relative simplicity in identifying trends and its emphasis on patience and discipline provide a solid foundation for new traders. It allows beginners to understand market dynamics without the pressure of making rapid decisions.
This is not to say that beginner traders can’t start their trading journey with other strategies.
👤 What is the best XAUUSD trading strategy for advanced traders?
Scalp Trading is the most suited gold trading style for advanced traders. It requires quick decision-making, an in-depth understanding of market movements, and the ability to handle high-stress situations effectively. Advanced traders are typically better equipped to handle the fast movements of scalp trading, including the rigorous discipline and risk management it entails.
Scalp trading XAUUSD often becomes the natural progression of a gold trader.
👤 What is the best XAUUSD trading strategy for the highest potential yield?
When executed effectively, scalp trading offers the highest potential yield. It capitalizes on small, frequent price movements, allowing skilled traders to accumulate gains rapidly. However, it’s important to note that this high potential yield comes with increased risk and requires a significant amount of skill, experience, and psychological fortitude.
👤 What is the best XAUUSD trading strategy for people who want structure in their day?
Scalp trading can provide a structured trading day due to its high-frequency nature. It requires a trader to be active and focused during specific market hours. If you prefer a structured environment, and want to “work” only during certain hours and in short bursts, scalp trading offers this consistency. This can also provide freedom off the charts outside of your main scalping hours.
👤 Best XAUUSD trading strategy for people who want freedom away from screens?
For individuals seeking more freedom and less time glued to the screen, swing trading is suitable. It doesn’t require constant market monitoring and allows for trades to be held over several days or weeks. This approach provides more flexibility and free time, fitting well for those who value a less intense trading lifestyle. The downside is that there are far less trades meaning you could experience weeks or months with no profits, and also illiquid access to any profits made.
Scalping is a second alternative for freedom away from screens, especially for scalpers who aim to make 1 to 2 trades a day over a short time period then spend the rest of their day doing non-trading related activities.
📈 Best Overall XAUUSD Trading Strategy
Scalp trading stands out to us as the best XAUUSD trading strategy for these reasons:
Highest potential yield based on compounding gains
Ideal for both advanced traders and beginners (who are committed to learning)
Ideal for structure of your day and trading during specific hours
Ideal for traders seeking freedom outside of their screens by not holding on to open positions while they are away from their screens
Ideal for full-time job salary replacement in terms of liquid access to profits due to more frequent trades (Of course, this is performance dependent!)
For traders who have the necessary skills, discipline, and experience, scalp trading can be extremely rewarding and profitable. It offers a dynamic trading environment and the potential for high returns.
If you’re looking to scalp gold, it’s crucial that we emphasize that it requires a high level of education and mentorship before you commence scalping. Beginners are advised to start with the right foundations which we can teach you and provide a solid and stable learning curve to your scalping journey.

FTT UPDATE 18jan24well hi there my greedy friendz!
just quick update and idea
in general, I watched the cartoon Gintama (I love anime, yeah) and glanced at the FTT chart and, as in Japanese animation, saw an interesting twist:
FIRSTLY,
adhering to the old plan, we are in the Wave B of ABC correction and its a Mr.T, az I can see at MACD and RSI indicatosz behavior. Now Mr.T. is being formed with an exit upwards, after which we will go down to buy zone (preferably)
SECONDLY
as a backup plan, the correction could have already been completed and we are growing upwards through the Zigzags of the Leadin' diagonal (no matter ZZ or DZZ) - and its BAAAD COZ I WAS THE GREEDIEST PERSON I ADMIT AAAGGGHHH - my entry iz about 3.5 damn it!!! breathing heavily
THERE IZ A THIRD OPTION actually - look clearly and boost if u find it
so, well, as Elliot bequeathed, don't wishful thinking, analyze the structure- that's what I'm going to do. Orange color - ALT count.
Ideaz are clear, will see what will be next, untill then
TAP DA BUTTON if u UNDERSTAND what I mean
or
spare some coin in signature if u don't :) - I will eat at least

MDB: on the way to next resistance zone at: 550-640MDB price follows an impulsive structure from its Nov22 lows nicely.
Until price holds its Oct's lows, my main interpretation of the price structure suggests move to next macro-resistance zone: 550-640 in 2024.
Suggested price structure needs to be revised if price breaks down bellow 288 and above 640.

💹 EURUSD next week prevision 💹It could go down to points of 1.08773. If it brakes this floor it could go to areas of 1.08102. If it fails to brake the minimum of 1.08773, it could enter an uptrend to look for movement 3 of the Elliot wave until 1.10016 minimum (100% fibo point of the previous inverse wave), being able to continue rising until the point 1.1039. (127% fibo point), to continue with a retracement of the elliot wave movement 4 to the point 1.09087 (23.6% fibo point) and then go looking for the movement 5. If it goes down enough to break the point from C, we would have new B (1) and new C (2). You have to wait for confirmations by looking at corresponding indicators.

USDJPY HTF Breakdown - Bullish Bias Hello guys, so here's how I'm watching USDJPY for buy opportunities. Bear in mind that this is a top down analysis and we will be doing a lot more refinement on the LTF. But as far as directional bias goes, we are bullish on Higher timeframe.

USDCHF: Expecting a Bearish Wave 5 DropThe global trend on USDCHF is bearish. The recent price action in USDCHF suggests the conclusion of a corrective wave of a higher degree wave 4. This corrective structure appears to have ended, potentially paving the way for a significant downward movement within wave 5. In light of this, I'm anticipating a five-wave impulsive decline, with a minimum target set at 0.85546.

CYBER has formed a short-term bottom and is starting a new upwarBINANCE:CYBERUSDT Short-term bottoming out is over! The latest price is at 4.497! Bulls are about to initiate a strong comeback trend!
In the past 1 day and 2 hours, we've witnessed a roller-coaster market with a whopping 32% amplitude. If you're a short-term trader who can withstand staying up late and has sufficient monitoring energy, there have been two valley patterns emerging since the last reversal from the bottom at 3.705. Buying low and selling high, even spot trading alone could yield decent profits!
What's ahead? Let's sketch a quick scenario. As indicated by the arrows in the chart, there are two potential ways to break resistance. One is a direct breakthrough of the first circle, and the other involves a small rebound followed by a stabilizing pullback before piercing the price of the second circle.
For medium-term holders, waiting for the price to reach 6.26 could offer a good swing profit opportunity if there's a sudden surge in volume. If you're a day trader with ample energy and time, exploring each turning point in the tops and bottoms within 1-hour or 2-hour candlesticks could be a strategy.
Additionally, BINANCE:BTCUSDT has seen slight rebounds in the past few days, but it's not enough to confirm a bullish trend. #Bitcoin still needs to retest its August 17th low point at 25166 to ascertain whether it will break down further or confirm bottoming out amid increased volume, transitioning into an upward trend.

USDCAD - SHORTThe price has reached a point of a possible continuation of the downward channel. The price tried to break the channel but immediately got rejected by a bearish candle and the RSI shows a downward momentum. We look for a confirmation for reversal, BUT we have to keep in mind the strong resistance level at 1.36400. We will have a SL just above the structure in order to be ready for the possibility to reach the 1.36400 level and create divergence.
