Fiserv: At the crossroadsWe primarily expect Fiserv to drop into magenta Target Zone between $134.54 and $120 as part of the same-colored wave (2). Investors could then open long positions there, with stops placed around 1% below the lower edge. Subsequently, we expect a rise above the resistance at $165.28. We consider an earlier break of this level to be 37% likely. In this case, however, it would only be the magenta-colored wave alt. (1).
Waveanalyses

Organigram: Home StraightOrganigram should retrace a little further within our magenta Target Zone between C$2.65 and C$1.91 before completing the magenta wave (2). With the low in place, a rise above the resistance at $3.95 is then on the agenda.

Atlassian: One Last DipWe still allow Atlassian a little room to the downside. Above the support at $114.11 it should end the magenta wave (B). Subsequently, a rise above the resistance at $283.25 is on the agenda, which will end the green wave (X).

Booking Holdings: Trend Reversal! The sharpness of the correction and the current structure lead us to consider the last high at $4147 as the end of the major wave (I) in blue. We now expect a countermovement in the green wave (II), which should end below the resistance at $4147. Following this corrective counter-move, we expect further declines. That being said, our alternative scenario (33%) calls for further record highs. In this case, we will still have to place the price in the blue wave alt. (I).

Chainlink: Let’s go!LINK dropped significantly in the last seven days and even briefly undercut our turquoise Target Zone (between $8.20 and $10.90). However, as it was able to turn around quickly and only undercut the range by less than 1%, our count remains intact. We now see the turquoise wave 2 as completed and expect an upward push above the resistance at $20.85 in the further course. Investors could open long positions within our Target Zone. Stops could be placed around 1% below the lower edge. Should the bears push the price significantly below the Zone (37% likely), we will have to anticipate a lower low of the turquoise wave alt.2

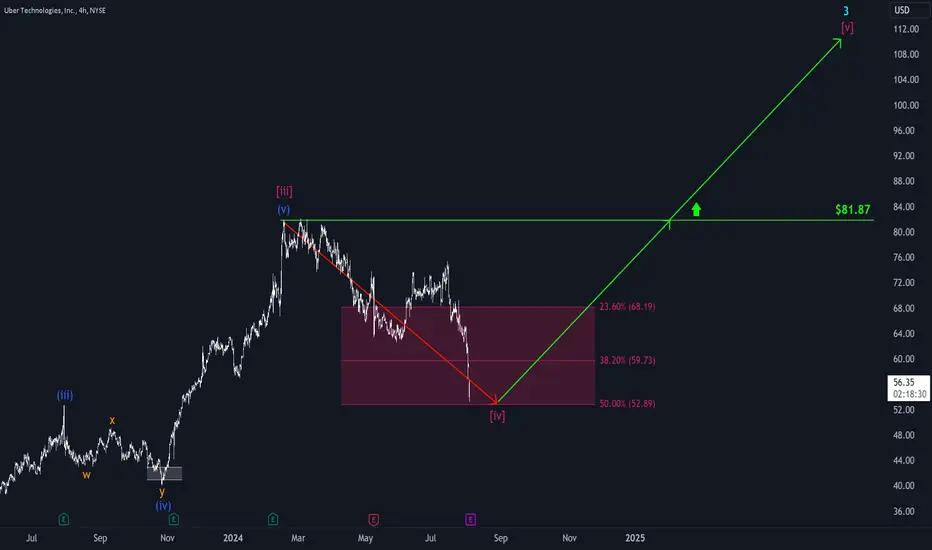
Uber: Turning PointUber has retreated deeper into our magenta Target Zone (coordinates: $68.19 - $52.89). Primarily, the same-colored wave (iv) correction should be in its final stretch. In order to convince us of a low, the price needs to develop a clear impulse to the upside. The entire range can be used to open long positions. As a hedge, a stop could be placed around 1% below our Zone. Following the correction, we primarily assume that the magenta-colored five-wave move should be completed above the resistance at $81.87 which should also mark the end of the turquoise-colored wave 3.
New trade setup before USA ISM DATA XAU/USD buy now 2370.00 and TP 1 2375.00 TP 2 2380.00 TP 3 2385.00 TP 4 2395.00 and stock loss around 2355.00 i dont have enough time to update this why the reason just do it.

Solana: SlumpedSOL retreated quite a bit last week. However, our primary scenario remains unaffected by this development. We continue to see the price in the final stage of the blue wave (i), in the context of which we expect a rise well above the resistance at $210.03. However, we must also keep an eye on our 25% likely alternative scenario, which will be activated by a slide below the $118.89 support level. This option sees the coin already in the blue wave alt.(ii) and would ensure a sell-off into our blue Target Zone (between $109 and $51.20).

Palantir: Resistance Palantir has fallen back below the previously broken resistance at $27.50. Despite the current difficulties with this level, the rally should continue soon with the green impulse wave being expanded further north.

#GBPUSD begining of a 3wave corrective moveAs can be seen, the price appears to be completing a 5th wave of 5, indicating the end of a bullish impulsive move that reached the upper channel line. Now, we could expect a bearish move in the form of an ABC correction or a reversal.
To open a position, we should wait for a bullish corrective move, which could be either wave B or 2, and then try to catch wave C or 3.
Let me know if you would like me to publish an analysis in a lower timeframe on this chart to take advantage of this rally.

Nvidia: SlumpedNvidia dropped below the support level of $115.01. This development is in line with our primary view that the price is currently working on the magenta wave (2). This wave should lead to further sell-offs. However, please note our alternative scenario (27%) which assumes a higher wave alt. (III) top.

Take-Two: Tug of warTake-Two has continued to move sideways above the $130.34 mark over the past two weeks. We primarily expect a resumption of the rise into our beige Target Zone (coordinates: $241.59 - $257.87) to end the beige wave (B) there. However, an alternative scenario (33% likely) will come into play if the stock falls below support at $130.34 which calls for a direct drop to end blue wave alt. (II).

Bitcoin: RecoveryBitcoin recovered and surged back above $67,000 this morning. From a technical perspective, it is quite possible that the price is already working on green wave alt.5. However, only a breakout above the last all-time high at $73,808 will confirm this alternative scenario (40% likely). Primarily, we continue to expect a renewed sell-off into our green Target Zone between $58,655 and $47,012 before the green wave 4 is completed and the rise toward new record highs is on the cards.

Ethereum: ReconsiderationWe expect Ethereum to drop into our Target Zone (between $2807 and $1813). There, we expect the low of green wave 2 to be placed, after which the next major impulse wave 3 should start, leading to a new high for the year. If the price climbs directly above the resistance at $4091 (40% likely), we will already see it in the green wave alt.3.

VeChain: ReturnedVET returned into our blue Target Zone (between $0.0179 and $0.0292) last week. As we consider the blue wave (ii) to have ended, we interpret this development merely as part of the internal substructure of the same-colored wave (iii). Accordingly, we expect further rises and an overcoming of the resistance at $0.055. Investors could therefore open long positions within our Target Zone, whereby stops could be placed about 1% below the lower edge.

Amazon: Almost there!Amazon should continue to decline with the magenta-colored wave (4) into our same-colored Target Zone between $176.91 and $161.83. As soon as it has established the corrective low there, a rise above the resistance at $201.31 is on the agenda. However, we will already see the price in the magenta-colored wave alt. (5) should the resistance be broken early.

Ripple: Please Come Back!The recent rise is not yet significant and sustainable enough to convince us that the low of the magenta wave alt.(c) has already been placed. This scenario (37%) would require a rise above the resistance at $0.9479 for confirmation. For the time being, we stick to our assumption that the altcoin should bounce back and fall below the support at $0.2874 before placing the low of the magenta wave (c).

Disney: Test Of StrengthOn the Disney chart, bulls and bears are currently engaged in a trial of strength within our magenta Target Zone (between $101.24 and $88.36). The price has already tested the 61.80% retracement once, but has since remained above this level. Primarily, we expect further sell-offs and, accordingly, a lower low of the magenta wave (2) in our Target Zone. Once this low is set, the stock should turn upward in order to continue the current upward trend. However, we now consider it 37% likely that the magenta wave alt.(2) has already been completed and that the stock will break out directly above the resistance at $110.62.

#USDCAD expecting wave 3 of 5As can be seen, the price appears to be completing the first and second waves of wave 5. If we see a bullish breakout of our buy setup, we can assume that the 3rd wave is on its way. As a result, after that, any bearish retracement is a buying opportunity.
This analysis is triggered once the price breaks above the previous high.
Let me know if you would like me to publish an analysis in a lower timeframe on this chart to take advantage of this rally.

Fetch.ai: Keep It Up!FET has risen significantly since our last update, which confirms our primary assumption that the turquoise-colored wave 2 has already been completed. With the same-colored wave 3, the coin should now climb above the resistance at $3.47 and thus toward a new all-time high.

VeChain: Turned AroundVET gained sharply last week and left our blue Target Zone (between $0.0179 and $0.0292). In view of this neat turnaround, we now consider the blue wave (ii) to be complete and see the price in the same-colored wave (iii). This movement should reach beyond the resistance at $0.0550. Within the internal substructure, however, it remains possible that our Target Zone could be approached again, which is why we are currently keeping it active. In the event of a further dip, investors can once again cover their positions with long positions, whereby stops could be placed around 1% below the lower edge.

Marathon Digital: Strong!We expect the MARA price to continue to rally during the blue wave (x). Only when the high is placed a little closer to the resistance at $31.30 should there be a sell-off into our magenta Target Zone (between $16.35 and $9.86), which completes the same-colored wave (ii) correction. Within this range, investors can open long positions, whereby stops could be placed around 1% below the lower edge. Once the low is set, the price should rise above the resistance at $31.30. Only our 33% probable alternative scenario calls for a more bearish development: it still places the stock in the green wave alt. (2)

Riot: Tug of warThe bulls and bears are currently engaged in a tug-of-war on RIOT's chart. From a technical perspective, the magenta wave (ii) could already be over. However, we are not yet convinced of this and give the price room to move closer to the support at $7.80. Only when the low of the move is established just above this level should the price turn around and rise significantly with the magenta wave (iii). Following this move, a small interim correction is likely to set in again, but this should be followed by a further rise above the resistance at $20.64, which completes turquoise wave 1. If, on the other hand, the price were to slide imminently below the aforementioned support at $7.80 (36% likely), we will have to see it in the magenta-colored wave alt. (2). In this alternative scenario, it should fall back into the same-colored Target Zone between $6.99 and $5.24.
