Cardano: Ready for Take-OffWe consider the magenta-colored wave (ii) interim correction to be complete and expect an impulsive rise to above the resistance at $0.81.
Waveanalyses

Occidental Petroleum: Do not Slacken!We still locate the Occidental Petroleum stock in the wave (c). In the next step, it should therefore exceed the resistance at $71.19 to mark the high of the superordinate wave B in turquoise. Subsequently, there should be strong sell-offs.

Waste Management: Lower!Primarily, we expect further downward movement, which should take the price below the support level of $189.97. However, please note our alternative scenario (43% probable). This scenario will unfold if the stock breaks significantly above the $218.62 resistance level. In this case, we will have to assume that wave III in beige will make a new high after all. As in the primary scenario, however, far-reaching sell-offs would also be on the agenda here.

Cronos: Turning PointCRO reached a new local low last Friday and then turned upward again. Based on this development, we now consider the green wave (ii) to be finished and see the coin in the green wave (iii). In the further course, the price should clearly overcome the resistance at $0.18. If, on the other hand, we see a sell-off below the support at $0.07 (30% likely), we would instead have to assume a fresh corrective bottom in the form of the turquoise wave alt.2 below the support at $0.04.

Bitcoin: Deep DiveBitcoin managed to reach a new low within our green Target Zone (between $58,655 and $47,012). This move is in line with our expectations. For the time being, we give the price a little more time and room to the downside to complete the current green wave 4. Our Target Zone can, therefore, still be used to establish long positions, whereby a stop 1% below its lower edge could minimize risk. However, please note that BTC could turn upward again at any time, as the technical requirements for the correction low have been met. Subsequently, Bitcoin should continue its overarching upward movement. The first step should take the price above the resistance at $73,462.

Gold: One Last ClimbGold has slowed its newest upward move, but we assume the precious metal will not give up. Indeed, we expect it to realize even stronger (corrective) gains up into our turquoise Target Zone between $2510 and $2631 to finish the turquoise wave B. However, the turquoise wave alt.B could have already concluded below our Target Zone. In this 40% likely case, the price would fall directly below the support at $2285 (without reaching the Target Zone).

S&P500: Final Sprint!Although the current wave 5 in turquoise has already reached a significant size, and the high should be placed soon, we cannot yet regard it as completed. We therefore continue to give the movement room to the upside. As soon as the high is established, the index should turn and head for our magenta Target Zone (coordinates: 4681 - 4434 points). However, please note our alternative scenario (40% probable). In this case, the index would place the top of the green wave alt. (3) with the next high. Consequently, a reversal and a transition into the wave alt.(5) could already be expected in our green Target Zone (coordinates: 5056 - 4878 points).

ExxonMobil: RegenerationWe are primarily assuming that the ExxonMobil stock should rise again significantly as part of the final stage of the green wave (1). Once the high of this movement has been established, a sell-off should follow. However, our please note our alternative scenario (37% probable), which will be triggered on a fall below the support level of $95.77. This option sees the stock in the green wave-alt.(2) correction and will lead to an imminent sell-off.

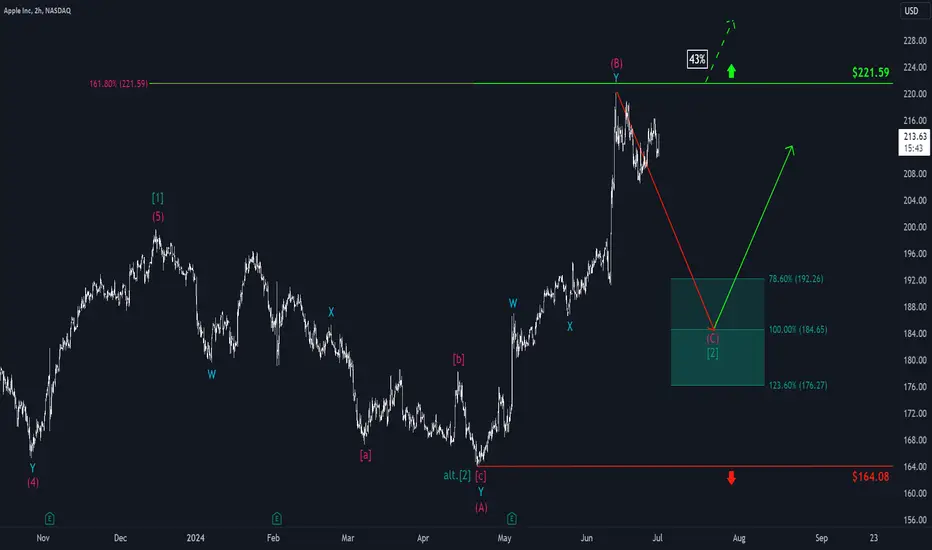
Apple: DownhillApple recently set the high of the corrective wave (B) in magenta just below the resistance at $221.59. The wave (C) should now expand down into our green Target Zone (between $192.26 and $176.27). There the superior green wave (2) should be completed. Subsequently, we expect a reversal and a rise above $221.59. However, please note our alternative scenario (43%) that will come into play on a direct break of this resistance. In this case, the green wave alt.(2) is already complete.
eBay: Knock... Knock...Ebay is trying to overcome the resistance line at $55.50. We expect it to succeed in doing so soon. We expect the high of the current wave b in beige and thus the end of the corrective rise well above this level. If, on the other hand, the stock now heads directly below the support at $46.03, we will have to assume that the wave alt. b in beige is already finished (probability: 37%).

Coca-Cola: Keep Going! In the short term, KO should still climb higher with the current blue wave (y). After the high, we expect another downward move, but ultimately, the resistance at $63.76 should be exceeded again. It is important for the support at $57.93 to hold for our scenario to remain valid.

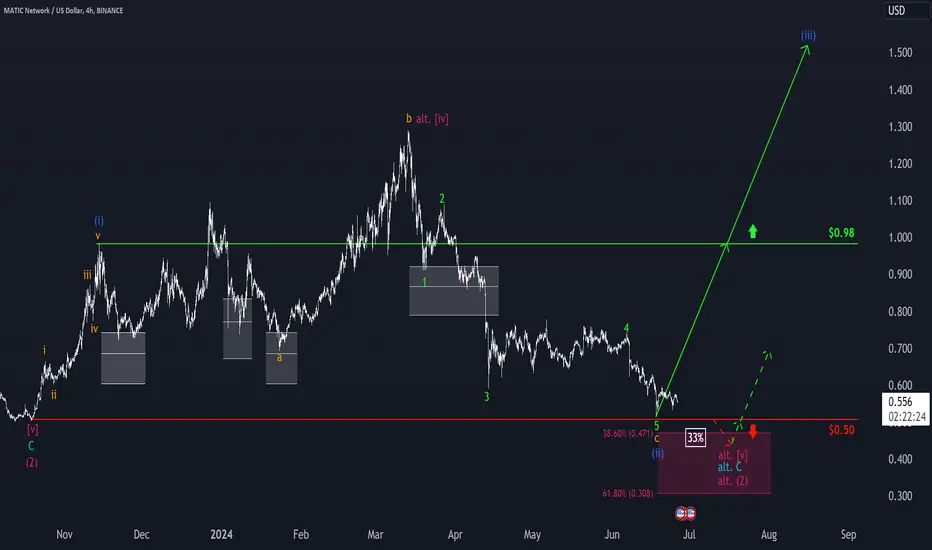
MATIC: Start-Up DifficultiesMATIC struggled to achieve clear upward momentum last week. The bears slowed the coin down, so that it is trading slightly lower today than at the time of our last update. Nonetheless, we still see the price in the blue wave (iii). During this wave, we expect it to rise well above the resistance at $0.98. If, on the other hand, there is a fall below the support at $0.50, we will have to assume a still ongoing wave alt.(2) in magenta, which would first require a setback into our same-colored Target Zone ($0.471 – $0.308).
Bitcoin: Take a dive!Bitcoin once again reached our green Target Zone ($58,655 – $47,012). Although it showed a clear upward reaction directly on the upper edge of the Zone, we primarily expect a deeper dive. As soon as the low of the green wave 4 is established, we expect rises to well above the resistance at $73,462. At the end of this move, the high of the larger wave iii in orange should be established.

S&P 500: One last ClimbWe see the S&P 500 primarily on the last few meters of the magenta wave (1). Although it is of course absolutely possible that we have already seen the high, the price is likely to rebound once more before it brings this movement to an end. Subsequently, we expect a medium-sized correction in the form of the magenta wave (2), which should extend to our same-colored Target Zone between 4851 and 4678 points.

Platinum: Destination Reached Platinum has reached our beige Target Zone between $995.40 and $1026. Within this range, the price should place the high of beige wave (4) and enter a larger sell-off. If, on the other hand, there is a direct break of the resistance at $1105 (28% likely), we will still see the price in the green wave alt.X.

Cardano: Home StretchAs we expected, ADA finally broke out of its sideways range to the downside last week. We now see it on the last legs of the magenta wave (ii). Once the low is established, we expect a sustained upward move above the resistance at $0.81.

VeChain: Turning PointVET has dipped into our blue Target Zone (between $0.0292 and $0.0179). Within this range we expect the low of the blue wave (ii) correction and thus the bullish trend reversal. Accordingly, one can use this Zone to open long positions, whereby any stops could be placed around 1% below the lower edge. With the blue wave (iii), we expect an increase above the resistance at $0.055.

Snowflake: Arriving The Snowflake share has now reached our magenta-colored Target Zone (coordinates: $130.78 - $97.80). There we expect the low of the turquoise wave a. This wave should be followed by a larger corrective rise before a further descent sets in. We consider it 27% likely that the price is already working on the magenta-colored wave alt. (1) is already in progress.

Cronos: Last ChanceCronos briefly left the green Target Zone (between $0.1281 and $0.0954) but returned again. We now see the low of the green wave (ii) placed somewhat lower and primarily expect a reversal. The price should climb above the resistance at $0.18.

Organigram: Time to turn aroundOrganigram has now reached the level within the magenta Target Zone between C$2.65 and C$1.91, where we expect the same-colored wave (2) to end. The price should turn around soon and rise above the resistance at C$3.95.

Tencent: Gathering StrengthTencent is currently moving sideways. We believe that the price is currently building up momentum and should continue to rise soon. Finally, we expect the magenta wave (3) to end above the HK$416.60 resistance.

Gold: One Last ClimbWe expect the gold price to rise once again. We expect the high of the turquoise-colored wave B to occur in our same-colored Target Zone (between $2510 and $2631). After that, the price should sell off significantly. If, on the other hand, there is an early fall below the support at $2285 (45% likely), we will see the price already in the descent now.

Avalanche: Take a dive!AVAX continued to head toward our turquoise Target Zone (between $29.30 and $17.48). We expect a dive into this range before the low of the turquoise wave 2 is placed. Subsequently, the coin should turn around and rally above the resistance at $49.95. Should this level be broken earlier (33% likely), we will have to locate AVAX in the turquoise wave alt.3.
