Aurora: Floating 🌊Aurora is floating and relaxing in our turquoise zone between $1.19 and $0.55 and has drifted below the 61.80%-retracement at $0.95. Although the share could finish wave II in white anytime as it has sufficiently tapped the turquoise target zone, we rather expect Aurora to sink a bit deeper still to conclude the current movement. However, by the bottom of the turquoise zone, the share should establish the low of wave II in white and subsequently turn upwards, heading for the resistance at $2.15.
Waveanalyses


Broadcom: Slide 🛝Broadcom is amusing itself in the playground consisting of the green zone between $648.08 and $577.41 and has lately been lingering mainly at the 78.60%-retracement at $621.54. However, soon, the share should switch over to the red slide leading below the support at $572.10 and into the lower green zone between $531.78 and $465.02 to finish wave 2 in green. This low should then grant the share new upwards momentum. There is a 37% chance, though, that Broadcom could prefer the jungle gym and thus climb above the resistance at $648.50. In that case, we would expect a new high in the form of wave alt.1 in green in the magenta-colored zone between $673.07 and $774.04 first, before the downwards movement can start again.

Altria: You Can Get It If You Really Want 💪You can get it if you really want,
You can get it if you really want,
You can get it if you really want,
But you must try, try and try,
Try and try, you′ll succeed at last.
Altria should take the lyrics of this famous rocksteady song by Jimmy Cliff to heart and continue trying to reach the compound consisting of the turquoise zone between $50.29 and $52.07 and the magenta-colored zone between $50.67 and $53.47. The share can then use either of both zones to complete wave B in turquoise before turning downwards again, resuming the descent below the support at $40.35 to develop wave C in turquoise. There is a 35% chance, though, for Altria to start the downwards movement below $40.35 earlier. In that case, the share would have finished wave alt.B in turquoise by now, would ignore the zone-compound on the upper side and thus deploy wave alt.C in turquoise directly.

Pan American Silver: Resurfacing? 🤿After it had initially been dragged back to the bottom of the blue zone between $13.94 and $21.88, Pan American Silver is currently taking another whack at resurfacing from its depths. By now, the course has managed to establish a new high since the end of wave (ii) in blue and should continue the ascent. We expect the share to leave the blue zone on the northern side, heading for the resistance at $40.11, which should be conquered in due time. However, there is still a 48% chance that Pan American Silver could slip out of the blue zone and drop below the support at $10.61, thus initiating further downwards movement below the next mark at $5.38.

Gold: Shaken, not stirred 🍸Like James Bond, gold seems to prefer shaking to stirring, as its recent movements suggest. In the course of wave B in turquoise, the metal has been bucketed about quite thoroughly and still has got some room left to expand the current ascent. As soon as wave B in turquoise is finished, though, gold should turn downwards and resume the overarching descent by developing wave (4) in yellow. However, there is a 35% chance that the precious metal could use the turquoise zone between TADAWUL:1830 and HKEX:1709 as an early exit, completing wave alt.2 in turquoise and shifting upwards from there.

Walmart: Within Reach 🙌Ever been to the supermarket and couldn’t reach the topmost rack? Walmart seems to have a similar problem, struggling to let go of the mark at $150.12 to hit the turquoise zone between $152.54 and $161.76. However, we expect the share to touch at this area soon to finish wave B in turquoise. This done, it should turn downwards, returning below $150.12 and slipping further below the support at $136.09 to complete wave (A) in magenta. After a short counter movement back above $136.09, the share should drop below the support at $117.27 and into the gray zone between $116.49 and $105.01 to place the final low of wave IV in gray, which should then initiate a new upwards trend. There is a 37% chance, though, that Walmart could shoot through the turquoise zone and conquer the resistance at $161-76 directly.

Shopify: Lift Your (Shopping-)Bags! 🧺🛍Shopify should lift its laden shopping bags – or are they too heavy? We expect the share to move upwards, climbing above the resistance at $57.50 and further from there. There is a 31% chance, though, for Shopify to make a detour below the support at $38.90. In that case, the share would develop a new low in the form of wave alt.(B) in magenta first before heading upwards.

Fresnillo: Easter Egg Hunt 🥚🐣🐰Has Fresnillo gotten lost, hunting for Easter eggs? We don’t think so! We rather understand the share to be swerving, interspersing its way with a little counter movement. Soon, the course should return to the main path and fall below both the supports at GBP 610 and GBP 456.60 to continue the descent. However, a 30% chance remains for Fresnillo to make a more extensive detour. In that case, the share would climb above the resistance at GBP 997 to develop wave alt.B in turquoise in the turquoise zone between GBP 1086.00 and GBP 1292.50 first before heading downwards again.

PayPal: More Weight! 🏋️Load up – PayPal needs more weight to gain enough downwards pressure! We expect the share to make it below the support at $66.11 and thus into the gray zone between $66.16 and $34.93. There, the course should complete wave II in gray and take off above the resistance at $93.52 afterward. However, there is a 35% chance that PayPal could conquer this mark earlier and skip its visit to the gray zone. In that case, we would consider wave alt.II to be already finished.

Netflix: Bringing It on Stream 🎞Netflix has brought wave b in magenta on stream quite commendably and has already touched at the gray zone between $343.40 and $359.13. Thus, wave b in magenta could be finished by now, although the share could just as well use the remaining room in the upper part of the gray zone to place the corresponding high. As soon as this is done, the course should turn and head for the turquoise zone between $271.07 and $209.09 to develop wave B in turquoise. Afterward, Netflix should tackle the resistance at $379.43, which should then be conquered by wave C in turquoise. However, we should still keep in mind the 35% chance that the stock could break through the turquoise zone and drop below the support at $162.75.

Cronos: Getting Up with The Chickens…? 🐔⏰Getting up with the chickens obviously isn’t really Cronos’s scene. The altcoin is lolling on top of its magenta-colored bed and seems to find it hard to rise and shine. However, we expect our crypto-friend to do exactly this! Cronos should get up from the magenta-colored zone and climb above the resistance at $0.0887, pushing itself upwards from there to finish wave 3 in green. After the moderate counter movement of wave 4 in green, which should also remain above $0.0887, the altcoin should clamber higher still. There is a 33% chance, though, that Cronos could topple off its magenta-colored bed and slip below the support at $0.0542 to develop a new low in the form of wave alt.2 in turquoise.

Natural Gas - Weekly. Financial WaveOur priority scenario in NG is a pullback of the price in wave 4 to 3.5 $ after which, most likely, NG will go to the final descending wave 5 and the price can come to 1.5 $, but not below 1.423 $

United Health: Healthy As A… Bear? 🐻… or what was that saying again? Anyway, after a short hiatus, the bears in our United Health-chart should regain their health and get back to work. They should soon push the share below the support at $456.73 and from there into the dark green zone between $427.67 and $391.43, where wave A in dark green should end. This low should then be followed by a considerable upwards movement above the resistance at $501.40. There is also a 37% chance that United Health could cold-shoulder the dark green zone and climb above $501.40 directly. In that case, we would consider wave alt.A in dark green to be already finished.

Tilray: Wait and See… 😌After initially spurring the downwards movement so commendably from the high of wave (4) in magenta, Tilray has been relaxing in a sidewards movement since December. However, there is yet some work to be done! We expect the share to drop a bit deeper still to finish wave II in gray, whose low should then form the basis for a fresh upwards movement. Wave (1) in magenta should carry the course above the resistance at $5.12 eventually and even the subsequent counter movement should peter out above this mark.

Ethereum: Reaching Out… 🙌Ethereum is reaching out to complete wave 1 in green and still has got some room to rise. As soon as the respective high is established, though, the cryptocurrency should turn downwards and head for the green zone between $1607 and $1424, where wave 2 in green should end. With this low secured, Ethereum should then resume the ascent by developing wave 3 in green. However, a 30% chance remains for Ethereum to scoot below the support at $1370, which marks the last significant low of wave ii in orange. In that case, we would reckon with a new low in the form of wave alt.ii in orange in the orange zone between $1330 and $1150 before ETH can continue the upwards movement.

GDX: Gardening 🌱🌷🌹It’s springtime and GDX is working on wave B in green in its green garden between $30.01 and $32.58. Soon the ETF should harvest the respective high, which could be settled anytime. Afterward, the course should turn and leave the garden on the southern side to expand wave ii in orange. This downwards movement should end well before the support at $21.52, though, so that GDX can resume the ascent. However, there is a 38% chance that the ETF could slip below this mark and thus continue the descent instead.

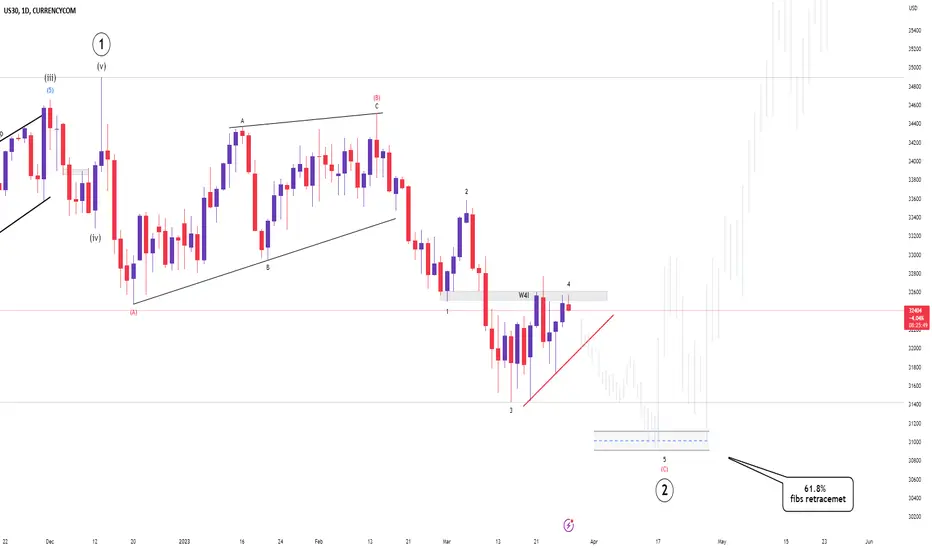
US30 ELLIOT BREAKDOWN (FINAL DROP) Wave previously ended as a the continuation of the whole bullish movement and contains 5 impulse waves (12345 waves). Current, we just see the market about to complete the second wave which conatins three waves with 3-3-5 formation as it sub waves.
lets see how everything play out.
Adobe: Well On The Way 👍Adobe is well on the way to completing wave B in green, although the course still has got some room to expand the current movement. However, before the resistance at $402.49 at the latest, it should turn downwards again. Thus, the share should drop below the support at $278.23 and into the adjacent gray zone between $278.96 and $227.74, where it should then conclude wave b in gray. There is a 32% chance, though, for Adobe to continue the ascent above the resistance at $402.49. In that case, we would consider wave alt.b in gray to be already finished.

Texas Instruments: Don’t Rush It! 🐢With a healthy respect, Texas Instruments is advancing toward the resistance line at $158.99 slowly but surely. Soon, the share should climb above this mark and push off into the green zone between $215.90 and $237.98 to complete wave B in green before turning downwards again. There is a 33% chance, though, that the course could shift away from the next resistance line, dropping below the support at $144.49 instead. In that case, we would expect Texas Instruments to develop wave alt.IV in gray in the gray zone between $130 and $107.68 before moving upwards anew.

Uniswap: Shake a Leg! 🦵Uniswap should shake a leg now and start moving upwards. The altcoin should push further off the lower edge of our pink trend channel, where it has recently finished wave d in magenta, and soon make it above the resistance line at $9.82. There, our crypto-friend should climb into the turquoise zone between $13.03 and $16.03 to complete wave e in magenta as well as wave 4 in turquoise. Afterward, we expect Uniswap to head southwards again. The altcoin should return below $9.82 and continue the descent until the support at $3.33. Shortly before this mark, it should stop, though, to conclude wave 2 in green. However, there is a 33% chance that Uniswap could slip below $3.33. In that case, the altcoin would develop wave alt.2 in green earlier (and lower).

DAX: Beam us up, Mr. Scott! 🖖Happy Birthday, William Shatner! Consistent with the great day of the actor playing Captain James T. Kirk in Star Trek , DAX was also beamed up – and considerably so. From the low of wave iv in pink, the index has shot upwards by about 5% and should still continue the ascent above the resistance line at 15 703 points, where it should complete wave 1 in blue. However, a 35% chance remains that DAX could slip below the support line at 14 617 points. In that case, the index would first develop wave alt.iv in pink to establish a new low in the pink zone between 14 299 and 13 863 points before moving upwards again.
