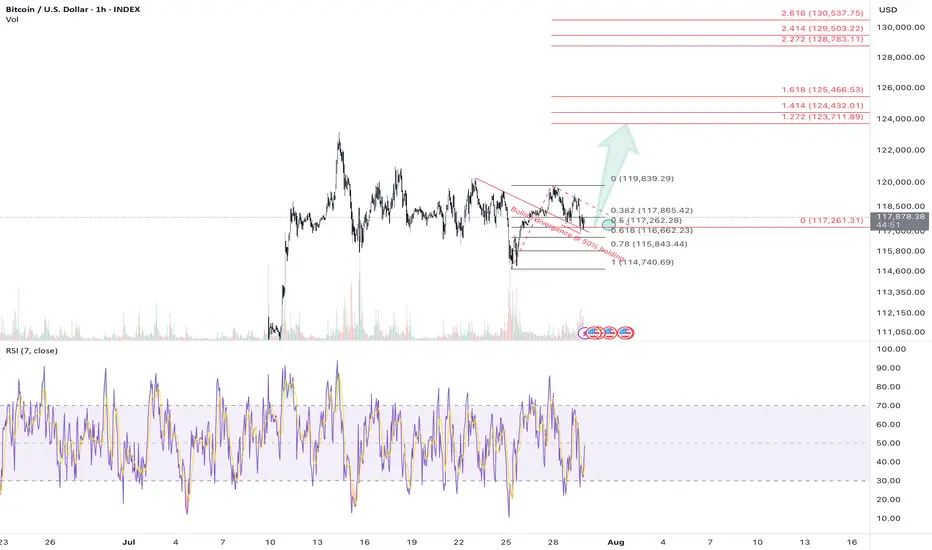
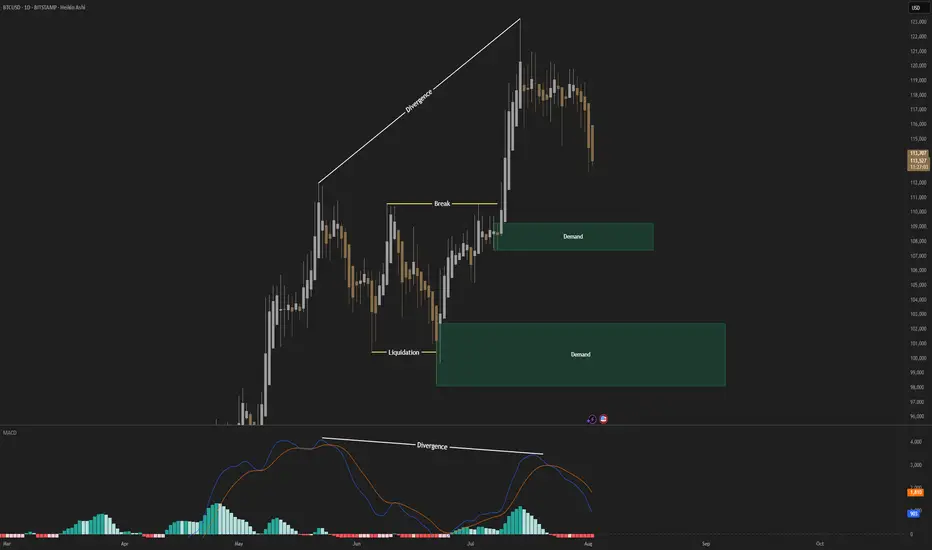
BTC / BNB Buying opportunityBTC is near equal leg from all-time high, as the dollar index is pulling back, and BTCis on an Equal leg, along with BNB supporting upside possibility
BTC Entry: 111300
SL: 105100
Target: 124000
Risk: Reward - 1:2
BNB Entry: 720
SL: 660
Target: 900
Risk: Reward - 1:3
Watch my YouTube video for detailed analysis
Wave Analysis

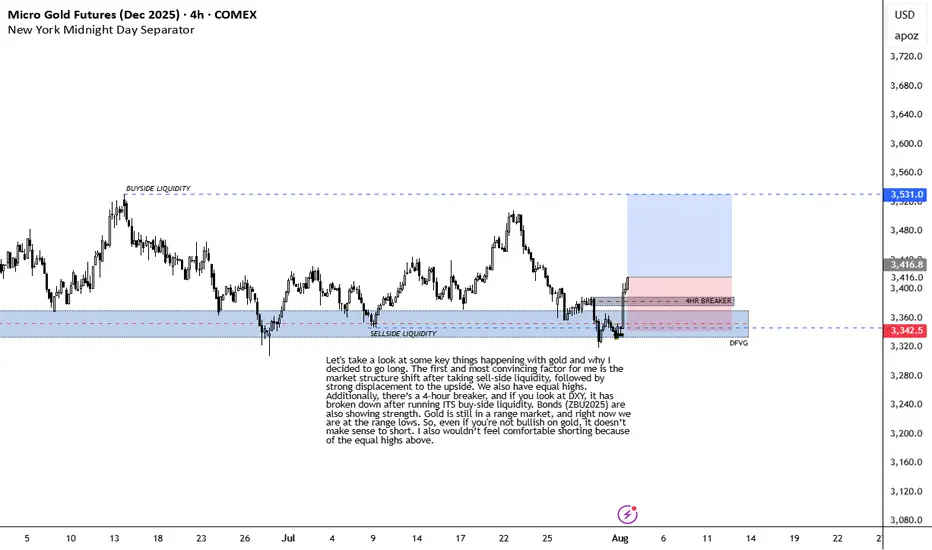
BULLISH ON GOLDLet's take a look at some key things happening with gold and why I decided to go long. The first and most convincing factor for me is the market structure shift after taking sell-side liquidity, followed by strong displacement to the upside. We also have equal highs. Additionally, there’s a 4-hour breaker, and if you look at DXY, it has broken down after running ITS buy-side liquidity. Bonds (ZBU2025) are also showing strength. Gold is still in a range market, and right now we are at the range lows. So, even if you're not bullish on gold, it doesn’t make sense to short. I also wouldn’t feel comfortable shorting because of the equal highs above.
INVALIDATION IS RECENT 4HR LOW.
Nifty view 1-hour WXYXZ correction observed. The next move is expected towards the 25,050–25,200 zone. Direction will be confirmed based on market reaction.
If the reaction is negative, a Wave B structure is possible.
I am not strongly bearish, but I have a slightly bullish outlook, with a potential move towards the 0.618–0.786 Fibonacci retracement zone.
,
,
,
<><>
<>>
I am not a SEBI-registered advisor. The content shared is for educational and informational purposes only and should not be considered as investment advice. Please consult a SEBI-registered financial advisor before making any investment decisions.

In-depth Analysis of the Gold Bull-Bear Game on August 4th:
I. Gold's Current Core Contradiction
Bull Support Factors
Weak non-farm payroll data reinforces expectations of a Fed rate cut, with the market betting on an over 80% probability of a September rate cut.
Risk Aversion: Although the tariff extension has not yet been finalized, the market remains concerned about escalating trade frictions, and gold is in high demand as a safe-haven asset.
Technical Breakout: Friday saw a strong breakout above the 3340-3350 resistance zone, with the daily chart showing a positive enveloping negative trend. Short-term bullish momentum prevails.
Potential Short-Term Opportunities
Monthly Top Signal: Consecutive high-level doji candlesticks with long upper shadows suggest medium-term selling pressure.
Fundamental Bearish Hidden Dangers:
The Fed's independence remains, and Powell may not cut interest rates prematurely due to pressure from Trump.
II. Key Technical Signals
1. Weekly Level: Range Unbroken
The 3268-3438 range persists, currently nearing its upper limit, so be wary of a pullback.
Bollinger Bands are converging, with the MA5/MA10 convergence signaling an approaching market reversal window.
2. Daily and short-term cycles: Overbought correction needs
After Friday's surge: 4-hour/1-hour RSI is overbought, the Bollinger Band opening is unsustainable, and a technical retracement is needed.
Key positions:
Resistance: 3376 (previous high) + 3385 (Fibonacci expansion level);
Support: 3340 (top and bottom conversion) + 3315 (bull defense line).
3. Triangle convergence pattern:
If it opens high and breaks through 3376 on Monday, August 4, it may test 3400; if it opens low and falls below 3340, it will look down to 3315-3280.
III. Operation strategy for next week on August 4
(1) Response to three opening scenarios
Scenario 1: Opening high (above 3370)
Strategy: Short in batches in the 3376-3385 area, stop loss at 3400, target 3340→3315.
Logic: Positive overdraft + technical overbought, betting on a pullback.
Scenario 2: Flat opening (around 3360)
Strategy: If the price rises from 3366 but does not break through, go short with a light position, stop loss at 3376, target 3340; if it falls below 3340, go short and look at 3315.
Alternative: If the support at 3340 is effective, go long, stop loss at 3330, target 3360.
Scenario 3: Low opening (below 3340)
Strategy: Go long in the 3338-3340 area, stop loss at 3325, target 3360; if it breaks through 3315, go short.
(2) Mid-term layout
Short opportunity: Go short in the 3385-3400 area, stop loss at 3420, target 3245 (monthly support).
Buy opportunity: If the price falls back to 3315-3280 at the beginning of the week and stabilizes, go long in the mid-term, stop loss at 3260, target 3400.
IV. Risks and Warnings
Beware of institutional manipulation: Friday's late-day surge may be a trap for buying; beware of a flash crash at Monday's opening.
Data disturbance: Pay close attention to the speeches of Fed officials. If inflation rebounds or hawkish remarks are made, it will be bearish for gold.
Undetermined trend: The market is still volatile and unilateral trends need to wait for confirmation of a breakthrough in the range.
Conclusion
Short-term: Prioritize shorting in the 3370-3385 area, and enter long positions in the 3340-3315 area when appropriate, maintaining strict stop-loss orders.
Mid-term: The monthly bearish pattern has not changed, and above 3385 is the ideal entry point for short positions.
Key Strategies: "Don't chase long positions during strong resistance; don't sell short during deep declines; follow the trend after a breakout; exercise caution in controlling the market."
BTC190000 soonthis is way to btc going to 190000 soon or late after that i say btc should have very massive sell
but befor that we nead to btc go to up 190000

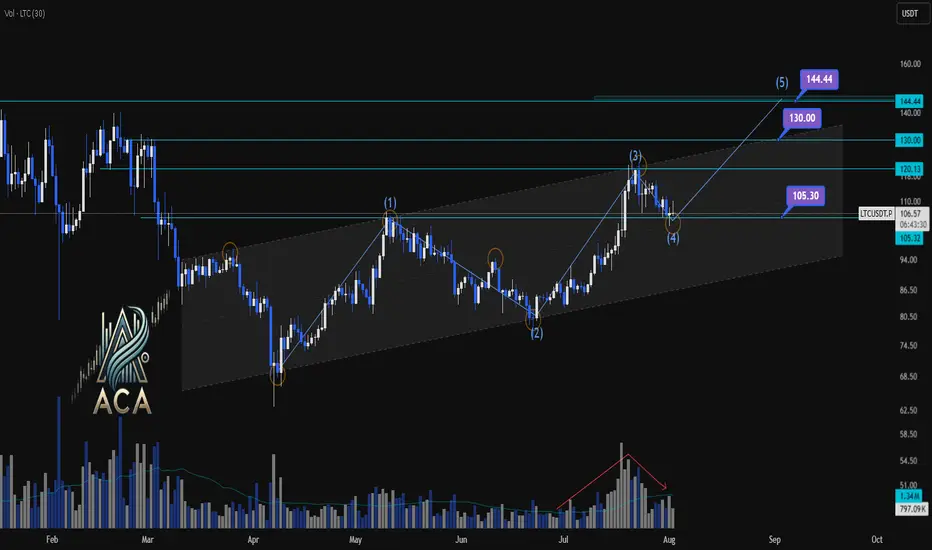
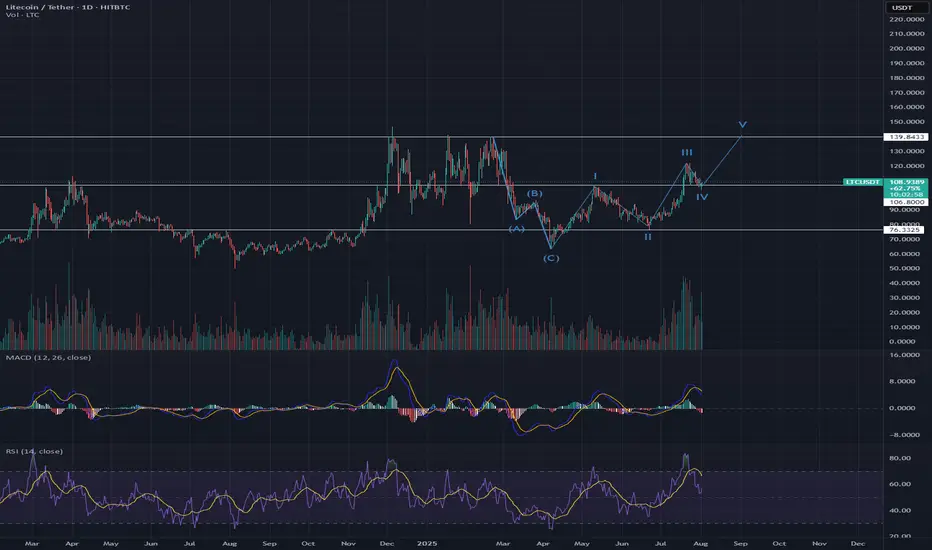
LTCUSDT | Daily Chart Analysis | Bullish Structure UnfoldingLTCUSDT | Daily Chart Analysis | Bullish Structure Unfolding
🔍 Let’s break down LTC/USDT’s technical setup, focusing on volume, Elliot Wave structure, and key target levels for this bullish scenario. If you're following this channel, be sure to react and let us know your thoughts on the roadmap!
⏳ Daily Overview
LTCUSDT is moving within a defined ascending channel, supported by increasing bullish momentum and clear Elliot Wave progression. The recent wave count points to a textbook impulse, setting up the next key move.
🔺 Long Setup:
The market has completed Waves (1) through (4), and we’re now looking at the development of Wave (5) to the upside.
- Wave (5) Target Zones:
- $130.00
- $144.44
These are the next resistance levels based on previous highs and channel dynamics.
- Key support to watch:
- $105.30 — this zone may act as a springboard for the next rally if tested.
📊 Key Highlights:
- Volume has shown a clear bullish divergence as price advances, signaling growing interest and strength heading into Wave (5).
- The bullish channel remains intact, and each dip has been met with higher lows, confirming the ongoing uptrend.
- Elliot Wave structure suggests further upside, with the $130.00 and $144.44 levels as potential targets.
🚨 Conclusion:
LTC bulls should keep an eye on price action as it approaches support at $105.30 — a bounce here could ignite the next leg higher toward our target zones. Reaction from the channel community will be crucial as Wave (5) unfolds. Show your support with a reaction below if you’re riding this wave!
Short-term: Jump over the creek, ready for markupWhen market is in an uptrend, I look for divergence in the price as it holds 50%.
The chart as you see it pictures a perfect scenario for a trade entry, but make sure to have a stop loss set at fib retr. around 70%.
We could see the price going upwards from right here and right now.
Please note that I don't trade real money - I'm in it just for the thrills and fun.
Potential Buy Opportunity on USDCHFReasons I think this pair will rise
- Price printed a higher low on a confirmed bearish trendline. Which is a sign of momentum loss
-Price broke through the aforementioned trendline
- Bullish RSI divergence printed before momentum loss on H4
-RSI was oversold on H4
What do you think?

Potential Buy Opportunity on USDCADReasons I think this pair will rise
-Price gave us a triple bottom formation which tells us bears could not continue pushing the market down. Suggesting price will rise.
- RSI was oversold on the 4H
What do you think ?

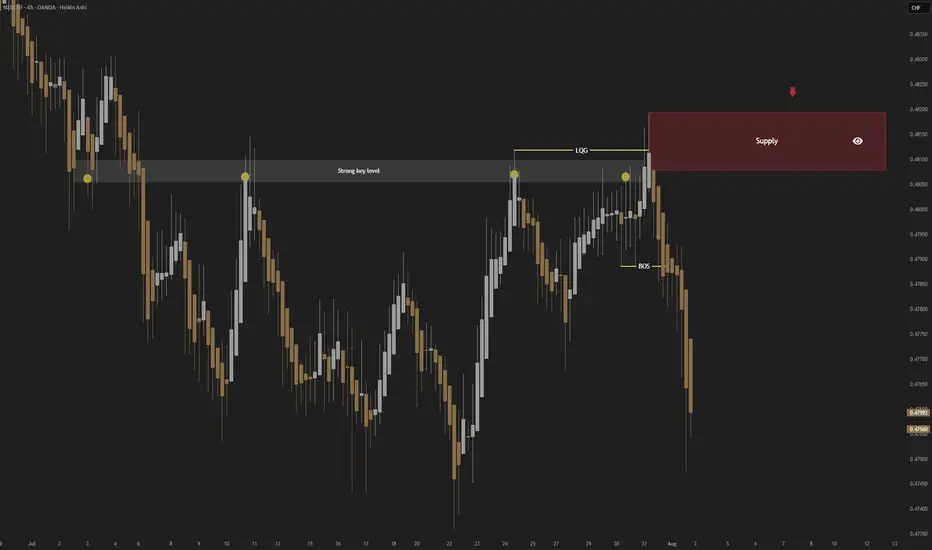
NZDCHF; Heikin Ashi Trade Idea📈 Hey Traders!
Here’s a fresh outlook from my trading desk. If you’ve been following me for a while, you already know my approach:
🧩 I trade Supply & Demand zones using Heikin Ashi chart on the 4H timeframe.
🧠 I keep it mechanical and clean — no messy charts, no guessing games.
❌ No trendlines, no fixed sessions, no patterns, no indicator overload.
❌ No overanalyzing market structure or imbalances.
❌ No scalping, and no need to be glued to the screen.
✅ I trade exclusively with limit orders, so it’s more of a set-and-forget style.
✅ This means more freedom, less screen time, and a focus on quality setups.
✅ Just a simplified, structured plan and a calm mindset.
💬 Let’s Talk:
💡 Do you trade supply & demand too ?
💡What’s your go-to timeframe ?
💡Ever tried Heikin Ashi ?
📩 Got questions about my strategy or setup? Drop them below — ask me anything, I’m here to share.
Let’s grow together and keep it simple. 👊
US30 Swing Short!
HI,Traders !
#US30 keeps falling down
And the index broke the
Key wide horizontal level
Around 43924.6 which is now
A resistance and the breakout
Is confirmed so we are very
Bearish biased and we will
Be expecting a bearish
Continuation on Monday !
Comment and subscribe to help us grow !

#MANTA/USDT – Bullish Setup Alert ?#MANTA
The price is moving within a descending channel on the 1-hour frame and is expected to break and continue upward.
We have a trend to stabilize above the 100 moving average once again.
We have a downtrend on the RSI indicator that supports the upward break.
We have a support area at the lower boundary of the channel at 0.190, acting as strong support from which the price can rebound.
We have a major support area in green that pushed the price upward at 0.186.
Entry price: 0.196
First target: 0.205
Second target: 0.214
Third target: 0.225
To manage risk, don't forget stop loss and capital management.
When you reach the first target, save some profits and then change the stop order to an entry order.
For inquiries, please comment.
Thank you.

#BONK/USDT About to Break Out !#BONK
The price is moving within a descending channel on the 1-hour frame and is expected to break and continue upward.
We have a trend to stabilize above the 100 moving average once again.
We have a downtrend on the RSI indicator that supports the upward break.
We have a support area at the lower boundary of the channel at 0.00002440, acting as a strong support from which the price can rebound.
We have a major support area in green that pushed the price upward at 0.00002372.
Entry price: 0.00002552.
First target: 0.00002694.
Second target: 0.00002882.
Third target: 0.00003118.
To manage risk, don't forget stop loss and capital management.
When you reach the first target, save some profits and then change the stop order to an entry order.
For inquiries, please comment.
Thank you.

NZDUSD What Next? SELL!
My dear subscribers,
This is my opinion on the NZDUSD next move:
The instrument tests an important psychological level 0.5920
Bias - Bearish
Technical Indicators: Supper Trend gives a precise Bearish signal, while Pivot Point HL predicts price changes and potential reversals in the market.
Target - 0.5899
My Stop Loss - 0.5932
About Used Indicators:
On the subsequent day, trading above the pivot point is thought to indicate ongoing bullish sentiment, while trading below the pivot point indicates bearish sentiment.
Disclosure: I am part of Trade Nation's Influencer program and receive a monthly fee for using their TradingView charts in my analysis.
———————————
WISH YOU ALL LUCK

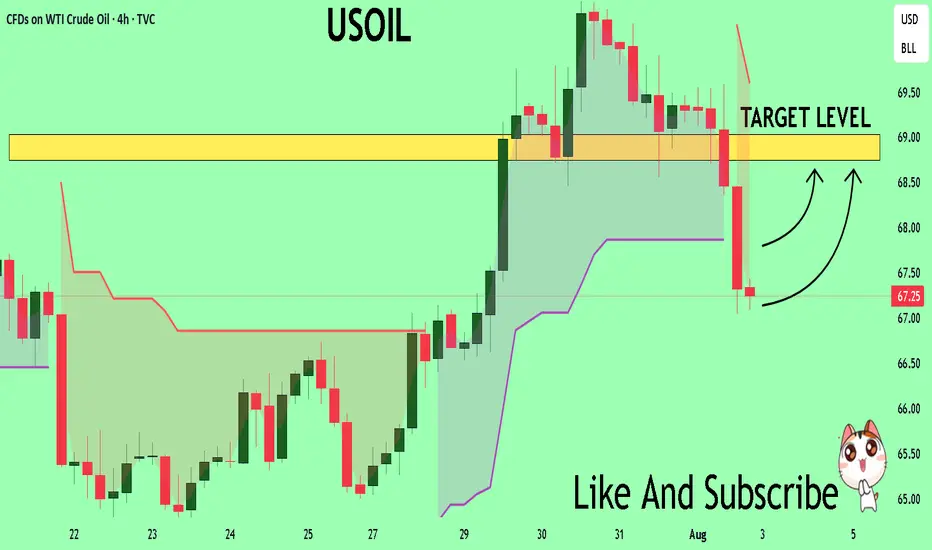
USOIL Technical Analysis! BUY!
My dear followers,
I analysed this chart on USOIL and concluded the following:
The market is trading on 67.25 pivot level.
Bias - Bullish
Technical Indicators: Both Super Trend & Pivot HL indicate a highly probable Bullish continuation.
Target - 68.74
About Used Indicators:
A super-trend indicator is plotted on either above or below the closing price to signal a buy or sell. The indicator changes color, based on whether or not you should be buying. If the super-trend indicator moves below the closing price, the indicator turns green, and it signals an entry point or points to buy.
Disclosure: I am part of Trade Nation's Influencer program and receive a monthly fee for using their TradingView charts in my analysis.
———————————
WISH YOU ALL LUCK
BTC; Heikin Ashi Trade IdeaAfter a correction, price may have a good reaction from first demand area I have marked.
Lower demand zone is even more valid, since we see manipulation and then impulsive move to the oposite side.
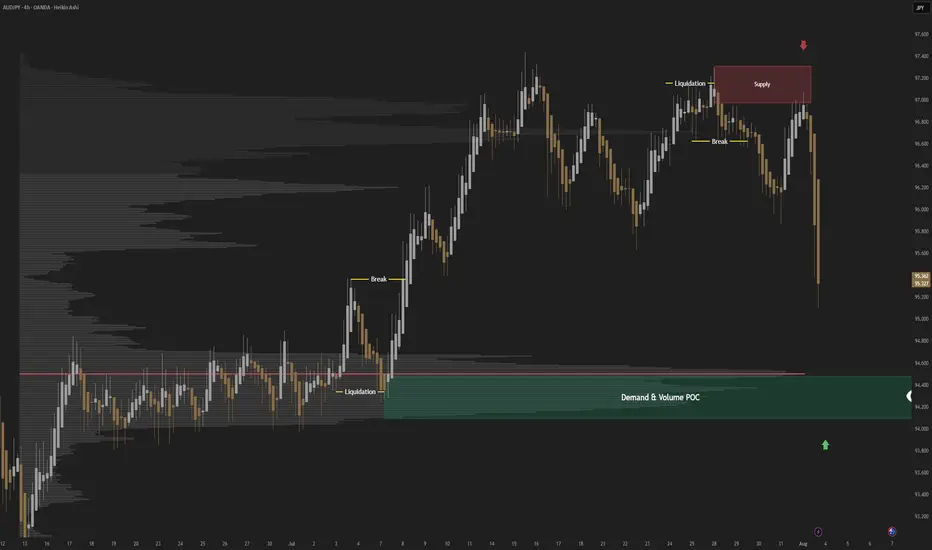
AUDJPY; Heikin Ashi Trade IdeaIn this post, I’ll be sharing my analysis of AUDJPY with my unique Heikin Ashi strategy.Picture tells more than 1000 words, no BS. I highlight key areas where I’m anticipating potential opportunities.
I’m always happy to receive any feedback.
Like, share and comment! ❤️
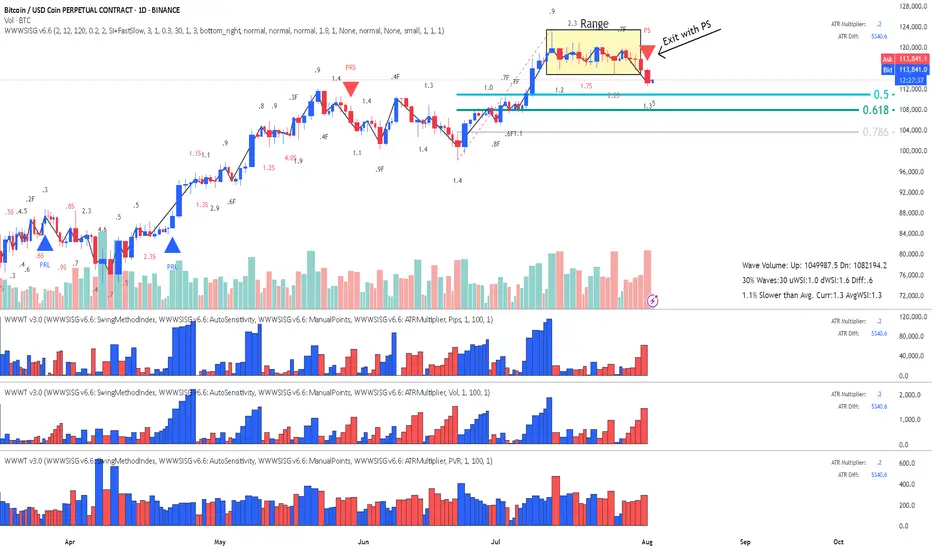
BitCoin - Is it heading for the Fib?This is a classic Entry Short for Weis Wave with Speed Index owners called " Exit from Range with a Plutus Signal" and in this case it was a PS. It looks that it's heading for the Fib, I will wait for some pullback on 1HR to confirm with Speed Index and the waves, as well as getting a better RR.
I
Dollar Index in Danger: Patterns Point to More DownsideThe dollar index (DXY) is flashing serious warning signs. In this video, I break down the technical evidence behind my bearish outlook on both the monthly and daily charts. The head and shoulders pattern we spotted did work it's way to breaking the neckline BUT the target will Not be achieved as the data on the charts have changed. On the daily charts we have a strong bearish engulfing candle, there is also an RSI divergence in the overbought zone, stochastic indicator has turn down and momentum is also following along. The downtrend on the monthly timeframe has not formed any divergence yet so I expect price to fall below the previous month's low in the coming weeks.
There will be bounces from support zones on the daily and 4 hours, these will be opportunities for good entries.
If you’re holding USD or trading around it, this is a must-watch. The signals are clear—are you prepared?
Cheers and I wish everyone a profitable trade in the coming week.

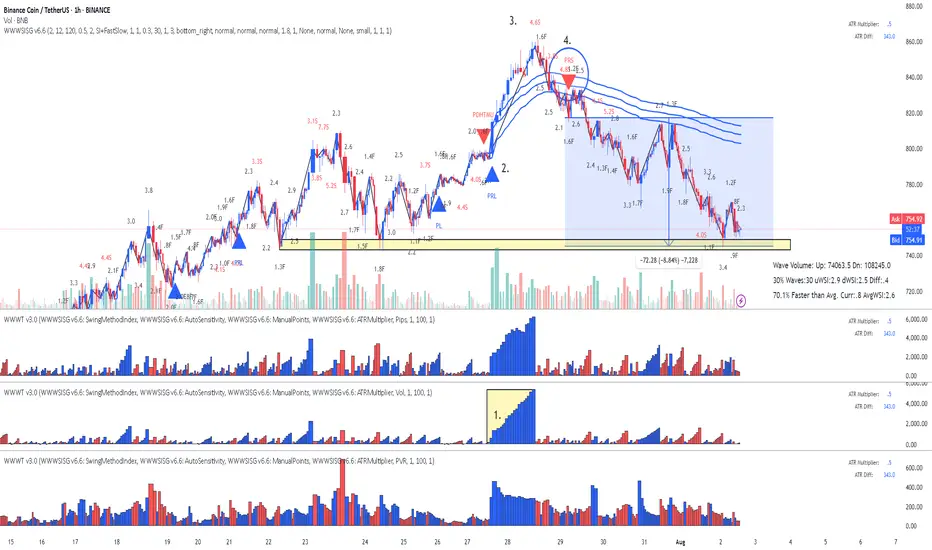
BNB Binance Coin: Lesson 15 methodology did the job again
Lesson 15 methodology (annotations in sync with the chart):
1. Largest up volume wave after a while - sellers might be in there.
2. Placed AVWAP and waited for price to cross downwards and pullback again on AVWAP
3. HTMU (hard to move up) - Abnormal Speed Index 4.6S at the top
4. Entry short signal PRS with abnormal SI 4.8.2 (price has a hard time to move up - absorption)
Simple as that. Enjoy!
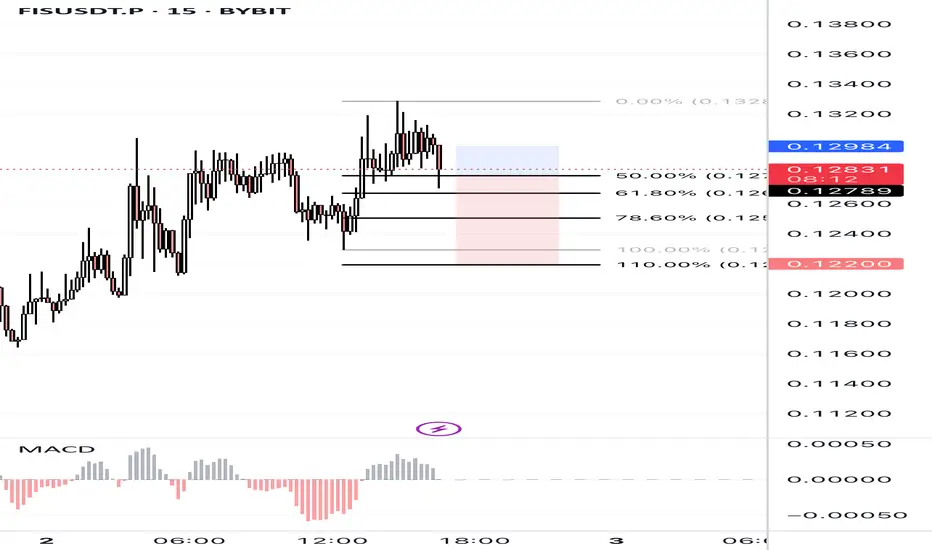
FISUSDT.P 15m – Bearish Rejection at Fib Zone | Short SetupPrice faced strong rejection at the 0.13280 high, forming a double top and now pulling back. Current move aligns with Fibonacci retracement zones, with price reacting near the 50–61.8% zone. MACD histogram is weakening, signaling bearish momentum.
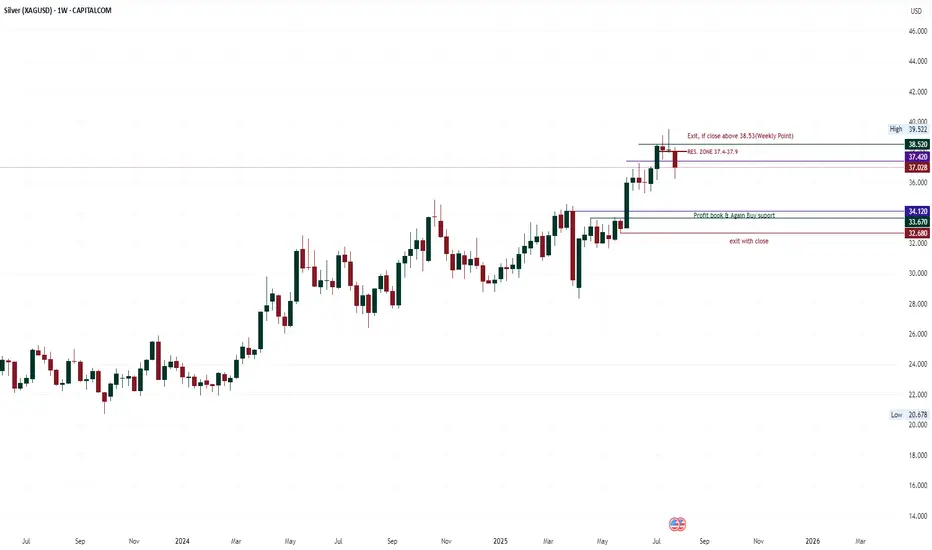
silver correction patternThere has been no close above 38.52 in the last 4 weeks, i.e. every weekend has closed below 38.52. The weekend candle of 7 July is an important candle, apart from this this week's candle has also closed below the low of 14 July, which also indicates a down sign, over all a resistance zone is shown from 37.42 to 37.95. This pattern can go down to 34.1 or 33.67. But use a strict weekend Stop loss of 38.52.