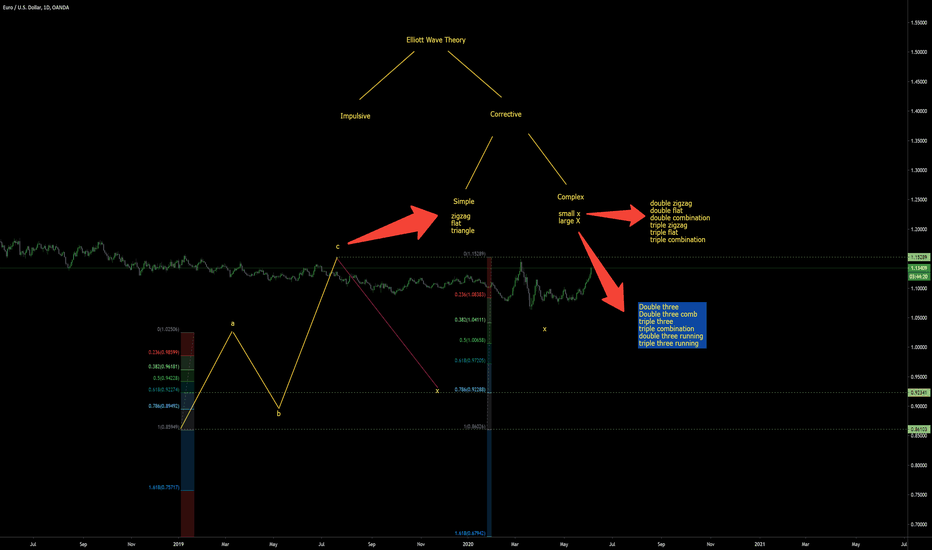
How to Count Elliott Waves Within 10 Seconds - Part 2 [ Wave 4 ]The question is How to Count Elliott Waves within 10 Seconds.
In this tutorial, you will learn how to identify wave 4.
We do not follow the traditional technique of counting waves on the price chart. We follow the Bill Williams concept of counting waves on the AO.
Building on Part 1 of this tutorial, we will now learn how to identify Wave 4.
part 1 is linked below.
The minimum requirement of Wave 4 is that AIMS Wave must create at least one bar of the opposite colour against the current Wave 3.
So before you identify wave 4, you must identify Wave 3.
Please HIT HIT THE LIKE button on the video above ... and ask any follow-up questions in the comments section below.
Wave Analysis
How to Count Elliott Waves Within 10 Seconds - Part 1 [ Wave 3 ]IN this tutorial I'm going to show you a fast and quick way to Count Elliott Waves within 10 Secondss
In this part 1 of the video I'm going to show you How to Identify Wave 3.
Ground Rule: Look for a the tallest PEAK on the AIMS Wave Histogram. That is Your WAVE 3.
Creating an Elliott Wave Count from Patterns (Qualcomm Example)In this video I tried to make an Elliott Wave count from identifying a pattern that can only occur in certain situations and made a plan moving on from there...
Do not ever Forget the content on all of our analysis are subject to change at any time without notice, and is provided for the sole purpose of assisting traders to make independent investment decisions.
Please support us to help more people..
How I Identify Key Trading Levels | Multi-Time Frame Semi-AnalyTradingView wouldn't let me be great. The title is supposed to say, "How I Idnetify Key Trading Levels | Multi-Time Frame Semi Analysis". :)
Now that we've gotten that out of the way...I put together a quick video showing how I mark up my charts on each Friday, Saturday, or Sunday.
I start from the top down and identify the obvious high and low point formations for that timeframe.
This helps me because, I know if price breaks through one of the levels, it is likely headed to the next key level.
This video is not for the purpose of giving my analysis on GU, **cough cough**, hence the reason I titled it "Semi-Analysis".
I hope this helps someone gain clarity in their trading journey.
I might do more videos, idk yet. I hate hearing my own voice, lol.
Thanks for coming along with me on my trading journey!
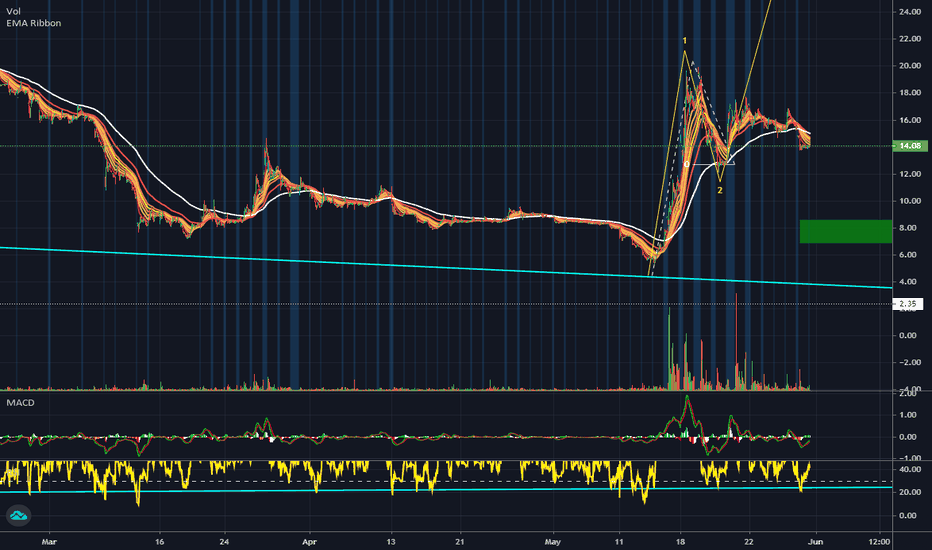
ACB Ema Ribbon strategy for beginnersIn this video i do small analysis on ACB and show how to setup and use the ema ribbon. this video is mostly for beginners. it's very basic and i tried to keep from going into too much detail with lots of trading terminology. please leave a like and share this video.
sometimes simpler is better and this tool can really help improve your wins. its a great tool to have.experiment with it and master it.
good luck guys and gals. if you have any questions or need help send me a private message or leave a comment below.
Understanding the Fibonacci retracement/Extension tool.I explained how to use the Fibonacci retracement/Extension tool on a trending market and how to key into the on-going trend to make massive profit from it also.
In an uptrend, you take the Fibonacci retracement tool from the Swing Low to the Swing High and in a Downtrend you take it from the Swing High to the Swing Low.
The most important ratios which i call "GOLDEN MEAN" are 50% & 61.8% Fib levels.
I will be showing how to plot this on the real chart in the next videos. Thanks.


