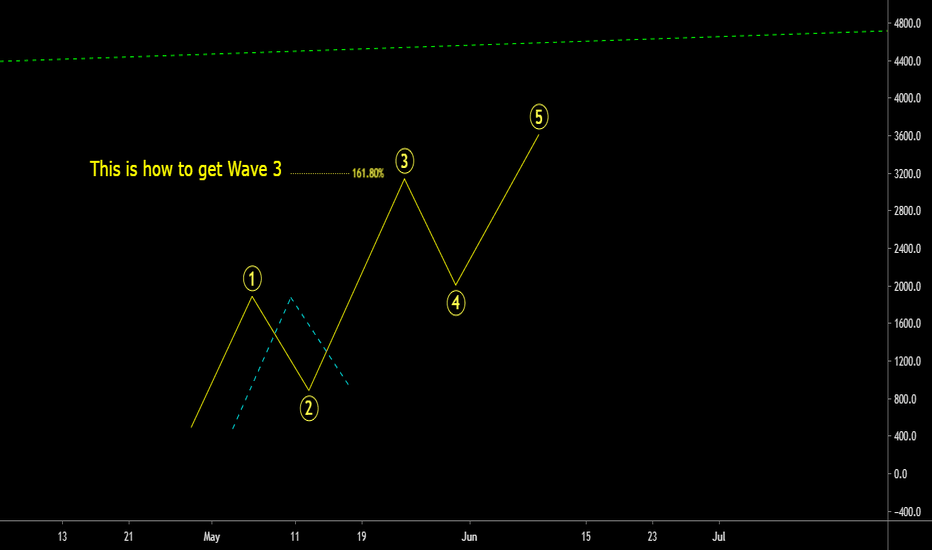
Wave Analysis
[$BTC] Video Education Ichimoku + Elliot Wave // 08.04.2020Bonjour à tous,
J'ai réalisé une vidéo de 10 min pour analyser le $BTC aujourd'hui 8 Avril 2020.
Pas mal d'éléments ont été évoqué :
- Résistances & Supports
- Ichimoku en Daily et H4
- Elliot Waves
Si vous avez des questions ou vous voulez en savoir, n'hésitez pas à me contacter en Message Privé.
Bon visionnage,
Stay Safe
PEACE !
Framing Your Chart Key to Understanding Behaviour - AMT exampleIn this video tutorial, I discuss how institutional traders and investors, "Frame a Chart"
Using AMT stock as an example working through multiple time frames and plotting channels and Linear Support & Resistance zones. Then using our Elliott Wave Indicator Suite to understand the behaviour of the current trend.
This method can be used on all asset classes and is part of my Daily routine
USDJPY Behaving well on this Bullish MoveYesterday I made a short video discussing how we were going to trade the USDPY currency pair using our Elliott Wave and Roller COaster Indicator Suites for the TradingView Platform. Link to yesterday video is >>HERE<<
This is a follow video to show how well this USDJPY Forex Pair is behaving and the resulting Long Trade that we are in!
elliot wave structure with fibonacci EDUCATIONALhey guys,
This video was intended to be a video analysis for NIO but quickly turned into a full blown elliot wave educational video for a follower of mine peterpecker. i go over fibonacci extensions and retracements and quickly on complex corrective structures and some rules as well. this is a quick look into elliot wave theory.
I didnt go over it in the video but you can also see how elliot wave with fibonacci targets actually build some of the chart patterns that we see, like the famous head and shoulders or the bull flag (seen in the complex corrective wxyxz structure i showed at the end).
its all about perspective. I hope this helps you in your trading adventures.
good luck and happy trading
Rigo
CSIQ - Swing Trading Stocks with Two Indicators for 1 YearQuick Video swingtrading stocks journal for the CSIQ Stockover a 1 Year period.
During the last 1 year period we have used the tradethefift Roller Coaster and ElliottWave Indicator suites for TradingView to swing Trade the CSIQ Stock.
There were 7 trades in Total and only one loser! In this example we use $1000 risk per trade and the Result is a $7450 profit.
Please watch the short video to learn a little bit more about these strategies.....
Analysis of Recent Winning 5th Wave Trade on GNRCOn October 15th 2019 we posted a trade idea on our TradingView Profile >>>HERE<<< for a potential 5th wave long swing trading opportunity on GNRC.
This video explains the subsequent bullish move to hit our original 5th wave target and then a further 5th wave swing trading opportunity. This is a great example of our Elliott Wave Indicator suite in action during strong trending moves on Stocks, but is also as effective on Forex,Futures, Commodities and crypto currencies.


