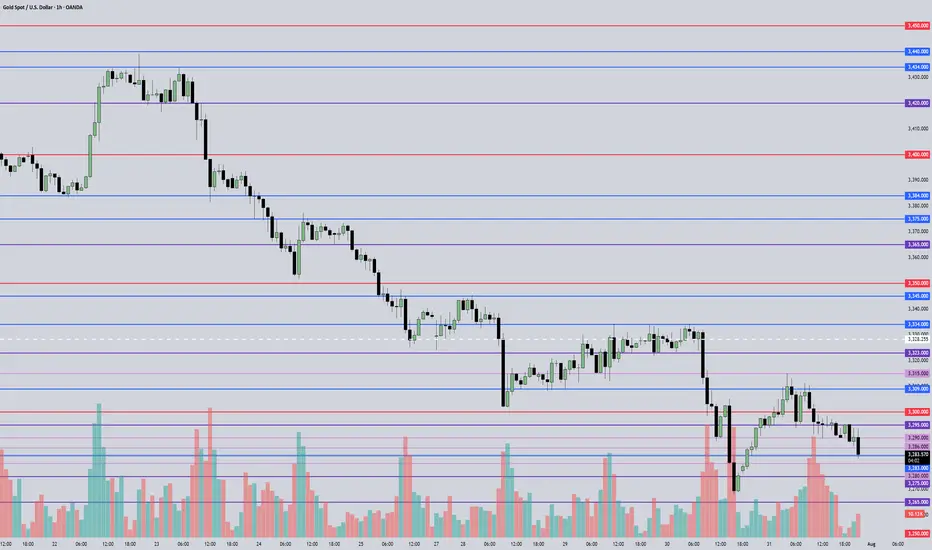
August 1, 2025 - XAUUSD GOLD Analysis and Potential Opportunity🔍 Key Levels to Watch:
• 3323 – Resistance
• 3309 – Resistance
• 3300 – Psychological level
• 3295 – Resistance
• 3283 – Key support
• 3268 – Short-term support
• 3260 – Support
• 3245 – Major support
• 3233 – Support
📈 Intraday Strategy:
• SELL if price breaks below 3283 → target 3280, then 3275, 3268, 3260
• BUY if price holds above 3286 → target 3289, then 3295, 3300, 3305
👉 If you find this helpful or traded using this plan, a like would mean a lot and keep me motivated. Thanks for the support!
Disclaimer: This is my personal view, not financial advice. Always use proper risk control.
Wave Analysis
ETH in a 1-5 patternEverythings is labeled on the chart of my theory and where I predict if this theory is valid following BTC's ATH and the Money Flow Cycle.
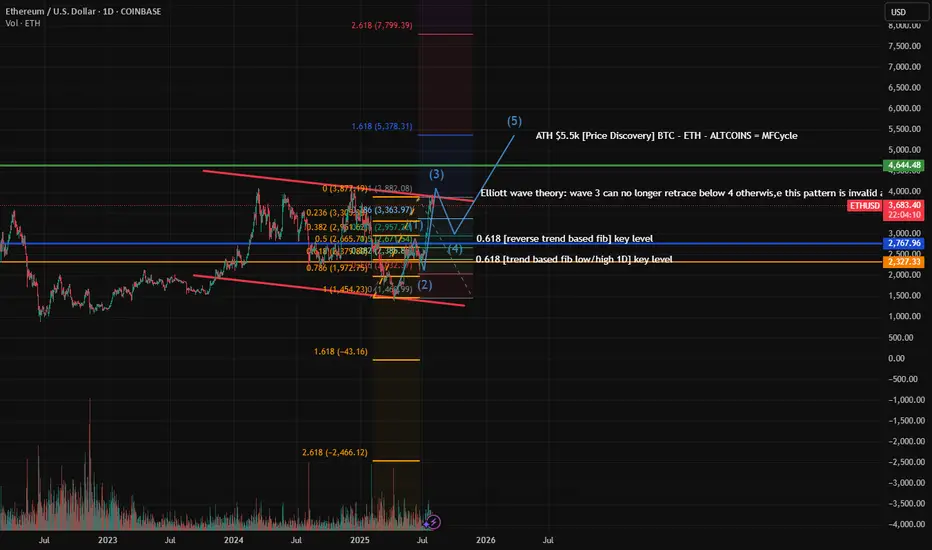
This is why I firmly believe we'll witness BTC reach 150K soon.No caption needed and every reasons are kept in the chart. Zoom In and analyze every single lines in the chart and hope you will see what I tend to see as far as my capabilities allows me. Let me know your comments on the idea. I am looking forward to witness $150K in the next 3 to 4 months time. I will be updating my confluences to say this on higher timeframes too.
With Regards. And stay Tuned.

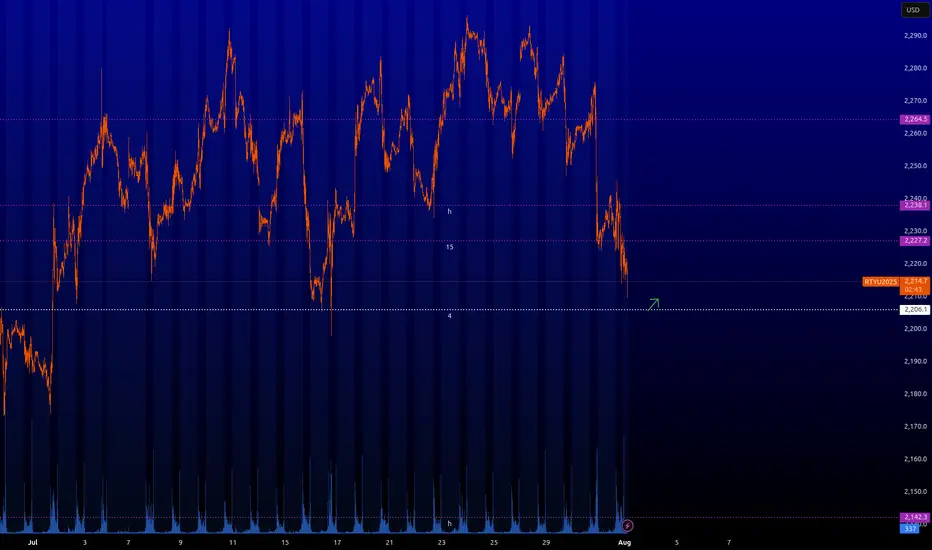
RTY : Key levelsHere are the key levels that the market will be interested in. From ~2.206 you can take scalping longs. Also interesting longing levels are forming now. I will let you know when they are formed and when they will be in play.
⚠️ VOLATILITY WARNING ⚠️
Trading around major news can be extremely unpredictable. Trade responsibly!

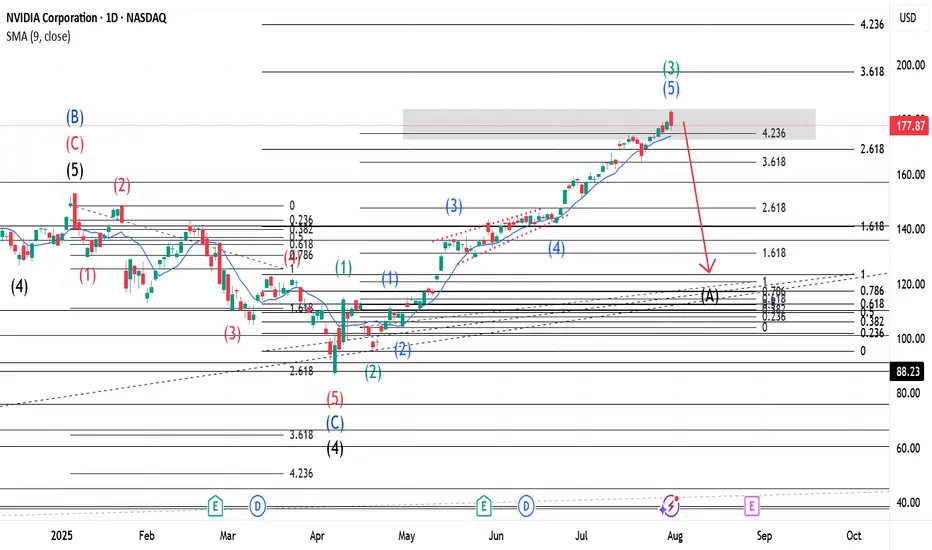
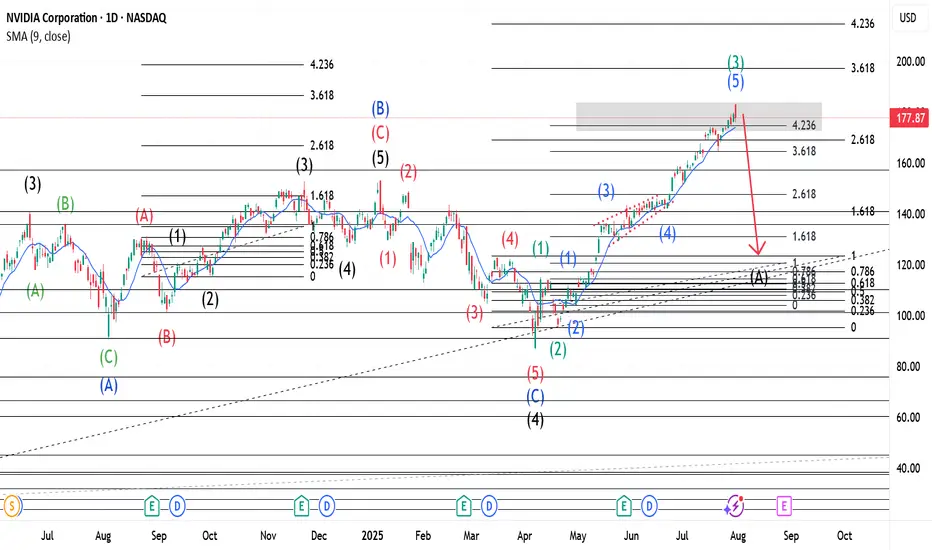
$NVDA ~ An Elliott Wave Breakdown.Earlier in the main wave, our Wave 2(Black) was a Zigzag hence a Flat was expected for Wave 4(Black). Wave B(Blue) closed beyond Wave 3(Black) and our Wave 4 made a 5 wave move(Shown in Red) that retested at the 261.8% Fib. level. With Wave C(Blue) complete, it was coined Wave 4(Black). Wave 5(Black) was launched and has a 5 wave move shown in Green. With a Zigzag for Wave 2(Green), a Flat should be expected for Wave 4(Green). Wave 3(Green) has 5 waves with a triangle for Wave 4(Blue). A confirmation at its current location(423.6% Fib. level) would mean that Wave 3(Green) is complete and a Wave A(Black) of the previously mentioned Flat should be anticipated. Please check my detailed breakdown for a broader perspective into the same.
NB: The placement of Wave A(Black) of the Flat mentioned above is purely for demonstrative purposes.
$NVDA ~ An Elliott Wave Breakdown.(Detailed Spectrum)Our Wave 2(Black) of the main wave was a Zigzag hence a Flat for Wave 4(Black). When Wave 3(Black) completed a three wave move, shown in Green, was made, hence A(Blue). Wave B(Blue) went beyond the end of 3(Black) and had 3 waves, shown in Red, also(as expected for Flats). The last of this 3 wave move(Wave c-Red) had 5 waves shown in Black. Upon completion, our Wave B(Blue) was over and we expected a Wave 4(Black). Our Wave 4 made a 5 wave move(Shown in Red) that retested at the 261.8% Fib. level. With Wave C(Blue) complete, it was coined Wave 4(Black). Wave 5(Black) was launched and has a 5 wave move shown in Green. With a Zigzag for Wave 2(Green), a Flat should be expected for Wave 4(Green). Wave 3(Green) has 5 waves with a triangle for Wave 4(Blue). A confirmation at its current location(423.6% Fib. level) would mean that Wave 3(Green) is complete and a Wave A(Black) of the previously mentioned Flat should be anticipated.
NB: The placement of Wave A(Black) of the Flat mentioned above is purely for demonstrative purposes.
ETH Reposition Play – VolanX DSS Sentiment Filter Active📉 ETH Reposition Play – VolanX DSS Sentiment Filter Active
🧠 VolanX DSS Triggered a Long Watchlist Signal
The ETH/USDT daily chart shows price stalling near the 0.786 Fib zone after a strong rally. Our proprietary DSS (Decision Support System) now monitors sentiment misalignment to prepare for the next institutional push.
🔍 Key DSS Observations:
Retail Sentiment: Fearful — retail bias flipped to short.
News Headlines: Negative — VADER sentiment ≈ –0.45.
Funding Rates: Flipped to negative across major exchanges.
Fear & Greed Index: 28 (deep fear zone).
📊 All 4 signals confirm contrarian long opportunity in “Reposition Zone” (≈ 3566–3280). Smart Money often absorbs panic exits before triggering the next leg.
🎯 DSS Strategy:
✅ Wait for confirmation at 3,280 or wick flush to 3,061.
📈 Potential upside target = 5,033 (1.618 Fib extension)
🛡️ DSS Sentiment Filter = ✔ Passed (4/4 bearish crowd indicators)
“When the crowd panics, liquidity positions. VolanX knows this.” – WaverVanir Protocol
📡 Signal monitored via VolanX Alpha Engine
🔒 Institutional tracking | AI-guided logic | DSS Probability Matrix
#ETH #Ethereum #Crypto #WaverVanir #VolanX #SmartMoney #SentimentTrading #AlphaProtocol #DSS #Reposition

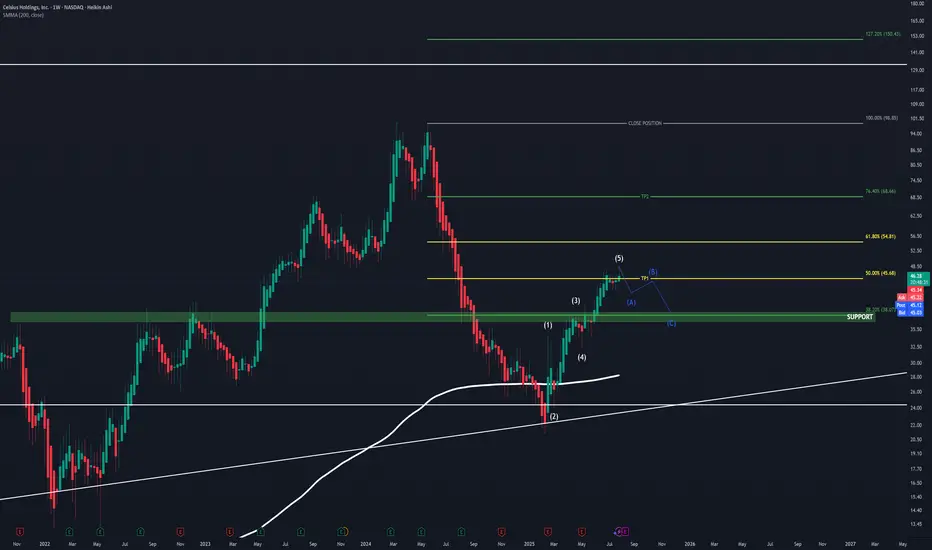
CELH UpdateAs mentioned in my old CELH post, I'm still holding.
On my new projections, assuming CELH is done for now due to it now testing the golden ratio 50.00% - 61.80% , a famous POI which more often than not results in a change in trend, and basing off of CELH's history, this area is respected.
So with this knowledge I have trimmed here, and I soon expect an ABC correction moving down to my level of support sitting at $38 , the 38.20% also sits here, which has also been proven to be a strong support level. If we find this level being tested, I will add back to my position and hold firm up toward $68.


WHO WILL WIN BITCOIN'S RANGE BATTLE? In this weeks analysis, Bitcoin has been stack in a tight range for almost two weeks now. Trading range between $115k and $120k. Trend is still holding up for Bullish continuation but indicators strongly cautions loud Sirens. A decisive daily close above $120,200 could be the winning whistle for Bullish Continuation, while I see selling pressure to continue to the Support Block of about 113k. Also the selling Volumes are huge but prices are always quickly absorbed suggesting an accumulation is happening more than a distribution. So my thesis for Bitcoin is sideways range bound until there is a clear market winner. I will be paying much attention to the bearish alarm and a breakdown will be confirmed when daily price decisively close below $115k confirming the divergences on the chart. Trading between the range is high risk.

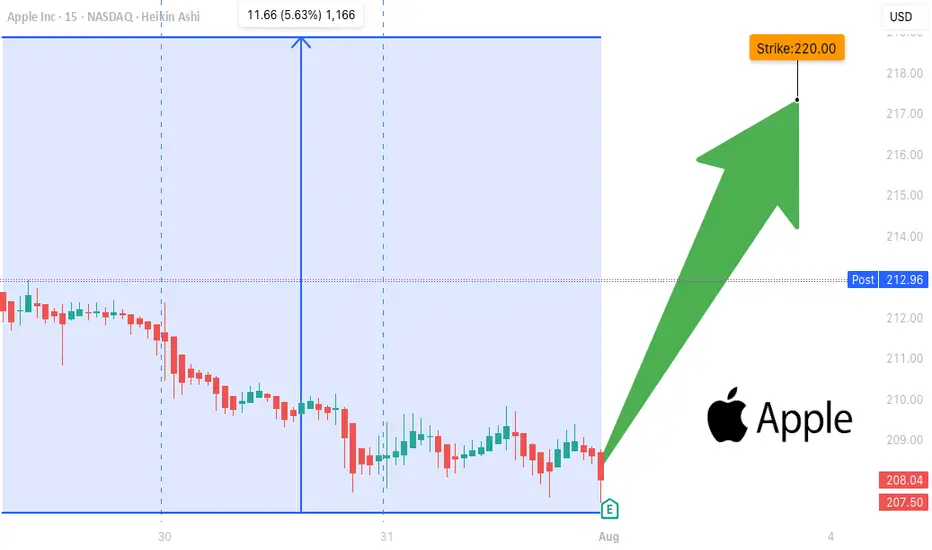
AAPL EARNINGS TRADE SIGNAL (JULY 31)
### 🍏 AAPL EARNINGS TRADE SIGNAL (JULY 31) 🚀
📊 **AAPL Call Play** — Earnings Strategy
🧠 Multi-model conviction: **75% Bullish Bias**
---
### 🔍 Fundamental Drivers
✅ TTM Revenue: +5.1%
✅ Gross Margin: 46.6%
✅ 8 straight earnings beats
⚠️ Sector shift: growth → value = caution
📉 TTM EPS Est: \$8.31 (+29.4% growth est.)
🧮 **Score**: 8/10
---
### 💰 Options Flow Breakdown
🔥 IV Rank: 0.70
🔵 Bullish OI @ \$220C = 25,950 contracts
🔻 Skew: Heavy puts @ \$197.5 / \$200
⚠️ Gamma squeeze possible near \$220
📈 **Score**: 8/10
---
### 📉 Technicals
📍 RSI: 39.3 (Oversold)
📉 Trading below 20DMA (\$211.64)
🟥 Low volume pre-earnings = low conviction
📌 Support: \$207.5 | Resistance: \$220
📉 **Score**: 6/10
---
### 🌐 Macro Setup
⚠️ Supply chain pressures
⚠️ Regulatory risk ongoing
🔄 Growth → Value rotation still underway
🌐 **Score**: 5/10
---
### 🧠 Trade Setup (Call Option)
* 🎯 **Strike**: \$220
* 💵 **Entry**: \$0.87
* 📅 **Expiry**: 08/01 (2DTE)
* 📈 **Target**: \$2.61
* 🛑 **Stop**: \$0.43
* ⚖️ **Risk**: 2% of portfolio
* ⏰ **Timing**: Enter before close, report after market
🧮 Expected Move: ±5.0%
🔒 Confidence Level: 75%
---
### ⚙️ Exit Plan
✅ Profit: Exit @ \$2.61
❌ Stop: Exit @ \$0.43
🕒 Time Exit: Force close within 2 hours post-earnings
---
📣 **EARNINGS SCALP PLAY**
— AAPL is oversold w/ strong EPS beat history
— Bullish OI stacking at \$220
— High gamma setup, low IV risk = 💥
\#AAPL #EarningsTrade #CallOption #TradingView #0DTE #OptionsFlow #GammaSqueeze #UnusualOptions #AppleEarnings #SwingTrade #TechStocks
SPX500 NEARING AN IMPORTANT FIB. EXTENSION RESISTANCEIn this weekend's analysis I find the SPX500 to remain BULLISH for next few days as we have strong closings outside the upper KC band and also touching the upper Bollinger band on the higher time frames from Daily to Monthly charts. It's also important to note that declining volume bars is NOT supporting the monthly rally, while MACD, RSI divergences are also sounding warning sirens that it's near a major correction territory which I have measure as the fib extension 0.618 from the October, 2022 base or support on the monthly chart. As signaled last week that we could be getting a capitulation candle soon to the fib target. Once we get a reversal candle on the 4 Hours it will confirm that the intermediate tops is achieved on the SPX500 and a correction is highly probable. So our trade thesis is Bullish until we get a confirmed bearish signal on either the 4H or 1D timeframe with Stop loss at 6377 level. Thanks for visiting my publication and trade idea on the SPX500. Cheers and happy trading to everyone.

First possible for SELL After a long buy price need a correction movement and it can be a sell order

Market Expectations for Gold (XAU/USD)Gold is currently in a very critical zone, and in my view, it has room to rise toward the 3339–3345 level.
Once that zone is touched, I expect another drop to follow.

Put your coats back on penguins. It's about to get chilly!Pudgy has been on a fishy bull run for the last 3 months racking up 230 percent. It's time to chill out a bit while traders take some profit. Here is a great setup for a 14 percent short entry.
Price action is currently sitting slightly below support levels of .036. There are currently (2) 4 hour candles closed below the support zone indicating price action will likely slide into the lower support zone as marked on the chart. Price may break above the .036 resistance level into the small support zone of around ~.038. Make sure to set your stop loss slightly above this time so you are not in the liquidity zone if the bulls push back.

ton/usdt clear bullsih pattren dyor HERE u can get lot of help from here
TON/USDT a graphically bullish chart pattern and fundamentals are good
long term hodl good and futures 2-4x lev is enough for entire cucle here we can see a 70% potential in this
dis: im not finanicail advisor

fart long entry soon as per analysisits not afinancial advice #dyor
evry thiong is mentioned on chart as u can see clearly
and this is strongly bullish until turn this below order block to breaker blok with heavy volume
