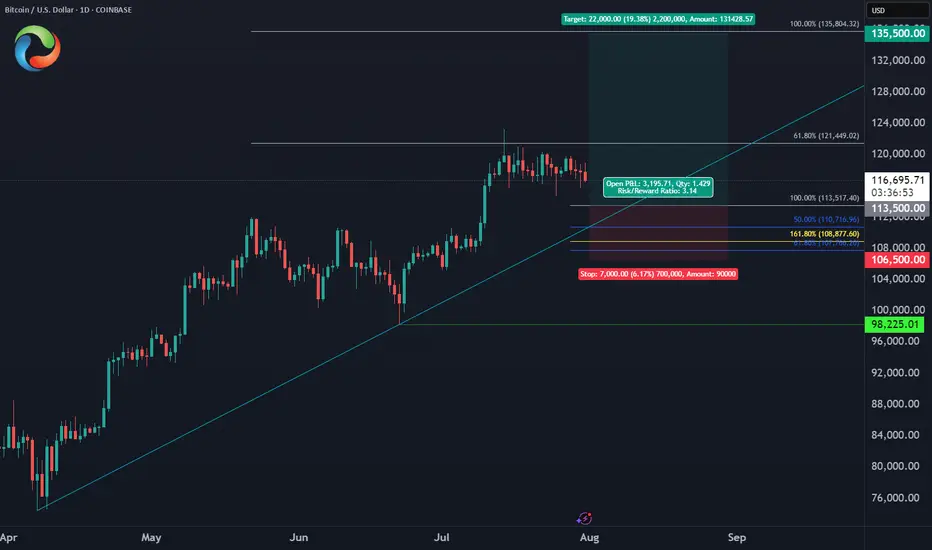
Bitcoin August Trade PlanBINANCE:BTCUSD
✅Entry Zone: $113,500 - $110,700
⛔️Stop: $106,500 (below June low)
🎯Target: $135,500 (ATH liquidity)
🔖Risk/Reward: 1:3
Wave Analysis
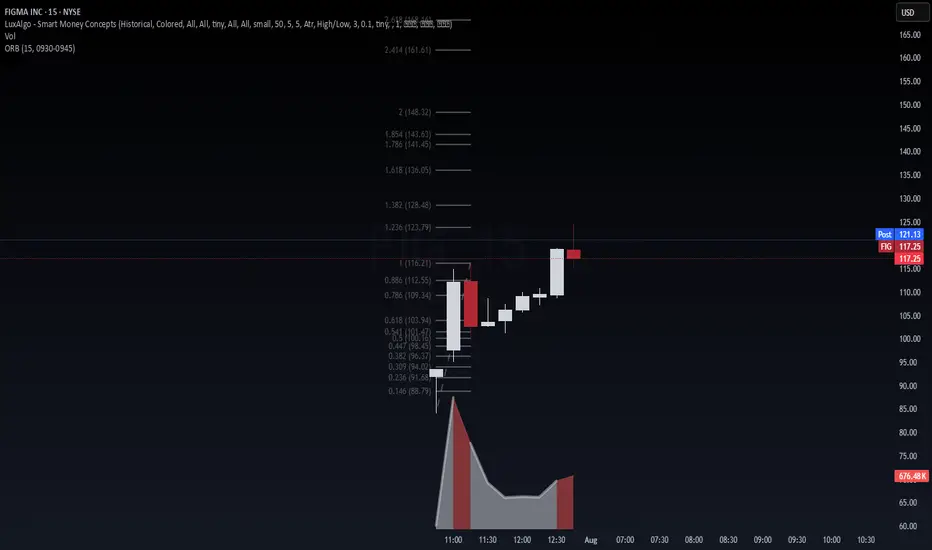
FIGMA INC. (FIG) – IPO Day Momentum + AI Design Wave📈 FIGMA INC. (FIG) – IPO Day Momentum + AI Design Wave
Figma just launched its IPO at $33/share, raising over $1.2B with intense demand (reportedly 40× oversubscribed). The stock opened explosively around $85 and surged past $115 within hours—marking one of the strongest SaaS IPOs in recent memory.
This debut is powered by:
The failed $20B Adobe acquisition (2023), which boosted Figma’s independence and cash position via a ~$1B break-up fee.
Accelerated AI integration: new tools like Figma Make, Draw, and Buzz debuted at Config 2025, reinforcing its leadership in collaborative design.
A rebound in tech valuations and strong market timing for IPOs, with Figma now positioned as a bellwether for high-growth SaaS.
🔍 Technical View (15-min chart):
After the opening range breakout (0930–0945), price cleanly moved through the 0.618 and 1.00 Fibonacci levels. FIG is now hovering near 1.236 ($123.79) with next key extension at 1.382 ($128.48). Volume confirms sustained interest. A hold above $116 signals strength. Watch for:
Breakout continuation above $123.79 → $128.50
Retest of VWAP/Fib levels ($112–$109) for re-entry
Lock-up risk, but low near-term float = volatile upside
🎯 Thesis: This is institutional-grade price action backed by AI momentum, macro timing, and a clean technical base. Trade the trend, not the headline.
#FIG #IPO #AI #SaaS #Breakout #Fibonacci #VolanX #WaverVanir #TradingStrategy #MacroSignals
CADJPY Will Keep Growing!
HI,Traders !
#CADJPY keep growing and
The pair made a bullish breakout
Of the key horizontal level
Of 108.198 and the pair is
Already retesting the new
Support and we will be
Expecting a further
Bullish move uP !
Comment and subscribe to help us grow !

US30 Bearish Breakout!
HI,Traders !
#US30 made a bearish
Breakout of the key horizontal
Level of 44822.3which also
Seems to have been a neckline
Of the small H&S pattern so
We are locally bearish biased
And we will be expecting a
Further bearish move down !
Comment and subscribe to help us grow !

i confuse !!!i see bearish engulfing candle stick in weekly time frame what is going on a big retracement await of just trick us???!!

USDJPY I Technical and Fundamental Analysis Welcome back! Let me know your thoughts in the comments!
** USDJPY Analysis - Listen to video!
We recommend that you keep this on your watchlist and enter when the entry criteria of your strategy is met.
Please support this idea with a LIKE and COMMENT if you find it useful and Click "Follow" on our profile if you'd like these trade ideas delivered straight to your email in the future.
Thanks for your continued support!

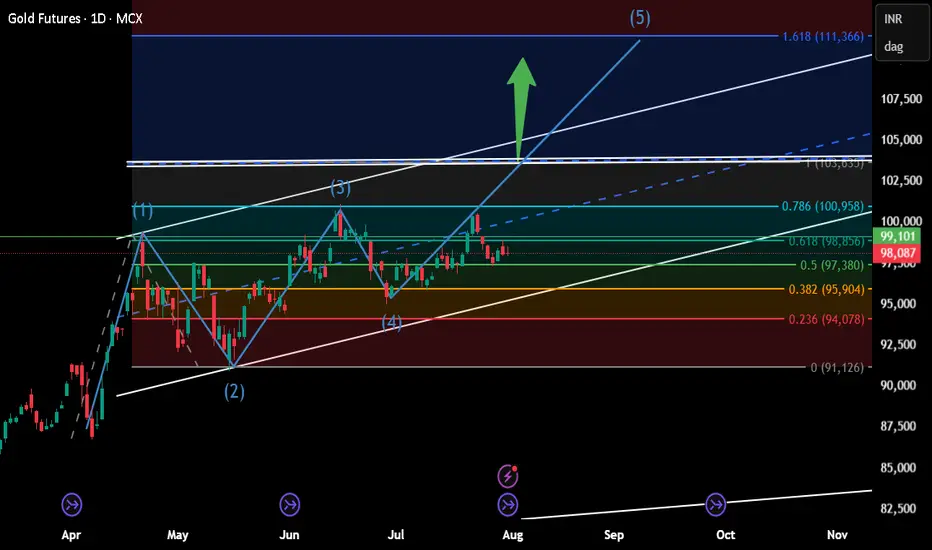
Bitcoin Elliot Wave CountBullish for the next 90 days
Blow off top thesis
Pump into rate cuts and Big Beautiful Bill.

$ADA Macro ThesisGD To all
I have cleaned up and thrown a few other correlated patterns on the Chart for my Macro thesis.
You will have to watch the metrics and on chain data as well as sentiment to verify as we move fwd.
This is Pattern recognition on a Log Chart:
BINANCE:ADAUSD
I have been using this thesis since 2019 and have been able to successfully ident general buy/sell points ( weighing against real world events and on chain data )
I hope it helps you and feel free to ask questions.
Told ya I like crayons

Xrp - It all comes down to this!🚀Xrp ( CRYPTO:XRPUSD ) has to break structure:
🔎Analysis summary:
After Xrp created the previous all time high in 2018, we have been seeing a consolidation ever since. With the recent all time high retest however, Xrp is clearly showing some considerable strength. It all comes down to bulls being able to push price higher, above the massive horizontal structure.
📝Levels to watch:
$3.0
SwingTraderPhil
SwingTrading.Simplified. | Investing.Simplified. | #LONGTERMVISION

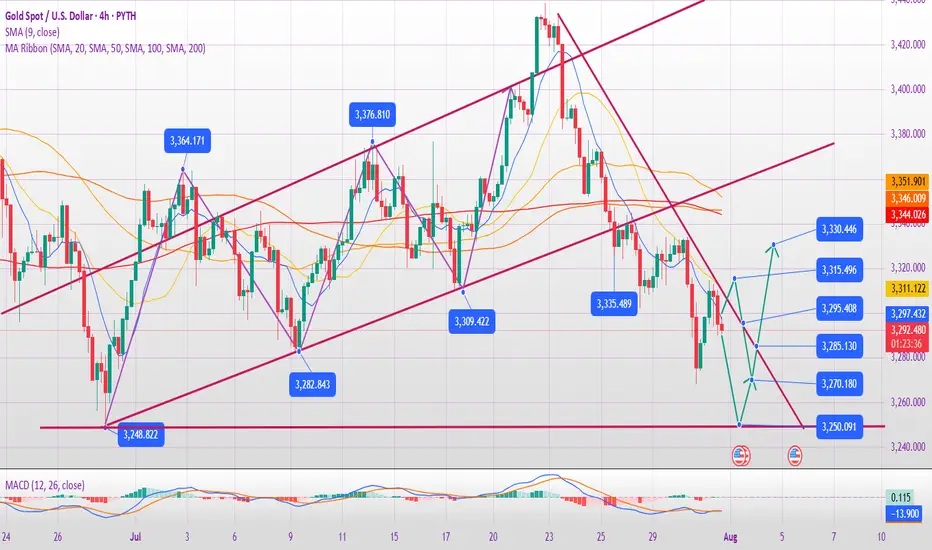
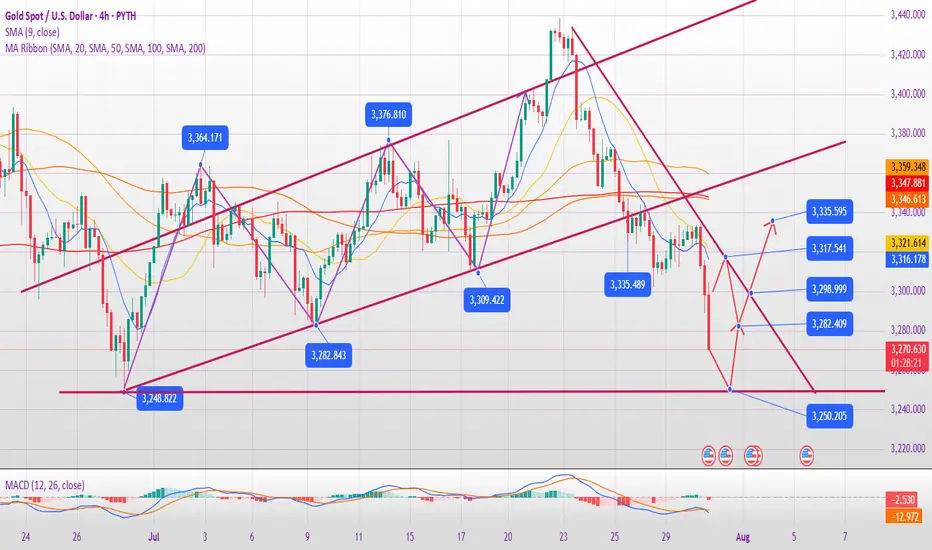
Will gold prices continue to fall on August 1st?
Core Logic Analysis
Negative factors dominate
The Federal Reserve's hawkish stance: keeping interest rates unchanged and Powell suppressing expectations of a rate cut have weakened gold's safe-haven appeal.
Strong economic data: ADP employment data exceeded expectations, and coupled with the upcoming PCE and non-farm payroll data, market expectations of an early Fed rate cut have cooled.
Technical Breakdown: Gold prices fell below the key support level of $3,300, hitting a new monthly low. A large weekly bearish candlestick chart indicates bearish dominance.
Key Support and Resistance
Resistance: 3315 (hourly rebound resistance), 3333 (previous high and daily resistance).
Support: 3280-3290 (short-term), 3250-3245 (strong monthly support).
Potential Risks
Unexpectedly weak non-farm payroll data or escalating geopolitical tensions could trigger a short-term rebound, but a break above 3330 is required to reverse the downward trend.
Today's Trading Strategy
Short-Term Trading
Primarily short at highs: Short lightly on a rebound to 3310-3315, stop loss at 3325, target 3290-3280.
Aggressive Short: Add to short positions if the price reaches 3330-3333, stop loss at 3340, target 3280.
Cautious Long: Try a long position on the first touch of 3250-3245, stop loss at 3235, target 3270-3280 (quick in and out).
Mid-term Strategy
If the monthly line closes below 3250, shorting at high levels can be continued in August, targeting the 3150-3100 range.
If the gold price rebounds above 3350 after the non-farm payrolls, the trend needs to be reassessed.
Events to Watch
Data:
Non-farm payroll report on Friday (if the data exceeds expectations, gold prices may fall further).
US June PCE Price Index (Federal Reserve inflation indicator).
Technical Signal:
A daily close below 3250 would confirm a medium-term downtrend.
Observe the recapture of the 3300 level, which serves as a dividing line between bulls and bears.
Summary
Gold is currently in a bearish phase. Prioritize shorting on rallies, but be wary of unexpected data fluctuations. If the mid-line breaks below 3250, the market could target the 3000-3100 range. Conversely, if it holds above 3330, strategy adjustments will be necessary. Strictly stop loss and control risks.
Hood 5th wave looks toppyHood is one of my larger holdings and I have been riding the wave waiting for a pullback for months. I believe the time is now. This is chart I posted elsewhere that I forgot to share here. I think 65$ is a real possibility. The last four pullbacks were all over 40%. Not the stochastic monthly is starting divergence and the BBWP has remained elevated for a long time.
My plan:
Sit on my shares.
Close my covered calls into 2027 if we dump a lot
Buy zone between 65-75$

Will gold bottom out and rebound on July 31st?
1. Key News Drivers
Federal Reserve Policy Expectations: The market generally expects the Fed to maintain a hawkish stance. If economic data (such as ADP, GDP, and PCE) show strong performance, the expected rate cut may be further postponed, which is bearish for gold.
Geopolitics and Risk Aversion: Uncertainty in the US-China trade negotiations and the situation in the Middle East may temporarily support gold prices, but the market is currently more focused on macroeconomic data.
Dollar Trend: If the US dollar index continues to strengthen (driven by expectations of a Fed rate hike), it will suppress gold's rebound potential.
2. Key Technical Signals
Trend Break Confirmation:
The daily chart shows four consecutive declines below the 60-day moving average and the rising trend line, confirming a mid-term correction following the 3439 high.
The next key support is 3245 (previous low). If it falls below this, the price could drop to 3150-3120.
Short-term oversold rebound demand:
The RSI entered the oversold zone, and a technical rebound may occur.
Key rebound resistance level:
3315-3325 (near yesterday's high, short-term short position entry area)
3345-3350 (bull-bear watershed, strong resistance area)
3380-3400 (trend reversal confirmation point, ideal layout position for medium-term short positions)
3. Today's operation strategy
(1) Short-term trading (intraday)
Mainly high-short:
Rebound to 3315-3325, light position short test, stop loss 3335, target 3280-3270.
If it touches 3345-3350, you can add short positions, stop loss 3360, target 3300-3280.
Dip-buying strategy (caution):
If the price stabilizes after a pullback to 3280-3270, short-term buying is recommended, with a stop-loss at 3260 and a target of 3300-3310 (quick entry and exit).
4. Key Risks
Federal Reserve Policy Shift: If the Fed unexpectedly releases dovish signals (such as hinting at a rate cut), it could trigger a rapid rebound in gold prices.
Unfortunate Economic Data: If US GDP, PCE, and other data fall short of expectations, it could boost gold prices in the short term, but after the rebound, it will still be an opportunity to buy higher.
Escalating Geopolitical Conflict: If a major risk event occurs (such as a escalation in the Sino-US trade war), it could temporarily boost safe-haven buying.
Summary
Short-Term: Oversold rebounds may provide opportunities to sell high, with attention to resistance at 3315-3325 and 3345-3350.
Medium-Term: The trend remains bearish, with a target of 3245 to 3150. Any upward movement is considered an opportunity to enter a short position. Trading strategy: Mainly short on rebound, be cautious when buying long orders on rebound, and strictly set stop-loss to prevent unexpected fluctuations.
Ethereum Quick Outlook – Potential Trap Before Drop?ETH is moving within a rising channel, but momentum is fading. Price failed to break above the midline and is now testing lower support.
A fakeout to the upside toward the $4,015–$4,050 supply zone is possible before a deeper drop. The projected path suggests a short-term bounce, final liquidity sweep, then potential reversal.
🟡 Key Resistance: $4,015
🔻 Breakdown trigger: Below $3,620
🎯 Bearish Targets: $3,250 → $3,100
Structure hints at a possible Ending Diagonal (Neowave), or a Trap-Wave E inside a Complex Correction.
⚠️ Watch for manipulation near highs – confirmation needed for short entry.

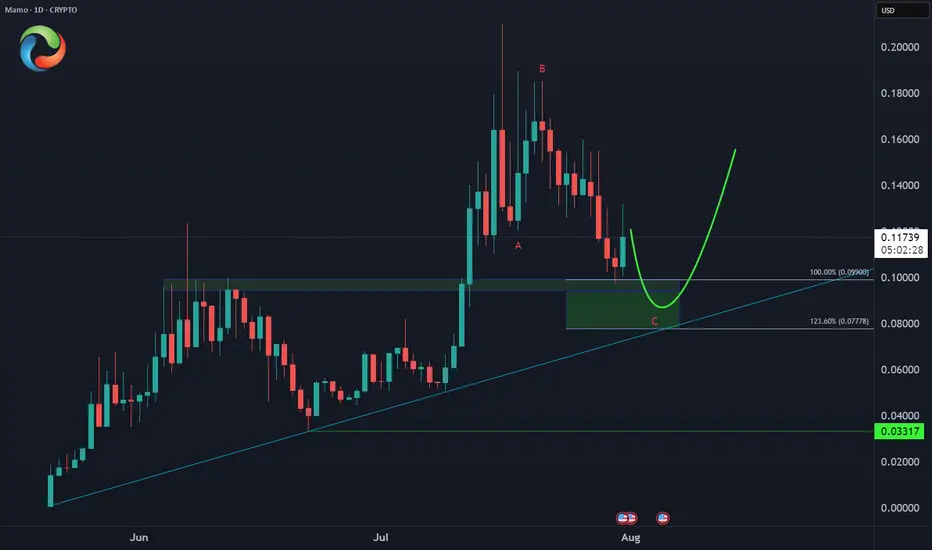
MAMO Buying Opportunity🤑 CRYPTO:MAMOUSD did 3 waves pullback into extreme area $0.099 - $0.077 and as long as it holds the trendline from May low then Bulls will be looking for more upside to take place from here!
EURAUD Long TradeOANDA:EURAUD Long trade, with my back testing of this strategy, it hits multiple possible take profits, manage your position accordingly.
TP-1 is high probability.
This is good trade, don't overload your risk like greedy, be disciplined trader, this is good trade.
Use proper risk management
Looks like good trade.
Lets monitor.
Use proper risk management.
Disclaimer: only idea, not advice

TRXUSDT Long SwingBINANCE:TRXUSDT Long Swing Trade, with my back testing of this strategy, it hits multiple possible take profits, manage your position accordingly.
This is good trade, don't overload your risk like greedy, be disciplined trader.
I manage trade on daily basis.
Use proper risk management
Looks like good trade.
Lets monitor.
Use proper risk management.
Disclaimer: only idea, not advice

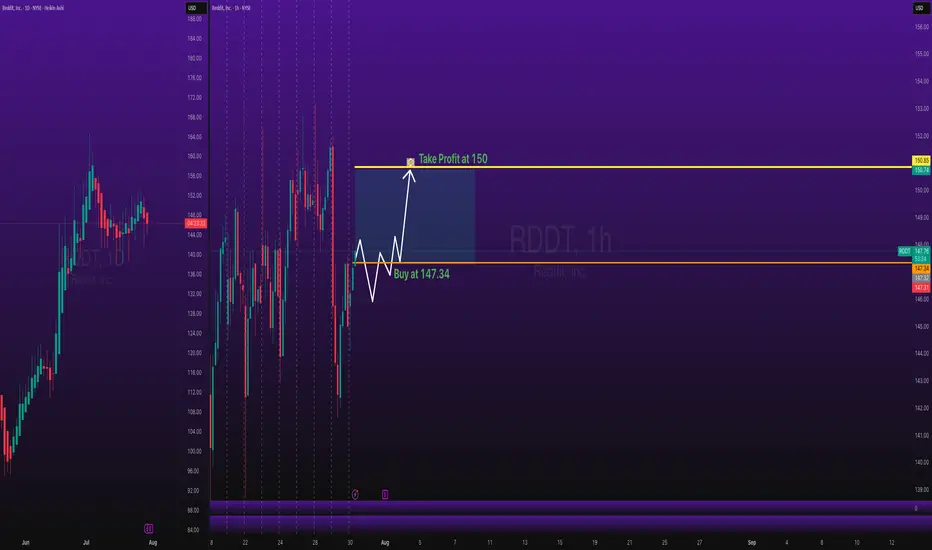
Stocks SPOT ACCOUNT: Reddit stocks BUT ENTRY with TAKE PROFITStocks SPOT ACCOUNT: NYSE:RDDT stocks my buy trade with take profit.
This is my SPOT Accounts for Stocks Portfolio.
Trade shows my Buying and Take Profit Level.
Spot account doesn't need SL because its stocks buying account.
Bottom Feeding - Opportunity?Adobe is sitting on two areas of support - an 11 year old trendline and the 0.786 Fibonacci. It looks like it's coiling up in a giant triangle. This is a steadily growing business with a very sticky product suite. Whilst everyone is falling over themselves to buy Figma at $110, I think it's time to start paying attention to Adobe here.
I believe the AI fear is overdone, if you look at the continued growth in Adobe, their cash flow and continued growth, this is definitely the more compelling buy out of the two. If we lost the trendline support and Fibonacci support, things could indeed get worse.
Not financial advice.

ZORA 5-Wave Completion — 30% Crash Incoming?After exploding +1150% in just 20 days and completing all 5 waves, ZORA is now consolidating — trading sideways just under the $0.10 psychological level for the past 4 days.
📉 Current Market Structure
The current structure shows signs of a developing Head & Shoulders pattern, with price:
Trading below the daily open (dOpen) and weekly open (wOpen) → Bearish signs
Hovering near the prior daily open (pdOpen) → a breakdown here would confirm bearish continuation
🔴 Short Setup - Bearish Scenario
If ZORA breaks below pdOpen, we’re likely heading for:
0.618 Fib retracement at $0.06137 of the final wave 5
Confluence with 1.272 Trend-Based Fib Extension (TBFE) at $0.06148
This zone marks the next high-probability reaction point and a potential long opportunity if price shows a bounce or reversal.
📉 Overall Short Trade Target
The full retracement target sits between $0.0529 and $0.0514, offering multiple layers of confluence:
0.5 Fib retracement of the full 1150% move
0.786 Fib retracement of the final wave 5
Aligned with an old trading range and daily level
This makes it an ideal demand zone for patient bulls but only once price confirms.
💡 Educational Insight
This setup highlights an example of Elliott Wave Theory in action — after a strong 5-wave impulse move, markets often enter a corrective phase. The completion of wave 5, especially near key psychological levels like $0.10, often marks a local top, where price corrects toward key Fibonacci retracement zones.
Combining wave structure with confluence factors like Fib levels, VWAP, and prior trading ranges helps traders identify high-probability reversal zones — allowing for better timing, risk management, and trade planning. Always wait for confirmation before jumping into any trades.
Summary
Bearish continuation confirmed on pdOpen breakdown
First support zone: $0.0613–$0.0614
Final downside target: $0.0529–$0.0514
Look for long opportunities only on reaction + confirmation
_________________________________
💬 If you found this helpful, drop a like and comment!
Want breakdowns of other charts? Leave your requests below.

Price Doing Exactly What We Predicted… so farGBPUSD tapped the exact bottom of our marked channel and bounced — just as forecasted.
📌 Price respected structure to the pip
📌 Stoch RSI curling up right as expected
📌 Channel still in play, eyes on midline next
⏱️ Timeframe: 1H
#gbpusd #forex #chartprediction #backtest #channeltrading #technicalanalysis #tradingview

CHFJPY: Bearish Continuation is Expected! Here is Why
The price of CHFJPY will most likely collapse soon enough, due to the supply beginning to exceed demand which we can see by looking at the chart of the pair.
Disclosure: I am part of Trade Nation's Influencer program and receive a monthly fee for using their TradingView charts in my analysis.
❤️ Please, support our work with like & comment! ❤️

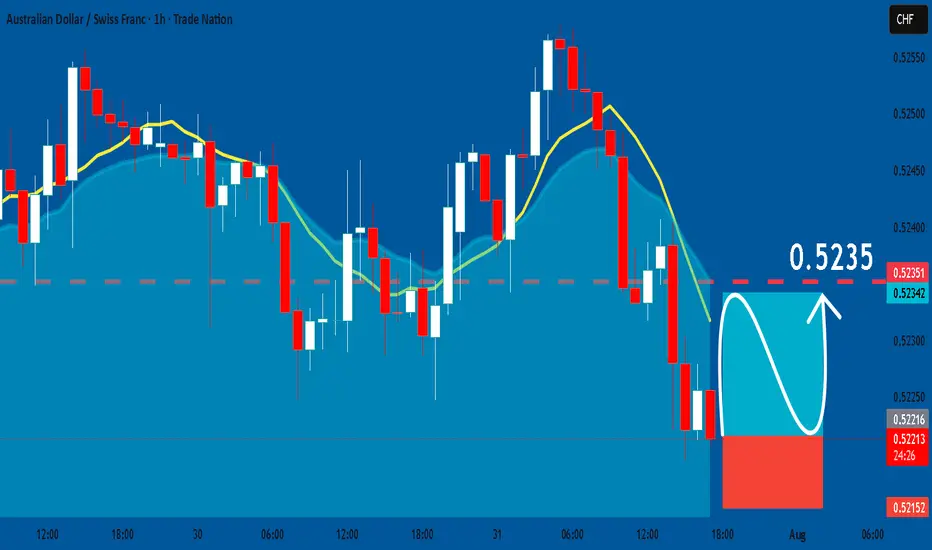
AUDCHF: Bullish Continuation & Long Signal
AUDCHF
- Classic bullish formation
- Our team expects pullback
SUGGESTED TRADE:
Swing Trade
Long AUDCHF
Entry - 0.5221
Sl - 0.5215
Tp - 0.5235
Our Risk - 1%
Start protection of your profits from lower levels
Disclosure: I am part of Trade Nation's Influencer program and receive a monthly fee for using their TradingView charts in my analysis.
❤️ Please, support our work with like & comment! ❤️