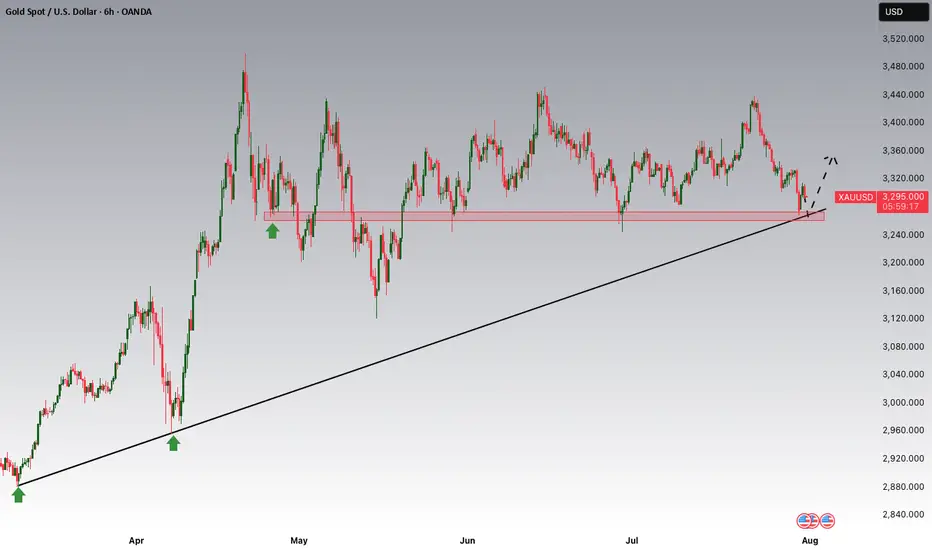
GOLD Local Short! Sell!
Hello,Traders!
GOLD made a retest
Of the horizontal resistance
Of 3313$ and we are already
Seeing a bearish reaction and
We will be expecting a further
Bearish move down
Sell!
Comment and subscribe to help us grow!
Check out other forecasts below too!
Disclosure: I am part of Trade Nation's Influencer program and receive a monthly fee for using their TradingView charts in my analysis.
Wave Analysis

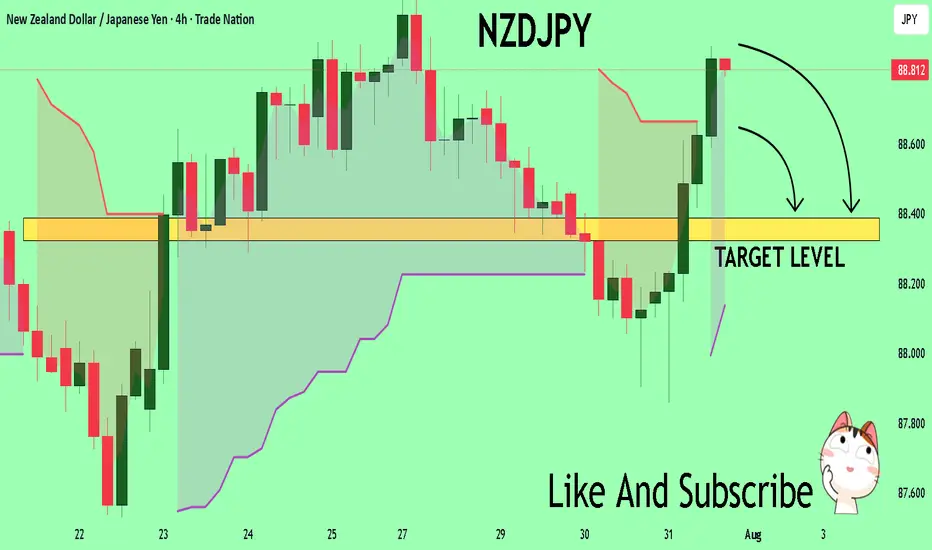
NZDJPY The Target Is DOWN! SELL!
My dear friends,
Please, find my technical outlook for NZDJPY below:
The price is coiling around a solid key level - 88.806
Bias - Bearish
Technical Indicators: Pivot Points Low anticipates a potential price reversal.
Super trend shows a clear sell, giving a perfect indicators' convergence.
Goal - 88.388
About Used Indicators:
The pivot point itself is simply the average of the high, low and closing prices from the previous trading day.
Disclosure: I am part of Trade Nation's Influencer program and receive a monthly fee for using their TradingView charts in my analysis.
———————————
WISH YOU ALL LUCK
#GBPUSD ALMAZOV PROJECTION DAILYPrice projection according to Almazov's theory, #GBPUSD should at least touch $1.31500 - before going up, we wait for the initial condition to enter a long position, to reach the Daily Spike f 261.8.

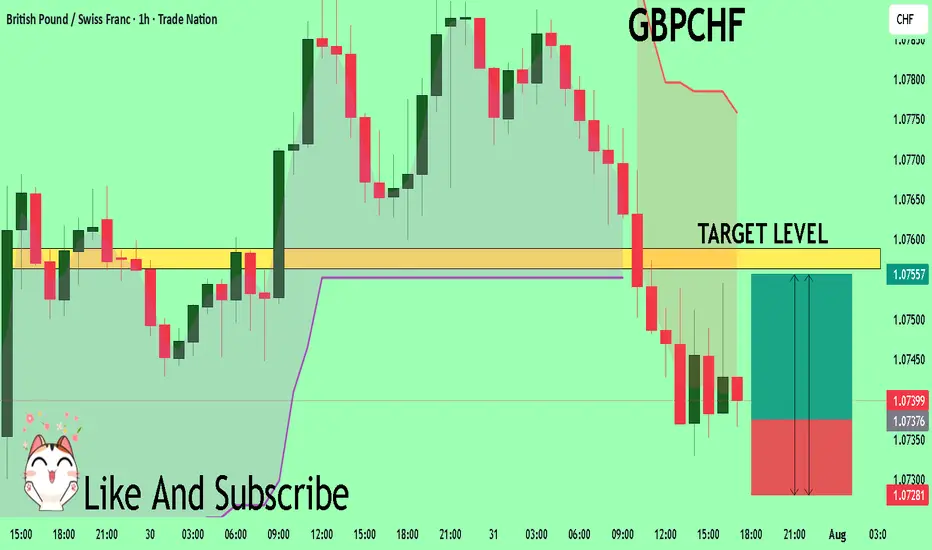
GBPCHF Trading Opportunity! BUY!
My dear followers,
This is my opinion on the GBPCHF next move:
The asset is approaching an important pivot point 1.0737
Bias - Bullish
Safe Stop Loss - 1.0728
Technical Indicators: Supper Trend generates a clear long signal while Pivot Point HL is currently determining the overall Bullish trend of the market.
Goal - 1.0756
About Used Indicators:
For more efficient signals, super-trend is used in combination with other indicators like Pivot Points.
Disclosure: I am part of Trade Nation's Influencer program and receive a monthly fee for using their TradingView charts in my analysis.
———————————
WISH YOU ALL LUCK
AUD-USD Will Go Down! Sell!
Hello,Traders!
AUD-USD is trading in a
Downtrend and the pair
Broke the key horizontal
Level of 0.6470 which is
Now a resistance then
Made a retest and a
Confident pullback which
Reinforces our bearish
Bias and makes us expect
A further bearish move down
Sell!
Comment and subscribe to help us grow!
Check out other forecasts below too!
Disclosure: I am part of Trade Nation's Influencer program and receive a monthly fee for using their TradingView charts in my analysis.

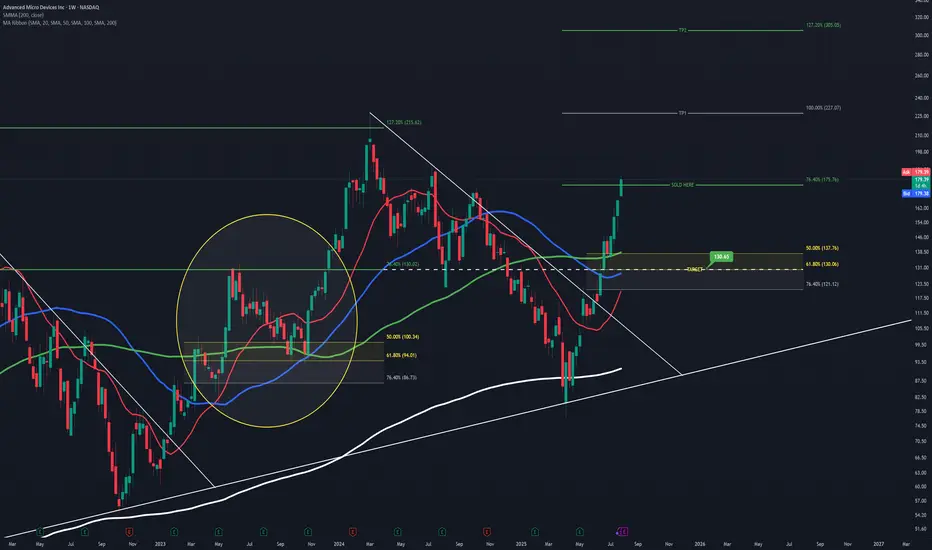
AMD Projection and Entry PointThis is speculation just like before, which played out very well so this is me having another shot at it.
Going off of the prior cycle AMD went through and comparing it to the one it's currently in, you can see a lot of similarities.
Learning from it's past and seeing how it likes to react to certain Fib levels, you can see that the 76.40% has been respected as a major level of resistance which resulted in its short retracement back in June '23 , It also acts as a very strong level of support as shown in August '24.
Assuming AMD rejects at the current 76.40% level again, using the prior 76.40% you can see it aligns perfectly with the golden ratio I have setup as my buy entry.
It all lines up too perfectly that in my mind, I'm certain it will play out. But of course it's all speculation, and the markets do as they please.
EUR-USD Bearish Breakout! Sell!
Hello,Traders!
EUR-USD made a bearish
Breakout of the key horizontal
Level of 1.1460 then made
A retest and a pullback so
We are bearish biased and
We will be expecting a
Further bearish continuation
Sell!
Comment and subscribe to help us grow!
Check out other forecasts below too!
Disclosure: I am part of Trade Nation's Influencer program and receive a monthly fee for using their TradingView charts in my analysis.

#COPPER #MCX View as on 31st JulyMCX:COPPER1! Copper MCX if it doesnot make one more swing higher then the rally should correct all the way. Alternate is it could be doing a triangle and then make new high.

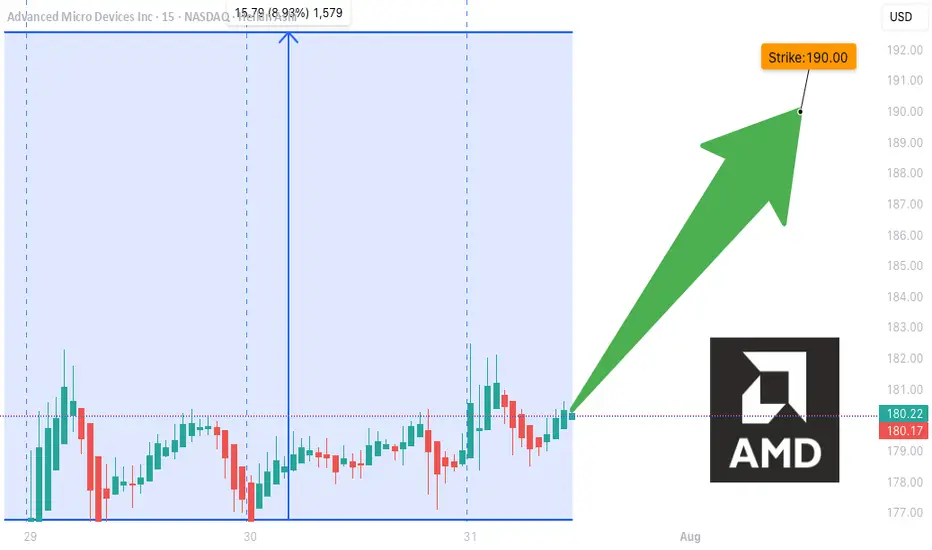
AMD WEEKLY TRADE SIGNAL (7/31/25)
### 🚀 AMD WEEKLY TRADE SIGNAL (7/31/25)
📈 **MARKET SNAPSHOT**
🟢 Daily RSI: **86.0** 🔥
🟢 Weekly RSI: **80.4**
📊 Volume: 🔺 1.5x (Institutional surge)
💬 Call/Put Ratio: **1.90**
🌪 Gamma Risk: **HIGH (1DTE)**
🧠 Sentiment: **Extremely Bullish** across all models
---
💥 **TRADE IDEA**
📍 Ticker: **\ NASDAQ:AMD **
📈 Direction: **CALL (LONG)**
🎯 Strike: **\$190.00**
💵 Entry: **\$0.51**
🎯 Target: **\$0.90** (+75%)
🛑 Stop Loss: **\$0.30**
📆 Expiry: **Aug 1 (Friday)**
📊 Confidence: **85%**
⏰ Entry: Market Open (Time-sensitive!)
---
🧠 **STRATEGY CONTEXT**
✅ Bullish momentum from AI sector hype
✅ Institutional call buying volume spiking
⚠️ 1DTE = High Gamma Risk = TRADE FAST OR DON’T TRADE
⚠️ Manage decay & exit early if momentum stalls
---
📌 Signal Posted: 2025-07-31 @ 12:17 PM ET
\#AMD #OptionsAlert #AITrade #WeeklyOptions #TradingViewViral #1DTE #GammaSqueeze
gbpnzdGBP/NZD – Set to Breakdown. Forex Strategy is Bearish: GBP/NZD is currently at 2.2479 in a range. With this breakout, we are looking for a small pullback ..
sl
down support

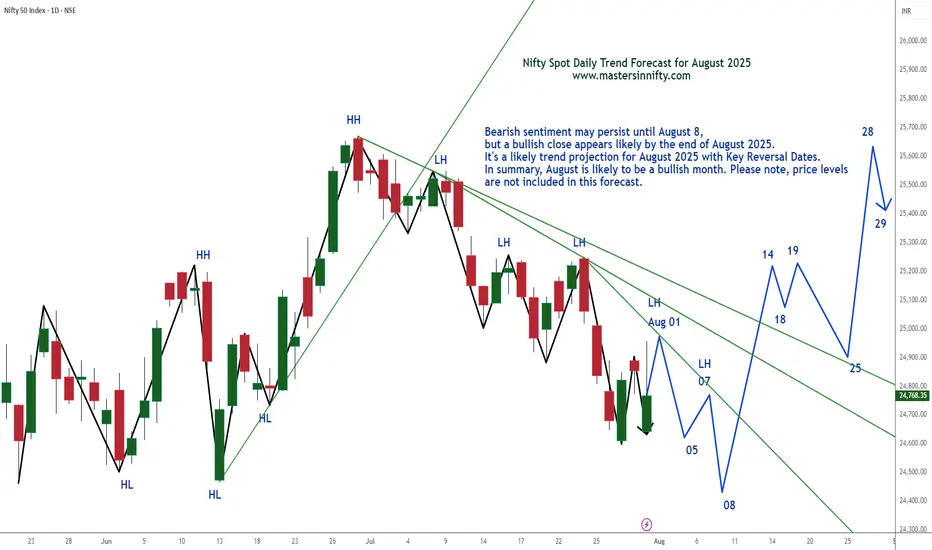
Nifty Spot Index Projection Line for August 2025Bearish sentiment may persist until August 8, but a bullish close appears likely by the end of August 2025.
It's a likely trend projection for August 2025 with Key Reversal Dates. In summary, August is likely to be a bullish month. Please note, price levels are not included in this forecast.
Traders are suggested to conduct own technical studies before entering into the trades and proper risk management is a must.
This is just my personal view.
Best of Luck & Happy Trading.
Positional tradeAt present market is for scalper/intraday trader. Positional trade to be done only once,
1. 24438 is crossed on day closing basis. Bearish view
2. 25102 is crossed on day closing basis. Bullish view
Pivot- Half-Full are weekly range and applicable only till 7th August.
Vertical lines are important times for intraday as buyer

XAGUSD/SILVER LONG 1:5 RReason for entry:
1. Expanding flat structure
2. Order block reaction
3. 5th wave in play
4. 4 HR engulfing candle
Entry: 37.204
Stop loss: 36.454
Take Profit:39.073
Strategy: Wait for engulfing candle to enter
Place trade at break even at 1:2R or move stop loss to 1:1 R when in PROFIT

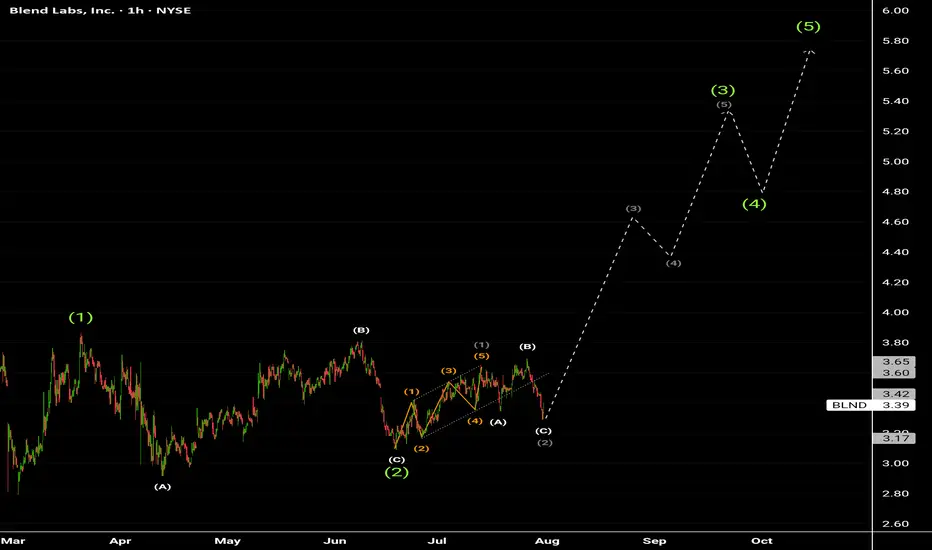
Blend labs inc. w1 completed of W3 , Rally expected to start to almost 4.60$ and above .
Target price 5.35$ and above shortly. 💥
It seems to me a great Earnings coming in August.
Highly recommended for Buying Now from present level.
Buy it ASAP 💣.
Decentraland: Where Are the Bulls?Decentraland’s MANA has recently struggled to sustain the upward momentum of wave iii in orange. Nonetheless, our primary scenario remains that this move should eventually push the altcoin above the $0.40 resistance level. Overall, we anticipate the full five-wave orange sequence could extend beyond the next key threshold at $0.85 before the larger blue wave (i) reaches its peak. Conversely, our 25% likely alternative scenario still allows for a new wave corrective low below the $0.19 support.
📈 Over 190 precise analyses, clear entry points, and defined Target Zones - that's what we do (for more: look to the right).

SPX defying gravity!It's a BULL market until it's not! Some how some way the markets will set new ATHs? I don't know how or why every macro economic indicator is yelling recession or worse but the chart tells me a different story. Bulls ball.....

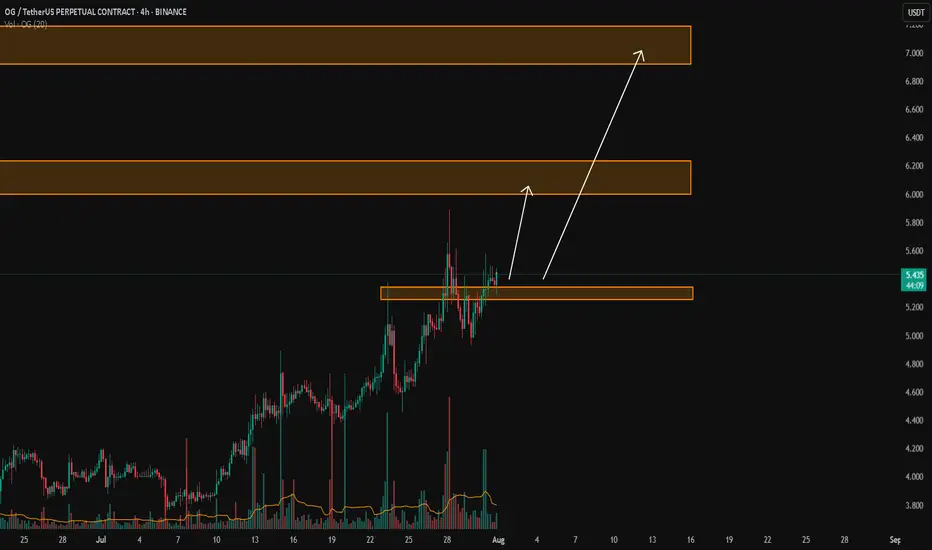
OG/USDTKey Level Zone: 5.250 - 5.340
LMT v2.0 detected.
The setup looks promising—price previously trended upward with rising volume and momentum, then retested this zone cleanly. This presents an excellent reward-to-risk opportunity if momentum continues to align.
Introducing LMT (Levels & Momentum Trading)
- Over the past 3 years, I’ve refined my approach to focus more sharply on the single most important element in any trade: the KEY LEVEL.
- While HMT (High Momentum Trading) served me well—combining trend, momentum, volume, and structure across multiple timeframes—I realized that consistently identifying and respecting these critical price zones is what truly separates good trades from great ones.
- That insight led to the evolution of HMT into LMT – Levels & Momentum Trading.
Why the Change? (From HMT to LMT)
Switching from High Momentum Trading (HMT) to Levels & Momentum Trading (LMT) improves precision, risk control, and confidence by:
- Clearer Entries & Stops: Defined key levels make it easier to plan entries, stop-losses, and position sizing—no more guesswork.
- Better Signal Quality: Momentum is now always checked against a support or resistance zone—if it aligns, it's a stronger setup.
- Improved Reward-to-Risk: All trades are anchored to key levels, making it easier to calculate and manage risk effectively.
- Stronger Confidence: With clear invalidation points beyond key levels, it's easier to trust the plan and stay disciplined—even in tough markets.
Whenever I share a signal, it’s because:
- A high‐probability key level has been identified on a higher timeframe.
- Lower‐timeframe momentum, market structure and volume suggest continuation or reversal is imminent.
- The reward‐to‐risk (based on that key level) meets my criteria for a disciplined entry.
***Please note that conducting a comprehensive analysis on a single timeframe chart can be quite challenging and sometimes confusing. I appreciate your understanding of the effort involved.
Important Note: The Role of Key Levels
- Holding a key level zone: If price respects the key level zone, momentum often carries the trend in the expected direction. That’s when we look to enter, with stop-loss placed just beyond the zone with some buffer.
- Breaking a key level zone: A definitive break signals a potential stop‐out for trend traders. For reversal traders, it’s a cue to consider switching direction—price often retests broken zones as new support or resistance.
My Trading Rules (Unchanged)
Risk Management
- Maximum risk per trade: 2.5%
- Leverage: 5x
Exit Strategy / Profit Taking
- Sell at least 70% on the 3rd wave up (LTF Wave 5).
- Typically sell 50% during a high‐volume spike.
- Move stop‐loss to breakeven once the trade achieves a 1.5:1 R:R.
- Exit at breakeven if momentum fades or divergence appears.
The market is highly dynamic and constantly changing. LMT signals and target profit (TP) levels are based on the current price and movement, but market conditions can shift instantly, so it is crucial to remain adaptable and follow the market's movement.
If you find this signal/analysis meaningful, kindly like and share it.
Thank you for your support~
Sharing this with love!
From HMT to LMT: A Brief Version History
HM Signal :
Date: 17/08/2023
- Early concept identifying high momentum pullbacks within strong uptrends
- Triggered after a prior wave up with rising volume and momentum
- Focused on healthy retracements into support for optimal reward-to-risk setups
HMT v1.0:
Date: 18/10/2024
- Initial release of the High Momentum Trading framework
- Combined multi-timeframe trend, volume, and momentum analysis.
- Focused on identifying strong trending moves high momentum
HMT v2.0:
Date: 17/12/2024
- Major update to the Momentum indicator
- Reduced false signals from inaccurate momentum detection
- New screener with improved accuracy and fewer signals
HMT v3.0:
Date: 23/12/2024
- Added liquidity factor to enhance trend continuation
- Improved potential for momentum-based plays
- Increased winning probability by reducing entries during peaks
HMT v3.1:
Date: 31/12/2024
- Enhanced entry confirmation for improved reward-to-risk ratios
HMT v4.0:
Date: 05/01/2025
- Incorporated buying and selling pressure in lower timeframes to enhance the probability of trending moves while optimizing entry timing and scaling
HMT v4.1:
Date: 06/01/2025
- Enhanced take-profit (TP) target by incorporating market structure analysis
HMT v5 :
Date: 23/01/2025
- Refined wave analysis for trending conditions
- Incorporated lower timeframe (LTF) momentum to strengthen trend reliability
- Re-aligned and re-balanced entry conditions for improved accuracy
HMT v6 :
Date : 15/02/2025
- Integrated strong accumulation activity into in-depth wave analysis
HMT v7 :
Date : 20/03/2025
- Refined wave analysis along with accumulation and market sentiment
HMT v8 :
Date : 16/04/2025
- Fully restructured strategy logic
HMT v8.1 :
Date : 18/04/2025
- Refined Take Profit (TP) logic to be more conservative for improved win consistency
LMT v1.0 :
Date : 06/06/2025
- Rebranded to emphasize key levels + momentum as the core framework
LMT v2.0
Date: 11/06/2025
- Fully restructured lower timeframe (LTF) momentum logic
Bitcoin Go 135kBitcoin has not yet reached the channel ceiling and should bounce back after the resistance.
Bitcoin
Tp1:128000
To2:130000
Tp3:133000
Tp4:135000

Here is WHY SP500 WILL SINK and you should SELL!I already made a techincal analysis on SP500 last week. Here i am again trying to warn you. I have a big convinction that SP500 will sink, and pretty hard. Lot of techincal indicator are showing weakness on the daily timeframe (RSI, MACD, AO, OBV), the political situation is getting complicated day by day, and our frind Powell will proably help to start this big moves soon. Checking the seasonality, it's also clear that a drop like that isn't new, and SP500 is following perfectly the average of previous years, and if history is going to repeat (and usually happens) we will see an exit liquidity from the markets in coming days. If you don't want to go short, at least consider to keep in safe your profits with the longs.
What do you guys think about SP500? Are you bullish on it? Let me know in the commnts, i will be happy to read your ideas!

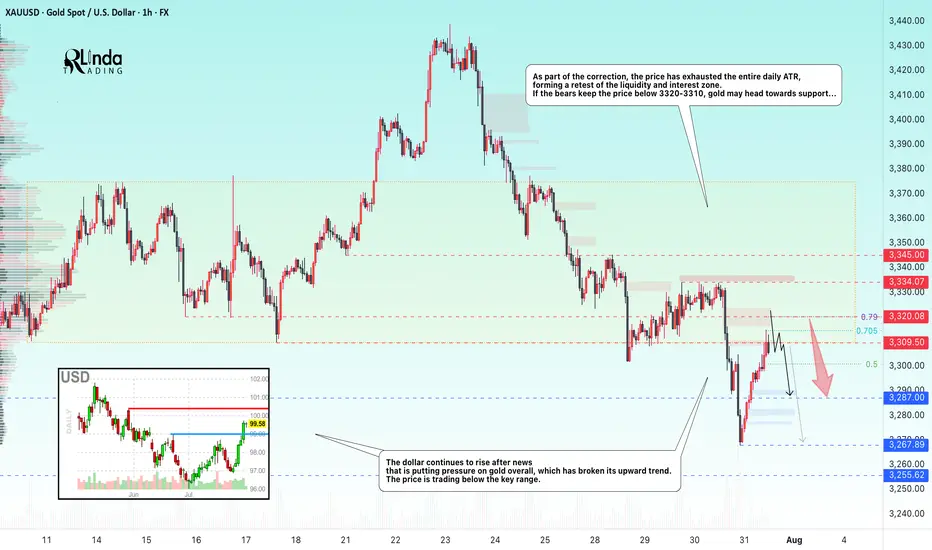
GOLD → Retest of resistance within a bearish runFX:XAUUSD breaks through the upward trend support amid a rallying dollar. Since the opening of the session, the price has been testing the zone of interest, but bears are quite aggressive...
Gold is partially recovering after falling to $3,268, a monthly low caused by the Fed's hawkish tone. The Central Bank kept its rate at 4.25–4.5% (9 votes to 2), highlighting uncertainty due to Trump's tariffs. Markets now estimate the probability of the rate remaining unchanged in September at 58% (previously 35%). The dollar's rise slowed amid concerns about the extension of the US-China trade truce and profit-taking ahead of key US employment data (after strong ADP and GDP reports). The nearest drivers are labor market statistics and trade news, while the technical picture for gold remains bearish.
Technically, on D1, the price is breaking key support zones, including the trend line, which overall only increases selling pressure on the metals market...
Resistance levels: 3310, 3320, 3334
Support levels: 3287, 3267, 3255
As part of the correction, the price has exhausted the entire daily ATR, forming a retest of the liquidity and interest zone. If the bears keep the price below 3320-3310, gold may head towards support...
Best regards, R. Linda!
Gold Potential UpsidesHey Traders, in today's trading session we are monitoring XAUUSD for a buying opportunity around 3,270 zone, Gold is trading in an uptrend and currently is in a correction phase in which it is approaching the trend at 3,270 support and resistance area.
Trade safe, Joe.
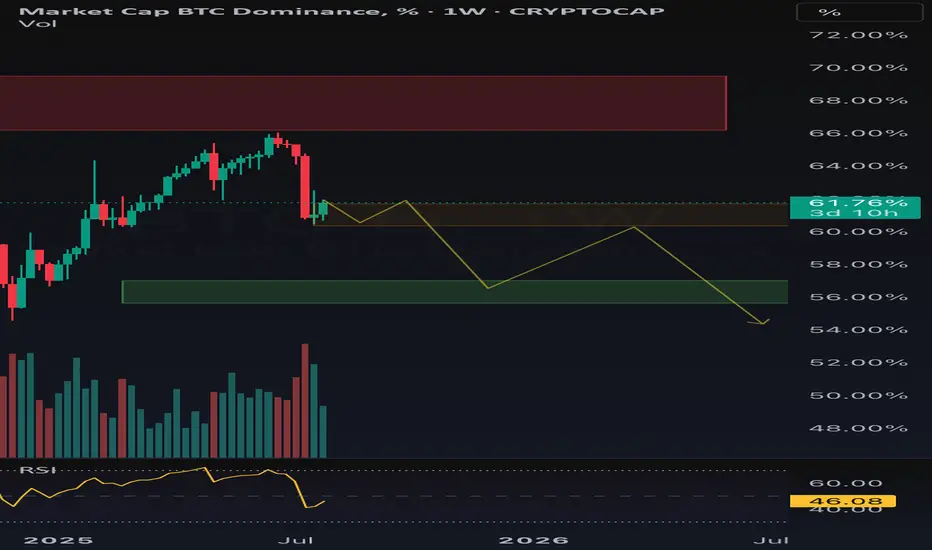
$BTC.D WeeklyConsidering that from the red zone, there has been a strong pullback accompanied by volume, I will continue my projection where these are the weekly targets for CRYPTOCAP:BTC.D
All these points have been calculated using FIB
BTC analysis, supports 116k, targets 122k, caution below 115.9k__________________________________________________________________________________
Technical Overview – Summary Points
__________________________________________________________________________________
Bullish momentum confirmed on all timeframes (1D to 1H).
Key supports: 115,960 / 117,423 / 117,700. Main resistances: 119,573–119,800–122,318.
Volumes overall normal to moderately high, no climax.
Risk On / Risk Off Indicator: strong buy signal for all higher TFs, neutral on 30m/15m (momentary exhaustion).
ISPD DIV neutral across all frames, no extreme or behavioral signals.
MTFTI trend: up / strong up across the board.
__________________________________________________________________________________
Strategic Summary
__________________________________________________________________________________
Main bias: confirmed bullish, high-range maintained between 116k–122k.
Opportunities: buy on validated pullbacks between 116k–117.7k, take partial profits under 119.5k–122k.
Risk areas: sharp downside below 115,960 with potential extension to 112k/110k.
Macro catalysts: PCE (slightly above consensus), Fed on hold, moderate volatility. No negative crypto catalyst in sight.
Action plan: Tactical stop-loss below 115,960, defensive management within range.
__________________________________________________________________________________
Multi-Timeframe Analysis
__________________________________________________________________________________
1D – Support: 115,960 (Pivot Low), Resistance: 119,573–122,318. Strong momentum, resistance clusters.
12H/6H/4H – Bullish structure, moderate volume participation, consolidation under major resistance, pullbacks defended.
2H/1H – Compression between pivots, patience before breakout or support retest.
30m/15m – Tight consolidation, Up momentum but neutral behavioral signals, compression pre-move.
Risk On / Risk Off Indicator : Strong buy on all TFs except intraday, neutrality on 30m/15m (temporary stall).
ISPD DIV : No euphoria/fear, median persistent zone.
Volumes slightly above average, healthy structure.
Summary: Technical and fundamental confluence, upper range maintained, no reversal signals present.
__________________________________________________________________________________
Summary and Strategic Plan
__________________________________________________________________________________
Main bias: confirmed bullish on all frames, but increased caution above 122k.
Plan: tactical buy only on validated pullback/price action, defensive profit-taking near resistance.
Stop-loss below 115,960. Major invalidation under this threshold (low liquidity area).
Monitor reactions to upcoming macro events (PCE/Fed) and any escalation in geopolitics.
__________________________________________________________________________________
Macro/Fundamentals & On-chain
__________________________________________________________________________________
US Macro: PCE YoY above forecast (2.6% vs 2.5%), Fed on hold, USD under pressure.
No systemic negative crypto alerts. IMF to classify BTC as “national wealth” from 2026.
On-chain: Large liquidity test absorbed, 97% of BTC supply in profit, network consolidation in 117k–122k.
Specific risk on break <115k: potential acceleration towards 110k.
__________________________________________________________________________________
Summary: BTC/USDT is in a structural range 116k–122k with a dominant bullish bias, supported by technicals, strong macro and on-chain content. Accumulating at supports and defensive sells near resistance remain optimal until confirmation of a directional breakout.
Suggested stop-loss: <115,960.
Moderate risk until the next major macro/event catalysts.
__________________________________________________________________________________
