Wave Analysis

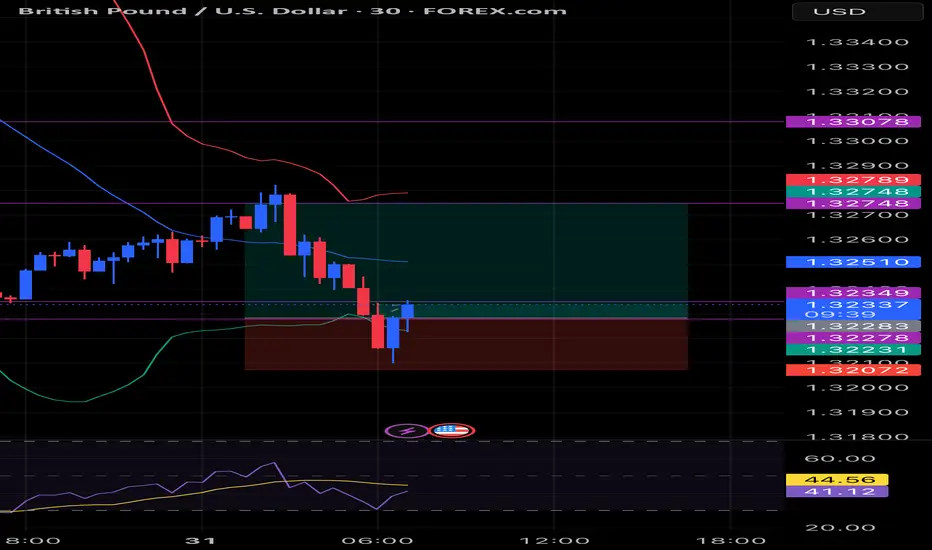
Market Trap Alert! GBP/USD Bearish Robbery Plan🔥💸 "The Cable Heist" – GBP/USD Robbery Plan Using Thief Trading Style 💸🔥
— Unfiltered Forex Forecast with Risky Intentions —
🌍 Hey Money-Makers, Market Hustlers & Chart Bandits! 🤑✈️
Hola! Bonjour! Marhaba! Hallo! Ciao! Welcome to the Forex streets where the smart rob the charts, not banks.
Ready for the GBP/USD Heist? Let’s break it down with our infamous Thief Trading Style – raw, unapologetic, and built for profits.
💼 Operation Name: “The Cable Forex Bank Robbery”
🎯 Pair: GBP/USD – aka “The Cable”
⚔️ Style: Scalp / Day Trade / Swing Heist
📊 Bias: Short (Bearish Setup)
🛠 STRATEGY SETUP: "Follow the Shadows"
🔍 Analysis Basis:
Smart-Money Traps at Key Levels
Oversold ≠ Reversal (Read between the candles)
Liquidity Hunting Zones
Retail Stop Clusters Exposed
Thief-style DCA Entries (Staggered Entry Levels)
Multi-timeframe Confirmation
COT, Sentiment & News-Driven Volatility
🎯 ENTRY ZONE:
Enter short (sell) using 15M or 30M chart.
Sell Limits near recent highs (pullback zone).
DCA (Layered Entry) recommended – Thief loves catching price slipping.
Let the liquidity work for us.
🛑 STOP LOSS (SL):
Base SL around 1.34000 on 4H Chart – above swing high.
Adjust SL per position size and total entries.
Manage risk, but remember: thieves don’t panic, they plan!
🎯 TARGET ZONE:
TP near 1.31000 or adjust using price action.
Escape before target if market mood flips – no need to be greedy.
Trail SLs if market momentum dies down.
👀 Scalpers' Special Note:
Only SHORT — don’t mess with long side unless you’re a liquidity donor.
Quick ins & outs. If you're loaded with capital, jump in big – else follow the swing team.
Use trailing SLs for safety — protect the loot.
📢 FUNDAMENTALS TO WATCH:
News Impacting GBP/USD
COT Reports
Sentiment Indicators
Macro Trends / Yield Spreads
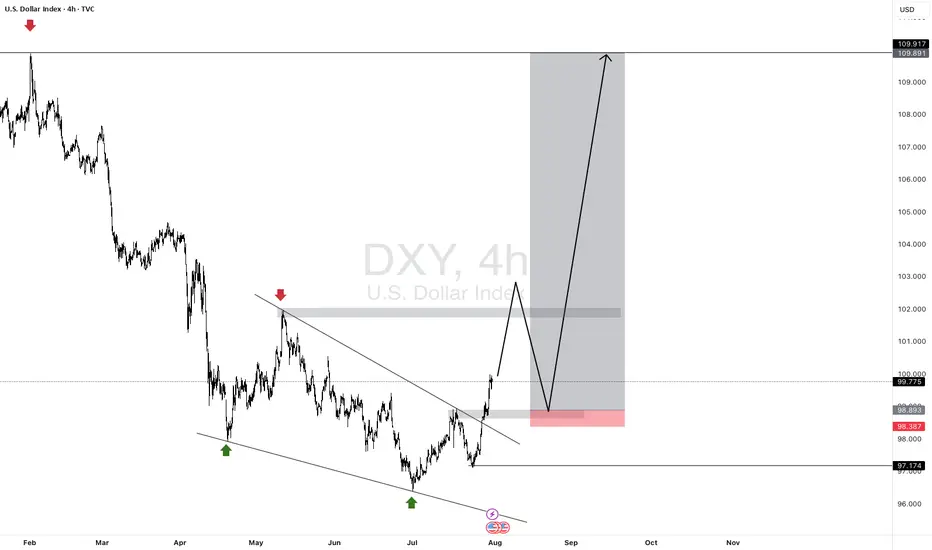
US Dollar Strength Index (DXY)
UK Economic Reports (CPI, GDP, Rate Decisions)
⚠️ RISK MANAGEMENT TIPS:
🚨 Avoid new entries during news releases
🚨 Use trailing stops during volatility spikes
🚨 Secure running trades before major announcements
🚀 Boost the Robbery – Support the Strategy
💖 Smash that BOOST BUTTON if you're vibing with this setup. Help the Thief crew grow stronger!
Let’s keep milking the market 💸 – one “heist” at a time. Stay dangerous, stay smart.
🔓 NOTE: This isn't investment advice. Just a wild trading idea from a chart outlaw.
Always DYOR – Do Your Own Robbery (Research).
Market conditions shift fast. Stay alert, adapt, and respect your capital.
#ForexThiefStyle #CableHeist #GBPUSDShort #SmartMoneyMoves #LiquidityHunters #ChartOutlaws #TradingRebels #DayTradeLife #ScalpersParadise #ForexGang #FXHeistPlans

CADJPY Short Day Trade OANDA:CADJPY Short Day Trade, with my back testing of this strategy, it hits multiple possible take profits, manage your position accordingly.
Note: Manage your risk yourself, its risky trade, see how much your can risk yourself on this trade.
Use proper risk management
Looks like good trade.
Lets monitor.
Use proper risk management.
Disclaimer: only idea, not advice

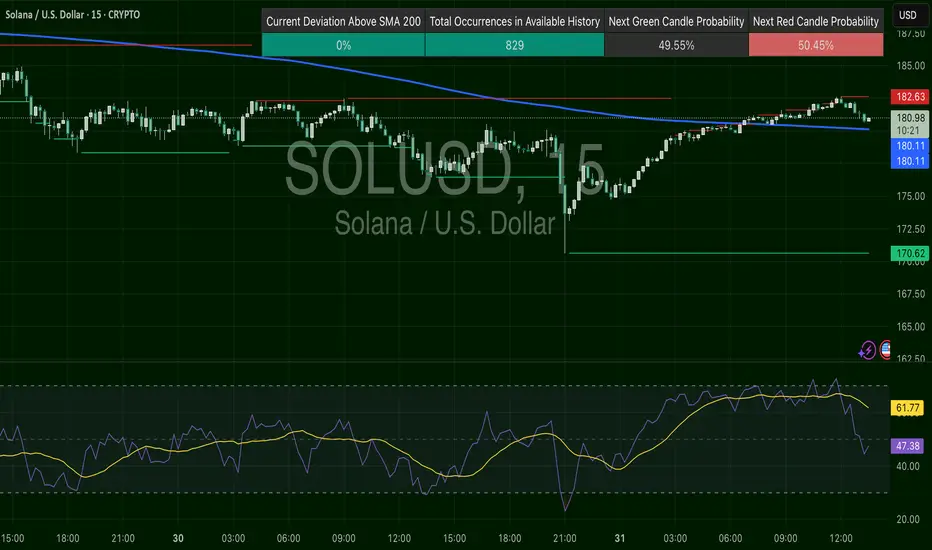
SOLUSD – Faded Highs, Now RetestingSOL recovered off the $170–172 lows and is now testing $182.63 resistance. RSI was high and now cooling off (~47), suggesting momentum is slowing. Still trading just over the 200 SMA, this is a breakout pullback zone. $180.13 is the key level to stay above.
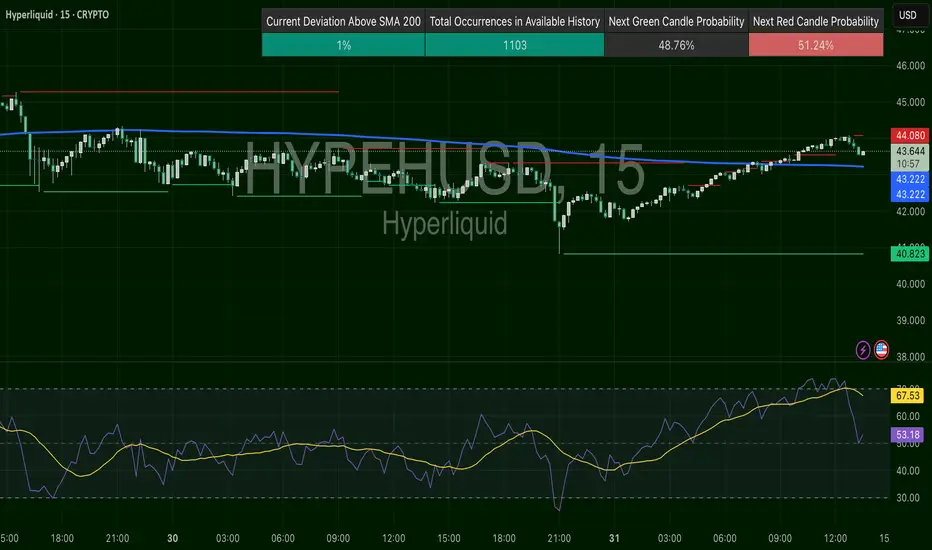
HYPEUSD – Range Break Then PauseHYPE consolidated tightly under the 200 SMA, then broke out in a clean trend shift, moving from ~$41 to ~$44. RSI climbed into the 70s before pulling back, showing short-term exhaustion. It’s now hovering just below resistance at $44.08. This area is a test zone: breakout continuation or fade.
SUIUSD – Snapped Trend, Needs FuelSUI launched off $3.62 support, breaking trendline and 200 SMA around $3.81, reaching $3.95. RSI got hot (~63) and now turning. It’s pausing under resistance, forming a potential flag. $3.89 is key support to hold for next push. Below that risks retracing deeper.

LINKUSD – Finally Flipped the TrendLINK surged after reclaiming $17.78 and breaking through the 200 SMA for the first time in days. RSI hit >63 and now rolling. If $18.05 holds as support, bulls may push toward $18.22 and higher. Weakness below $17.78 would fade the setup.

A PICTURE IS WORTH A THOUSAND WORDS.The two charts are only separated by name, both are working out a correlated fractal structure.
The exact position of Solana compared to the Tesla fractal is much elusive. Two possible considerations of current structure in Solana fit equally into the past trend already completed by Tesla
The two possible scenarios are indicated on the chart above,
1. If the 21st July 2025 top in Solana corresponds to the 4th April 2022 point on Tesla, the price action will favourably follow the white line.
2. If the 21st July 2025 top in Solana rather aligns with the 17th July 2022 point on Tesla, then price will likely make a minor correction and move higher as indicated by the gold line.
Please note, the year dates below the lines are not to be considered, the lines are just for illustrations only. Also note that the extent of corrections or expansions in fractals are not necessarily the same, they only share similar structural forms.
Trade safe, good luck

TrumpUsdt accroding to VSFA+ Stratgy A.o.A All,
Accroding to VSFA+ Stratgy trumpusdt last retest before big drop, maybe moreee buyser traping i'm still waiting for 3$ to 5$ price velue, when Tmp testing this price velue then i buy some Drump coins & hold for long time in sha Allah....

the retail trader outlookWe see that the wedge pattern has been completed and the bullish market is strong as the candles a huge, this is a high risk low reward trade as it clear and obvious to the vest public that the markets wants to rally. the role of the dollar price plays a vital role in this not happening as we see that the dollar has formed the yearly low as is starting to move up in an increasingly high speed suggesting that Gold is more likely to be affected by the sudden Rally in the dollar currency and the opposite is true given a drop in dollar.
LTC long turm Accroding to VSFA+ A.o.A All
Accroding to VSFA+ Strategy, LTCusdt long trum dump expected

GBPJPY SellExternal structure is now bearish and the internal structure did a liquidity grab. Price should continue lower and go towards asia low to complete daily cycle.

SOLANA could have a major retracement Solana completed a major ABC correction into a supply zone on the higher time frame (HTF), taking out the previous quarter’s highs.
On the daily chart, the RSI is overbought and signals the potential for a significant retracement.
Price action on the 4-hour chart shows a series of lower highs, indicating a bearish trend. If Solana fails to break above the previous high and trigger a market structure shift, the downtrend is likely to continue, leading to a deeper retracement on the higher time frames.

Where is GOLD going next?In the last four months, GOLD privided us a common pattern (for four times) that usually lead to an explosive moves. Where are we going next and what could be the target? In this case, time help us to understand better. The pattern is not complete yet and i expect the move to run in 24 hrs (maybe due to the high impact news will we have tomorrow, like the Initial Jobless Claim and CPE?). Now we just need to understand where the price will go to make profits, and to try to understand this we will check the RSI and the MACD. When this pattern occured, the RSI was rising and above 50 for three times with MACD on bullish cross (the three times that the price pumped) and was chopping and struggling close to 50 (but below it) with a bearish cross on MACD the single time it crushed. If we look at the actual situation, RSI is rising and MACD it's on bullish setup, but i will update you tomorrow (or when a breakout will occur). Now, for the possible target, we can easily aim to $100 move. So, price can touch $3420 for a long or $3240 for a short.
What do you think guys? Let me know in the comments!

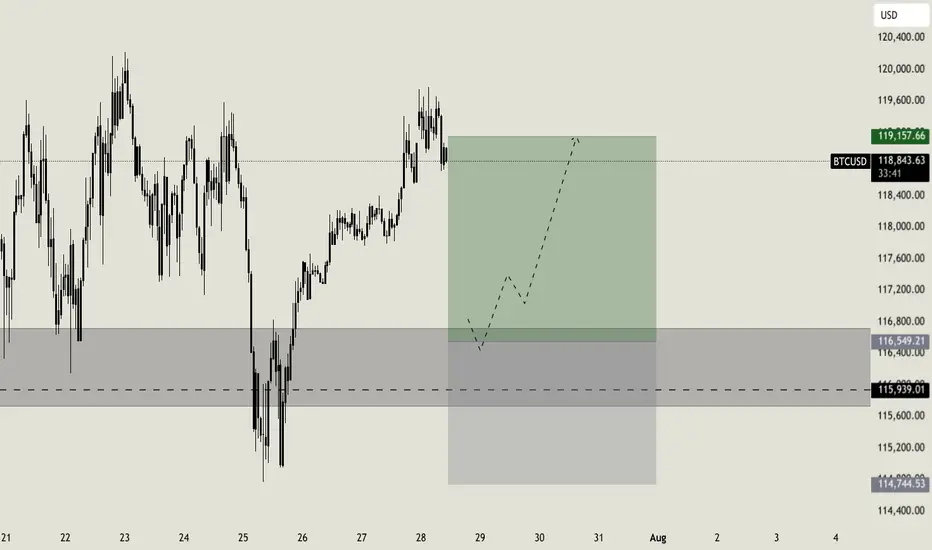
Weekly setup for BTCLast week i was waiting for a short confirmation on Bitcoin, a confirmation that has never arrived. But setups are made for this: we wait the right moment to join the market, based on a cold analysis. Considering that the support area looks still strong, i will now wait for a retracement till the key level at $116.550. Around this level i will look for a rejection to enter long, targeting the resistance zone at $119.000
Gold Spot / U.S. Dollar Analysis (15-Minute Chart)Key Levels
Support Levels:
Immediate: 3,294.000 (S/L level)
Next: 3,280.000
Resistance Levels:
Immediate: 3,304.000 (Entry level)
Next: 3,308.000, 3,316.250, 3,320.000
Profit Targets:
Tiered levels up to 3,328.000 (highest target).
Price Action & Trends
Current Trend:
The price is bullish (+0.84% today) but hovering near the entry level (3,299.000) and testing 3,302.700.
The presence of multiple profit targets above suggests a bullish bias in the trade setup.
Critical Observations:
Price recently dipped to 3,294.000 (S/L) but rebounded, indicating buying interest at support.
The 3,304.000 level (entry) now acts as resistance. A breakout above could target 3,308.000+.
Volume & Momentum:
Not visible in the screenshot, but the upward movement suggests moderate bullish momentum.
Trade Setup Analysis
Entry: 3,299.000
Stop-Loss: 3,294.000 (5 USD below entry)
Profit Targets:
3,304.000 (Breakeven+)
3,308.000 → 3,328.000 (Scalping opportunities).
Risk-Reward Ratio:
If targeting 3,328.000, the RR is ~5:1 (29 USD profit vs. 5 USD risk).
Actionable Insights
Bullish Scenario:
Hold if price sustains above 3,304.000 (entry resistance).
Next target: 3,308.000.
Bearish Caution:
If price falls below 3,294.000 (S/L), exit to limit losses.
Watch for rejection at 3,304.000 (potential reversal).
Market Context:
Gold is sensitive to USD strength and geopolitical events. Monitor broader trends for confirmation.

DOGE at Decision Point Dogecoin is forming a descending triangle pattern on the 2H chart, indicating a potential breakout setup.
A close above the resistance trendline ($0.23) could trigger a bullish move, while a breakdown below support ($0.215) may signal a bearish continuation. RSI and volume are suggesting weakening momentum — wait for confirmation before entering.

Sling shot above trendline If we go above the yellow resistance with good volume, potential target prices are indicated. Practice safe stop loss (-10%) in these speculative moves.

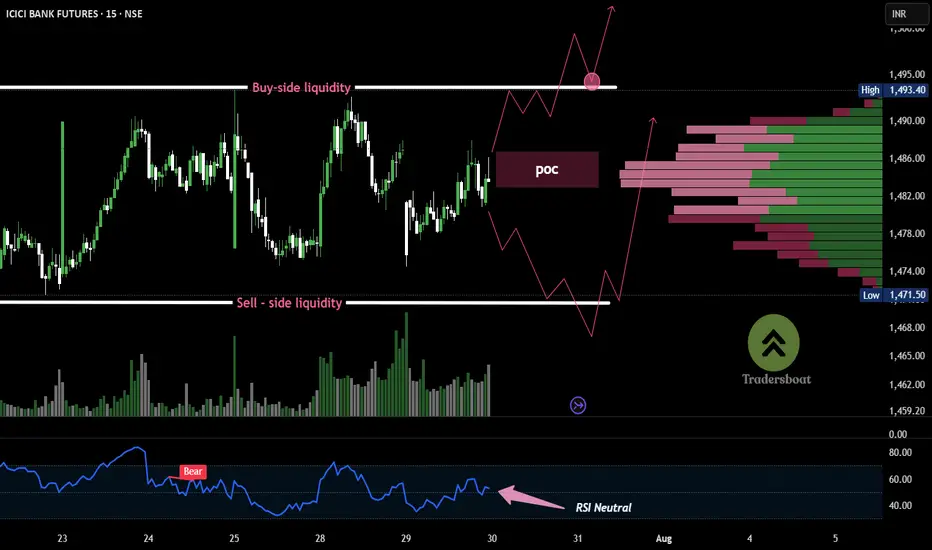
ICICI BANK -15MIN Volume bulge at ₹1485 = decision pointICICI Bank Futures is consolidating in a tight range between ₹1462 and ₹1493, building both buy-side and sell-side liquidity. This structure typically precedes a strong breakout.
The volume profile shows a concentration around ₹1484–₹1486, indicating it as a decision zone. RSI remains weak below 50, suggesting short-term bearish control, but a breakout in either direction could trigger momentum.
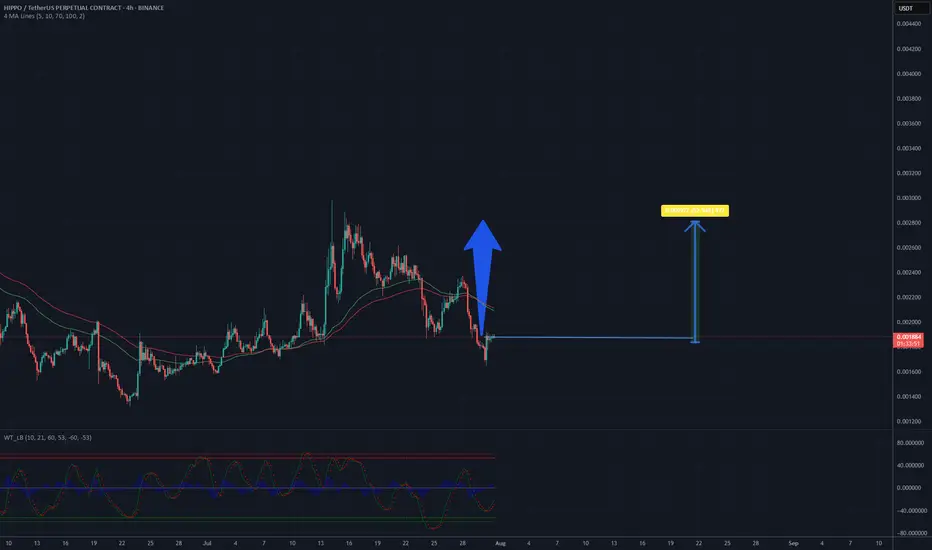
Is a time for HIPPOUSDT? Potential 50% - 0.0028 USD CRYPTOThe chart displays a 4-hour candlestick pattern for the HIPPO/USDT perpetual contract on Binance, showing price movements from late June to mid-September 2025. The price has recently experienced a downward trend after reaching a peak, with a noticeable drop from around 0.0028 to the current level of approximately 0.00186. The moving averages (red and green lines) indicate a potential bearish crossover, suggesting continued downward pressure in the short term. However, the price is approaching a support level near 0.0017, where historical buying interest might emerge. The oscillator at the bottom shows mixed signals, with a slight uptick that could hint at a potential reversal if momentum builds. Based on this analysis, a price recovery to 0.0028 seems plausible if the support holds and buying volume increases in the coming sessions.
Potential TP: 0.0028 USD
GOLD BUY M15 Gold (XAUUSD) 15-Min Chart Analysis – July 31, 2025
The chart shows a clear bullish structure after a confirmed Change of Character (ChoCH) and Break of Structure (BOS) on the lower time frame. Price has broken above previous resistance zones, indicating strong buying momentum.
Entry Zone:
Price is currently retesting a demand zone (highlighted in pink).
Ideal buy entry was taken after the bullish ChoCH.
Stop Loss:
SL: 3397, placed just below the demand zone for risk protection.
Targets / Resistance Levels:
1. First Resistance: 3308
2. Second Resistance: 3311
3. Third Resistance: 3316
4. Final Target: 3325
Bias:
Bullish, expecting higher highs as long as price holds above the demand zone.
Break and retest strategy is forming, suggesting continuation toward the final target.
