GBPUSD Technical Overview GBPUSD Technical Overview
GBPUSD recently peaked at 1.3790, aligning with a key historical resistance zone from October 2021. On the Daily Chart, this move completed a significant bearish pattern, suggesting the potential for further downside.
Over the last 7 trading sessions, the pair has declined nearly 400 pips, moving decisively lower.
Given the steep drop, a technical correction may be on the horizon before GBPUSD potentially resumes its bearish trajectory, as indicated by the current chart setup.
If NFP data can be strong today, GBPUSD could extend to the first target 1.3100 or 1.3000 as shown in the chart.
Overall, GBPUSD looks like it has started a downtrend.
Let's see how the price will unfolds.
You may find more details in the chart!
Thank you and Good Luck!
PS: Please support with a like or comment if you find this analysis useful for your trading day
Disclosure: I am part of Trade Nation's Influencer program and receive a monthly fee for using their TradingView charts in my analysis.
Wave Analysis

BITCOIN CRASH PREDICTED! HERE’S WHAT HAPPENS NEXT! (scary)Yello Paradisers, Bitcoin crashed exactly as we predicted in the previous videos that it will happen with the highest probability.
In this video I am explaining to you what's gonna happen next.
Head and shoulders, neckline, is be breaking to the downside, we need a clear confirmation of a reclaim Our channel on high timeframe is getting breakout to the downside and confirmation was that a reclaim was already successful.
In this video I'm sharing with you Elliott Way theory on low timeframe and what needs to be done for confirmation perspective in order for us to continue to go to the downside or have a reversal to the upside.
Don't be a gambler. Don't try to get rich quick. Make sure that your trading is professionally based on proper strategies and trade tactics.

USDJPY 30Min Engaged (Buy & Sell Reversal Entry's Detected )Time Frame: 30-Minute Warfare
Entry Protocol: Only after volume-verified breakout
🩸Bullish Reversal - 148.750
🩸Bearish Reversal - 150.100
➗ Hanzo Protocol: Volume-Tiered Entry Authority
➕ Zone Activated: Dynamic market pressure detected.
The level isn’t just price — it’s a memory of where they moved size.
Volume is rising beneath the surface — not noise, but preparation.
🔥 Tactical Note:
We wait for the energy signature — when volume betrays intention.
The trap gets set. The weak follow. We execute.

Oil Faces Bearish Turn After Speculative SpikeOil Faces Bearish Turn After Speculative Spike
Since June 24, 2024, when oil prices reached $64 entered a 38-day bullish correction. Based on the chart, this move appears to be forming an ABC corrective pattern, which may now be nearing completion.
From here, a renewed decline is likely, with potential downside targets at $65, $60, and $56.
Geopolitical Speculation Oil prices jumped in recent days following President Donald Trump's heightened rhetoric toward Russia. His announcement of a tighter deadline to end the war in Ukraine, along with tariff threats targeting countries trading Russian oil, stirred market reactions.
However, this rally seems driven more by speculation, and oil may soon resume the bearish movement again.
You may find more details in the chart!
Thank you and Good Luck!
PS: Please support with a like or comment if you find this analysis useful for your trading day

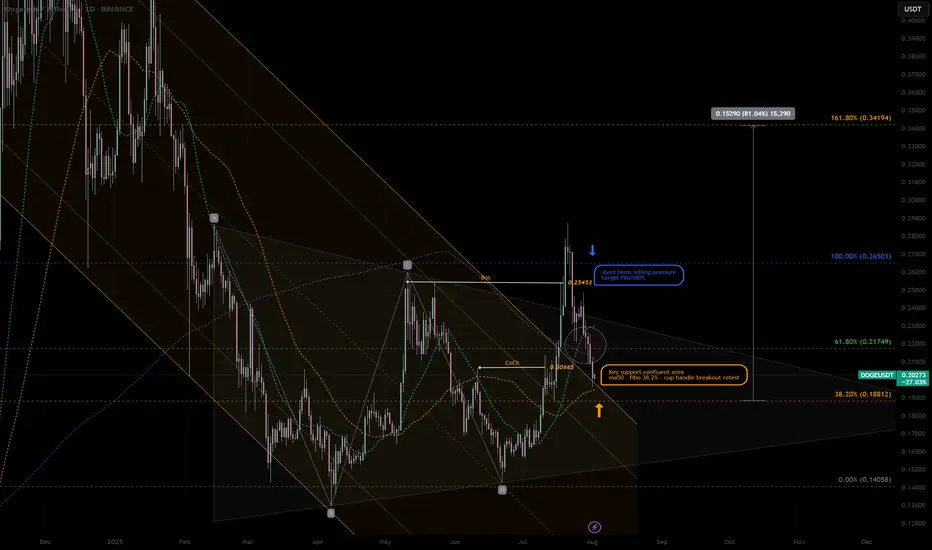
DOGEUSDT|Pullback Confluent Support -cup&handle next ext. +80%DOGE - retraced at the confluent support zone, high potential pullback buy position:
- SMA50 Dynamic support—often attracts mean-reversion buys.
- cup & handle support retest Price retested prior breakout zone—flips resistance to support.
- key 38% Fib “sweet spot” pullback level after corrective moves.
- Previous Change of Character marks shift from bearish to bullish structure—support confluence.
Potential Entry & Risk Management
Entry Zone
- Aggressive: immediate handle breakout support
- Conservative: Wait for liquidity pattern and re-bounce confirmation candle above SMA50
Stop-Loss
-Below Cup Handle low -10% larger position prior swing high RR:2.5/1
-Suggested SL: previous low -0.17 USDT - 5% below entry
Initial Targets
-Key resistance 61.8% Fib retracement — 0.217 USD
-100% Prior swing high — 0.26 USD
-162% Next extended target - 0.35 USD
Trade Rationale
-Mean-reversion into SMA50 and Fib 38.2% zone aligns multiple buyers.
-Pattern support: Cup & handle retest confirms breakout strength.
-Structure flip: CoCh zone indicates bullish regime shift.
Watch-Outs
-Rejection below 0.188 USD erodes support cluster—invalidates setup.
-Rising volume on bounce is crucial—low-volume lifts often fail.
-Beware broader market sell-offs impacting altcoins.
Next Steps:
-Monitor 4-hour candlestick close inside entry zone.
-Check volume spike on reversal candle.
-Adjust risk dynamically if price gravitates toward upper channel resistance.
Always trade with affordable risk and respect your stop..
GOLD Correction Ahead!
HI,Traders !
#GOLD is growing strongly
And the pair looks locally
Overbought so after it
Hits the horizontal resistance
Area around 3374.56 we will
Be expecting a local bearish
Correction and a move down !
Comment and subscribe to help us grow !

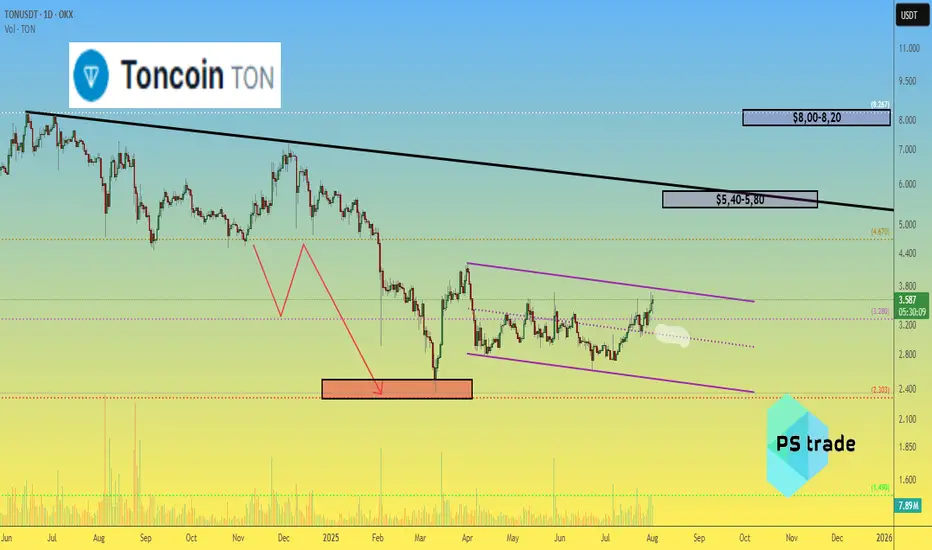
Toncoin TON price analysis💎 CRYPTOCAP:TON didn’t become a legend over the past 9 months — but at least our correction target of $2.30–2.50 played out with precision.
While most of the crypto market is currently going through a correction, #Toncoin keeps pushing upward. Still, we remain realistic:
🎯 First target: $5.40–5.80
🎯 Second target: $8.00–8.20
🚀 It’s not a “to the moon” scenario, but a potential 2x–3x from current levels is attractive.
The key support level OKX:TONUSDT remains at $3.00 — as long as it holds, the bullish trend remains valid.
Ethereum Bull TrapThe Ethereum bull trap: Is it a breakout or fakeout? Iinstitutional and retail trends show something strange is cooking
www.cointrust.com

SOL Both scenarios are valid! SOL is still bullishSOL Both scenarios are valid! SOL is still bullish
SOL is in a critical zone. The price is still inside a large bullish pattern and as long as it stays inside the pattern, the trend remains bullish and SOL should follow the bullish scenario.
The bullish targets are at 205, 214 and 224
It may happen that the FOMC will bring surprises, so if SOL manages to break below the pattern, it will activate the bearish scenario after that and the chances of falling will increase further as shown in the red scenario.
The bearish targets are at 160 and 139
You may find more details in the chart!
Thank you and Good Luck!
PS: Please support with a like or comment if you find this analysis useful for your trading day

USDJPY - Now or Never!Hello TradingView Family / Fellow Traders. This is Richard, also known as theSignalyst.
📈USDJPY has been overall bullish trading within the rising channel marked in blue and it is currently retesting the upper bound of the channel acting as an over-bought zone.
Moreover, the green zone is a strong weekly resistance.
📚 As per my trading style:
As #USDJPY is around the red circle zone, I will be looking for bearish reversal setups (like a double top pattern, trendline break , and so on...)
📚 Always follow your trading plan regarding entry, risk management, and trade management.
Good luck!
All Strategies Are Good; If Managed Properly!
~Rich
Disclosure: I am part of Trade Nation's Influencer program and receive a monthly fee for using their TradingView charts in my analysis.

Big money coming? Here, NFP data XAUUSD Technical Analysis PredDXY forecast today
XAU USD forecast today
EURUSD forecast today
NFP Data Forecast: Xauusd buys SELV sales for mass profit! Your latest gold trade guide confidently during the production of this most important wages is not related to the farm. In this video you will receive technical analysis from XaUUSD experts and proven adjustments for XaUUSD sales. It breaks down how you interpret forecasts for NFP data, how it affects gold prices, and where the best opportunities are. Whether you're a day trader or swing, this video gives you real information to plan your trade and plan your risk management as an expert. Don't miss this opportunity to turn your data into profits ahead of the market. Now look, trade more intelligently and go ahead with the crowd!
#NFPDATAFORECAST
#xauusd
#GoldTrading
#technicalalyasis
#forexsignals
#GoldPrice
#daytrading
#swingtrading
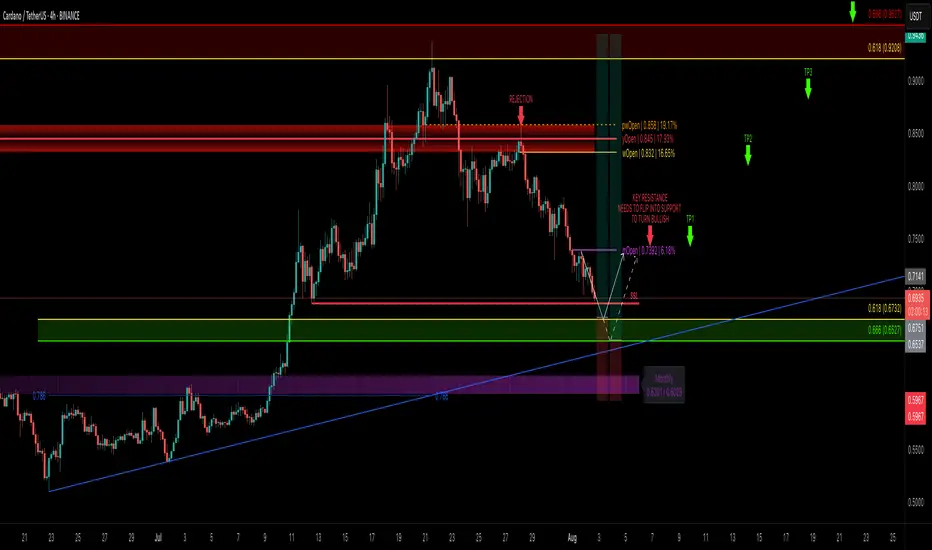
ADA Correction Nearing Completion — Is It Time to Load Up?After tagging the golden pocket resistance zone between $0.9208–$0.9527, ADA completed a clean 5-wave Elliott impulse right into a major resistance. Since then, price has corrected -25%, and we’re now likely nearing the end of an ABC correction — the final wave C.
🧩 Technical Breakdown
➡️ Wave A: 5-wave drop after the peak
➡️ Wave B: Bounce rejected at yearly open (yOpen) — that was a great short opportunity around $0.845
➡️ Wave C: Now working toward completion
🎯 C Wave Target Zone: $0.69–$0.65
This zone has strong confluence:
0.618 Fib retracement of the entire 5-wave move at $0.6732
1.0 TBFE (Trend-Based Fib Extension) aligns perfectly
Sell-side liquidity (SSL)
0.786 Fib Speed Fan support
Monthly 21 EMA/SMA adding a final confluence layer
🟢 Long Setup
Entry Zone: $0.69–$0.65 (ladder in)
Stop Loss: Below the monthly 21 EMA/SMA ($0.6)
Target 1: mOpen key resistance
Target 4: 0.666 Fib at ~$0.95
Risk:Reward: ~1:4+
💡 Educational Insight
After a 5-wave impulsive move, ABC corrections are common. Using the Trend-Based Fib Extension tool to project wave C, especially when paired with liquidity zones, VWAP, or moving averages, helps pinpoint high-probability reversal zones. It’s about confluence and reaction — not prediction.
🔍 Indicators
For this analysis, I’m using my own indicators
DriftLine – Pivot Open Zones and
MFT MA Support/Resistance Zones
both available for free. You can find them on my profile under “Scripts” and apply them directly to your charts for extra confluence when planning your trades.
_________________________________
💬 If you found this helpful, drop a like and comment!
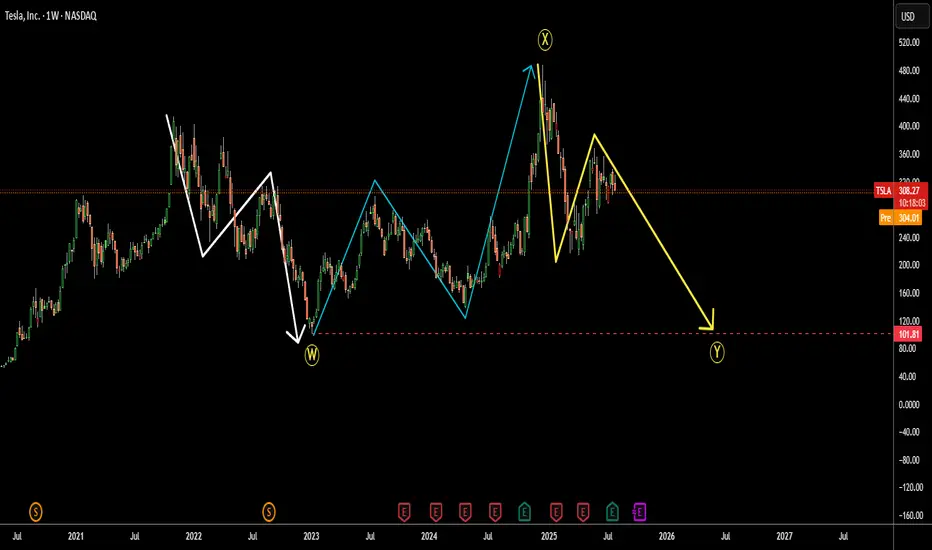
Tesla (TSLA) Crash Ahead? $101.81 Retest in SightThe Tesla price chart appears to show a large flat correction labeled W-X-Y.
Wave W consists of three downward waves from 2021 to 2023. (white)
Wave X shows a three-wave upward retracement from 2023 to 2024, which even overshot the start of wave W. (blue)
Now, we seem to be in the final leg of the third move: wave Y down. (yellow)
Typically, wave Y retests the bottom of wave W.
If that holds, we could see Tesla’s price revisit the 2023 low of $101.81.
Is Tesla losing its appeal?
I’d love to hear your thoughts.
EURUSD: Bears Will Push Lower
Remember that we can not, and should not impose our will on the market but rather listen to its whims and make profit by following it. And thus shall be done today on the EURUSD pair which is likely to be pushed down by the bears so we will sell!
Disclosure: I am part of Trade Nation's Influencer program and receive a monthly fee for using their TradingView charts in my analysis.
❤️ Please, support our work with like & comment! ❤️

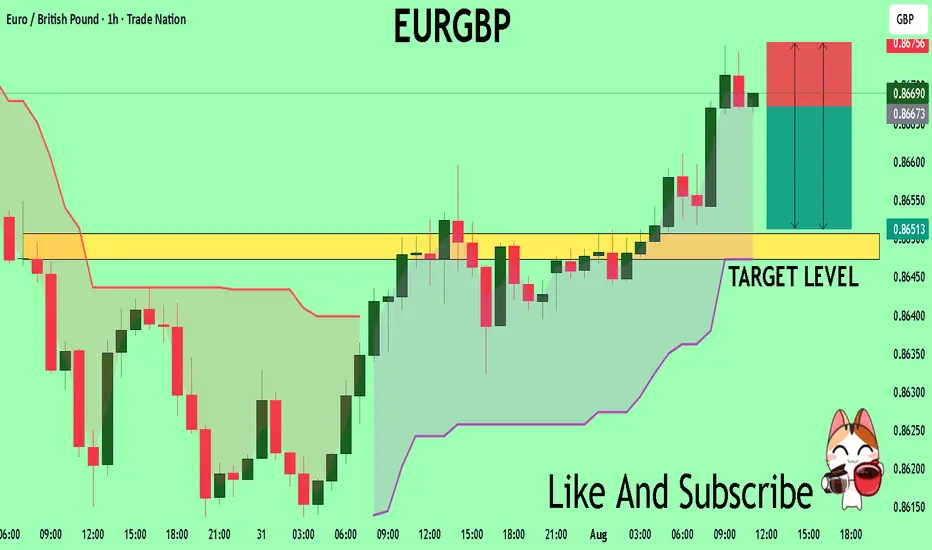
EURGBP Will Collapse! SELL!
My dear subscribers,
EURGBP looks like it will make a good move, and here are the details:
The market is trading on 0.8667 pivot level.
Bias - Bearish
My Stop Loss - 0.8675
Technical Indicators: Both Super Trend & Pivot HL indicate a highly probable Bearish continuation.
Target - 0.8650
About Used Indicators:
The average true range (ATR) plays an important role in 'Supertrend' as the indicator uses ATR to calculate its value. The ATR indicator signals the degree of price volatility.
Disclosure: I am part of Trade Nation's Influencer program and receive a monthly fee for using their TradingView charts in my analysis.
———————————
WISH YOU ALL LUCK
XRPUSDT ShortWe´ve just finished the 5th wave of the bullish structure and started a 5 wave corrective structure for a bigger ABC correction. Right now we´re in the 4th wave and exspecting one more bearish move into the yellow area

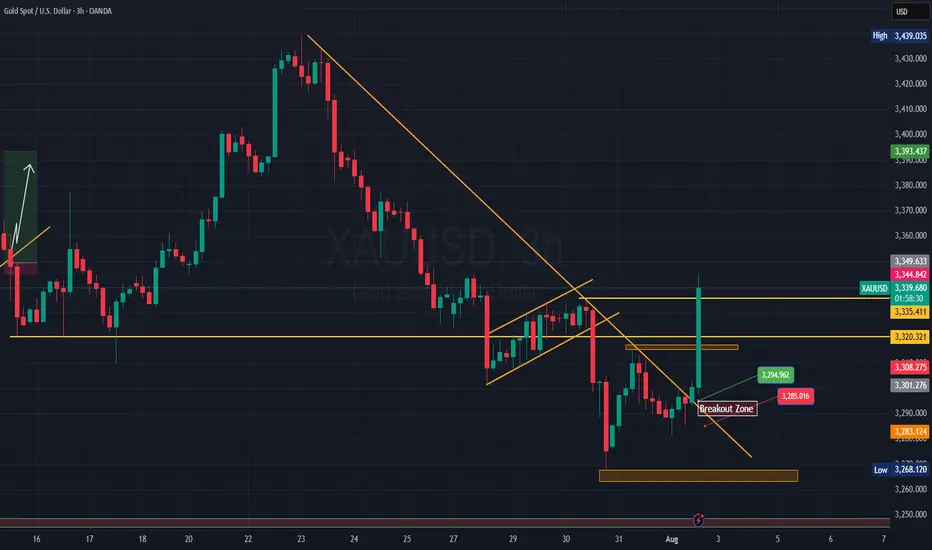
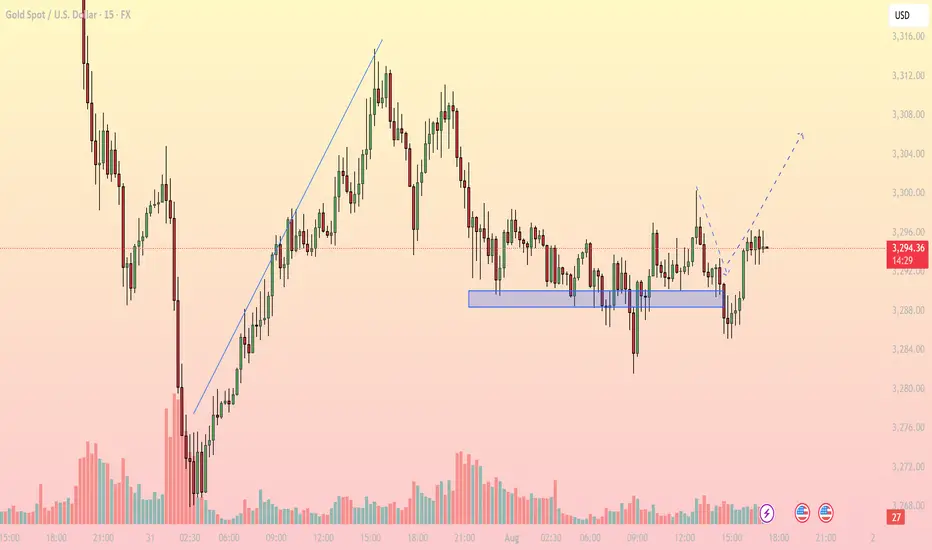
Bullish Rejection from Support, Upside in FocusMarket Overview: On the M15 timeframe, XAUUSD shows signs of a short-term bullish reversal after a prolonged sideways range around the key support zone of 3,286 – 3,289 USD. Price faked out below this support but quickly recovered, forming a V-shape reversal, suggesting strong buying interest has returned.
Key Levels to Watch:
Support Zones:
- 3,286 – 3,289: Strong intraday support, tested multiple times with sharp rejections
- 3,274: Next significant support if the above zone fails
Resistance Zones:
- 3,300 – 3,304: First resistance target aligned with the recent high
- 3,308 – 3,312: Higher resistance area where supply may emerge
Technical Indicators:
EMA: Price has reclaimed the short-term EMAs, indicating bullish momentum on lower timeframes
RSI: Rising above 50 but not yet overbought – there’s room for further upside
Volume: Increasing volume during the bounce confirms buying strength
Trading Strategy:
- Bullish Scenario (Preferred): Entry Zone: Watch for pullback toward 3,290 – 3,292
Stop Loss: Below 3,285
Take Profit 1: 3,300
Take Profit 2: 3,304
Extended Target: 3,308 – 3,312 (if bullish momentum continues beyond breakout zone)
- Bearish Scenario (Alternate): Only valid if price breaks and closes strongly below 3,286
Short Target: 3,274 – 3,270
Note: Counter-trend strategy – higher risk, requires strong confirmation
Conclusion: Gold is showing a bullish price structure on the 15-minute chart. As long as price holds above the 3,286 – 3,289 support zone, the path of least resistance appears to be upward, with 3,300 and 3,304 as the next logical targets. Monitor price action closely during the U.S. session for a potential long setup.
- Follow for more real-time gold trading strategies and save this idea if you find it helpful!
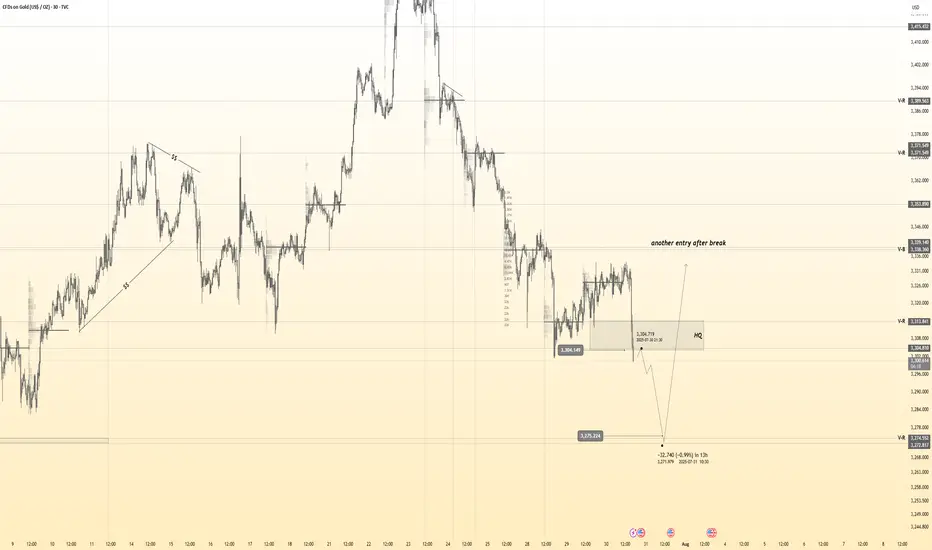
Gold 30Min Engaged ( Buy & Sell Reversal Entry Detected )Time Frame: 30-Minute Warfare
Entry Protocol: Only after volume-verified breakout
🩸Bearish Reversal - 3304
🩸Bullish Reversal - 3275
➗ Hanzo Protocol: Volume-Tiered Entry Authority
➕ Zone Activated: Dynamic market pressure detected.
The level isn’t just price — it’s a memory of where they moved size.
Volume is rising beneath the surface — not noise, but preparation.
🔥 Tactical Note:
We wait for the energy signature — when volume betrays intention.
The trap gets set. The weak follow. We execute.
Macro View on EUR/USDMonetary Policy Divergence
The Federal Reserve maintained its target federal funds rate at 4.25 – 4.50 percent, citing a resilient labour market and persistent inflationary pressures (Federal Reserve, 2025).
By contrast, the European Central Bank’s deposit facility rate stands at 2.00 percent, reflecting its earlier tightening cycle and more cautious approach to rate cuts (Federal Reserve Bank of St. Louis, 2025).
Inflation Differential
U.S. headline CPI rose 2.7 percent year-on-year in June 2025, with core CPI at 2.9 percent (U.S. Bureau of Labor Statistics, 2025).
Euro-area inflation was 2.0 percent in June, broadly in line with the ECB’s target (Eurostat, 2025).
Yield Spread
The 10-year U.S. Treasury yield hovered around 4.38 percent, versus roughly 2.4 percent on the bund, underpinning dollar strength (Federal Reserve Bank of St. Louis, 2025).
Growth Outlook
The U.S. economy continues to outperform, supported by robust consumption and a tight labour market.
Advanced-economy growth is projected at 1.4 percent in 2025, with the euro-area likely trailing, given headwinds from energy costs and subdued investment (International Monetary Fund, 2025).
Technical Structure
Downtrend in Place: Recent price action shows a break of the 20-day MA and loss of structure below 1.1700.
Supply Zone near 1.1750–1.1800 offers resistance.
Demand Zones at 1.1100–1.1200 and 1.0750–1.0850 coincide with long-term trendline support (see chart).
Outlook & Scenarios
Near-Term Bearish: Continued USD strength and fading risk appetite may drive EUR/USD toward the 1.1100 demand zone.
Medium-Term Range: If ECB signals a dovish pivot and U.S. data disappoints, expect a bounce into 1.1200–1.1400.
Key Pivot: A sustained break below 1.0750 would open targets toward 1.0200, the “discount” zone from late 2024.
References
European Central Bank. (2025, August 1). ECB deposit facility rate for euro area (ECBDFR) . FRED, Federal Reserve Bank of St. Louis.
Eurostat. (2025, June). Inflation in the euro area . ec.europa.eu
Federal Reserve. (2025, July 30). Federal Reserve issues FOMC statement. www.federalreserve.gov
Federal Reserve Bank of St. Louis. (2025, July 30). Market yield on U.S. Treasury securities at 10-year constant maturity . FRED.
International Monetary Fund. (2025, July). World Economic Outlook Update: July 2025. www.imf.org
U.S. Bureau of Labor Statistics. (2025, July). Consumer Price Index Summary – June 2025. www.bls.gov

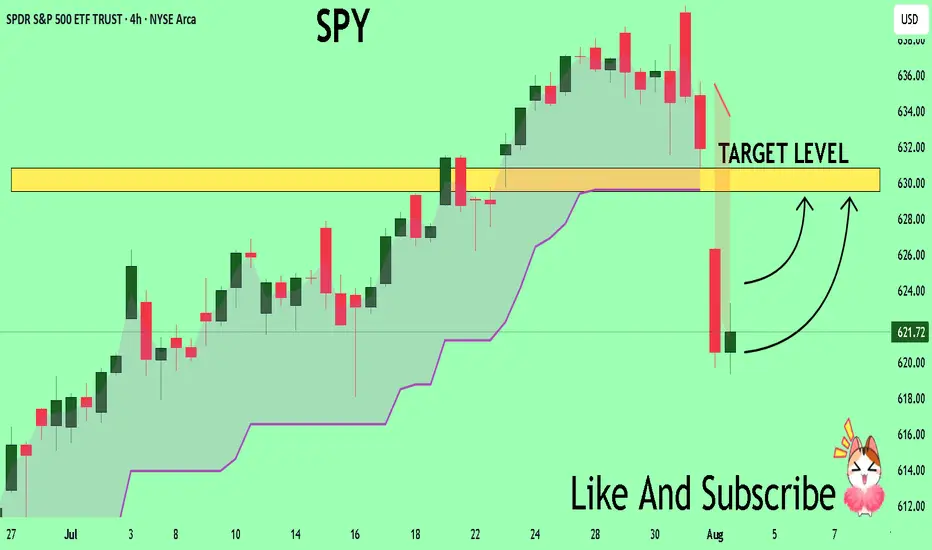
SPY Massive Long! BUY!
My dear subscribers,
My technical analysis for SPY is below:
The price is coiling around a solid key level - 621.72
Bias - Bullish
Technical Indicators: Pivot Points Low anticipates a potential price reversal.
Super trend shows a clear buy, giving a perfect indicators' convergence.
Goal - 629.55
About Used Indicators:
By the very nature of the supertrend indicator, it offers firm support and resistance levels for traders to enter and exit trades. Additionally, it also provides signals for setting stop losses
Disclosure: I am part of Trade Nation's Influencer program and receive a monthly fee for using their TradingView charts in my analysis.
———————————
WISH YOU ALL LUCK
EUR/USD Elliott Wave Count Signals Downside TargetsThe EUR/USD chart is displaying a completed 5-wave Elliott impulse structure, suggesting the potential start of a larger corrective move to the downside. Wave 5 appears to have finished after a classic ending diagonal pattern, with price now breaking below the wave 4 support trendline — a strong confirmation of trend exhaustion.
Currently, price is retracing upward towards the 0.5–0.618 Fibonacci retracement zone of the last impulsive leg, around 1.15912–1.16383, which may serve as the final rejection zone for bears to re-enter. This area aligns perfectly with prior support-turned-resistance and is considered the potential reversal pocket.
If price holds below the 1.17869 invalidation level, the structure supports the beginning of an ABC correction or a larger bearish impulse.
Target 1 (T1): 1.14800
Target 2 (T2): 1.13915
Stop Loss (SL): 1.17869
This scenario remains valid as long as the price does not break above 1.17869. A clean break and close above this level would invalidate the bearish setup and suggest a possible wave extension.

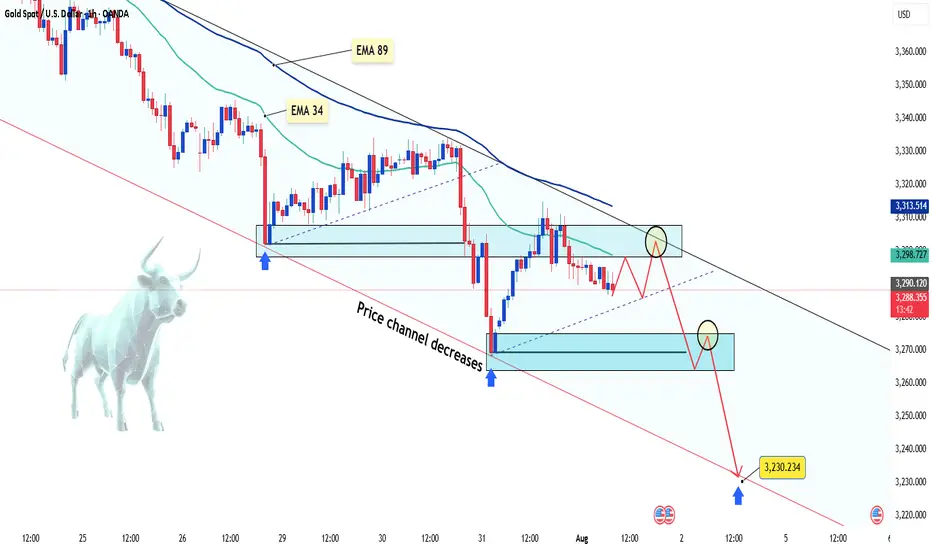
Gold keeps falling – is there more to come?Hello everyone, great to see you again!
Today, gold remains under pressure following a series of strong U.S. economic data releases, which have reinforced expectations that the Federal Reserve will keep interest rates elevated for longer. As a result, the U.S. dollar has strengthened, Treasury yields have climbed, and gold has lost its footing.
On the H1 chart, XAUUSD is clearly trading within a descending price channel. Both the EMA 34 and EMA 89 are acting as dynamic resistance zones. Recent attempts to rally have consistently failed at these levels, mirroring the bearish setup seen before July 29.
Currently, price is retesting a minor resistance area. If this retest fails, the next downside targets lie near 3,270 – and potentially down to 3,230 USD, which aligns with the lower boundary of the price channel.
From my perspective, the bearish momentum is likely to continue.
What about you? How do you think gold will close the day?
Will you have a change to enter $4 per $LINK This will be truth in the next few months then we will have a very very good entry at $4 per BIST:LINK
