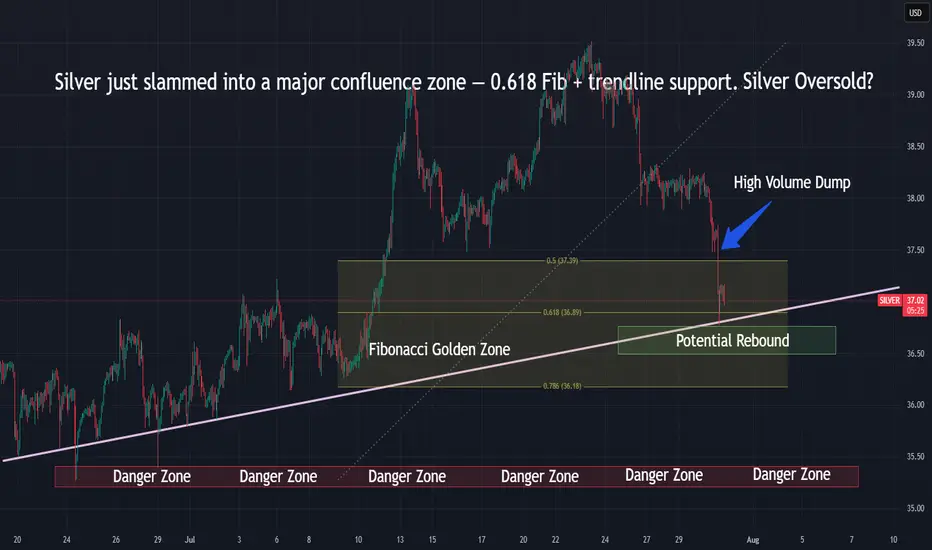
Silver Hits Fibonacci Support — Rebound or Dump?Silver just slammed into the 0.618 Fib — a key reversal zone.
📌 Eyes on bounce or breakdown toward the danger zone below $36
⏱️ Timeframe: 1H
#silver #xagusd #fibonacci #commodities #tradingstrategy #tradingview #quanttradingpro
Wave Analysis
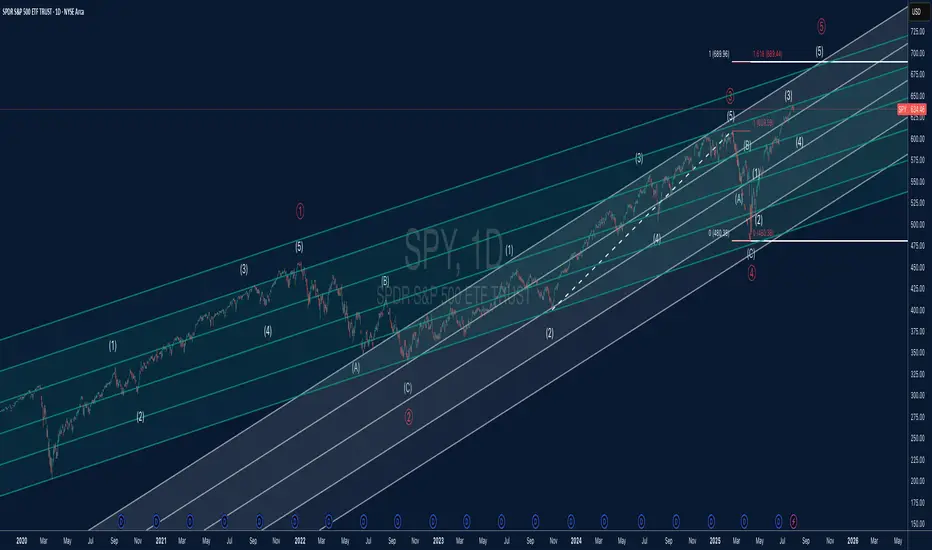
SPY Elliott Wave + Parallel Channel AnalysisThis chart offers a detailed Elliott Wave count for SPY (S&P 500 ETF) on the daily timeframe, combined with a structured parallel channel system to highlight key trend dynamics.
🔍 Elliott Wave Structure:
The price is currently advancing in what appears to be Wave (5) of Primary Wave ⑤, suggesting we may be in the late stages of a major impulsive cycle.
Each impulsive and corrective wave is clearly labeled, with the internal structure confirming classic Elliott Wave symmetry.
The 1.618 Fibonacci extension around $689 marks a critical upside target and potential completion zone for Wave (5).
Wave (4) held well at the lower channel boundary and completed near $480, establishing a solid base for the current advance.
📊 Channel Insights:
A system of parallel channels is applied to capture the overall trend and momentum structure.
Price is climbing toward the upper boundary of the long-term ascending channel, which has acted as dynamic resistance in previous waves.
The median lines have provided reliable support and resistance throughout the trend, making them important reference levels moving forward.
⚠️ Key Technical Levels:
Resistance: $689.44 (Wave ⑤ target at 1.618 Fib extension)
Support Zones: $609 (prior Wave (3) high), $575 (mid-channel support), and $480 (major cycle low)
A confirmed break above $690 could suggest a parabolic move, but risk of reversal grows as the upper channel is tested.
📈 Market Outlook:
SPY remains in a strong uptrend but is nearing a major confluence of wave and channel resistance.
A completed five-wave sequence would suggest the potential for a higher-degree correction, possibly leading into a Wave A/B/C scenario.
Short-term bullish bias remains valid while above $609, but watch for divergence or exhaustion signs near $689–$700.
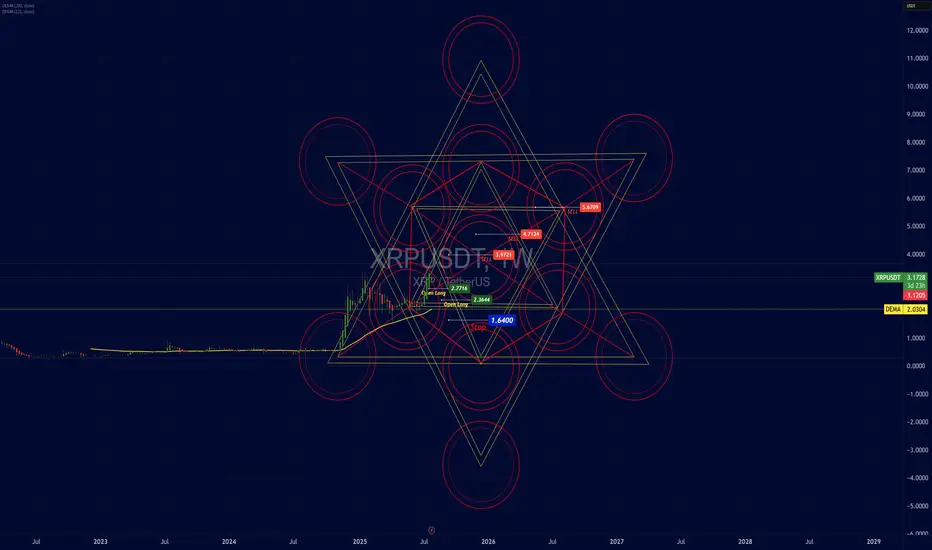
Analytical Geometry Strategy Applied to the Market — XRP/USDTAnalytical Geometry Strategy Applied to the Market — XRP/USDT
Position Trader: Action Based on the Structural Geometry of the Metatron's Cube
Operational Introduction
In medium to long-term strategic positioning (position trading), market entry must not be random or emotional — it must be grounded in predictable zones of symmetry and imbalance.
For that, we apply Analytical Geometry to chart structure, using the Metatron’s Cube — a three-dimensional geometric figure composed of 13 spheres and 78 interlinked vector lines.
The cube is a projection from a six-dimensional hyperplane onto the 2D Cartesian plane. Its application on the chart allows us to:
Delimit areas of vector confluence (support/resistance)
Identify angular energy zones and technical pressure points
Anticipate critical price inflection points based on mathematical symmetry
Structural Application on the XRP/USDT Chart
The projection of Metatron’s Cube onto the XRP/USDT chart reveals:
Entry points (Open Long) located at the lower inner vertices of the cube, where vectors converge toward the central axis — the liquidity attraction point
Supply zones (Sell) aligning with circular and angular intersections of the lines, where multiple vectors overlap — indicating movement saturation and possible redistribution
Stops placed below the angular base, representing a break in symmetry (the point where the vector loses cohesion with the model)
Structural Coordinates (Based on Vector Analysis)
Entry Points (Open Long):
Point A: (x = 2.6444, y = 0)
Point B: (x = 2.7176, y = 0)
Strategic Stop:
Point C: (x = 1.6400, y = -1), just below the lower angular base — a vector dispersion zone
Technical Targets (Supply Zones):
Level 1: x = 3.9721 (first circular layer)
Level 2: x = 4.7124 (72° expansion — common in golden ratio geometry)
Level 3: x = 5.6709 (structural exhaustion zone)
Technical Justification: Why Analytical Geometry Works
Analytical Geometry, developed by René Descartes, allows for the representation of curves, vectors, and spatial structures using numerical coordinates.
Metatron’s Cube functions as a vector mesh over the price chart — translating market behavior into a mathematical language of:
Proportions
Intersections
Angular projections
This approach enables us to:
Model price behavior as a multivariable function
Anticipate reaction zones based on angular and linear symmetry
Protect capital with stops anchored in vector-based rupture zones
Scientific Relevance
Metatron’s Cube is not merely symbolic — it remains actively used in modern physics and aerospace engineering.
At NASA, geometries derived from the Cube are applied to:
Orbital simulations
Spatial perimeter calculations on nonlinear geodesics
Angular mass distribution in interplanetary navigation systems
The same mathematical foundation used to understand celestial body dynamics is used here to identify repeatable behavior patterns in the market — with a high degree of precision.
Technical Conclusion
The market’s geometric structure is not random — it is vectorial, symmetrical, and proportional
Using Metatron’s Cube as a geometric projection allows for rational and coordinated alignment of entry, stop, and target points
The first target has already been validated, proving the structure’s effectiveness
The position remains active, with upper targets defined by vector intersections and angular saturation zones
Closing Insight
"The market’s geometry is the invisible code behind apparent movement. He who understands the vectors, masters the cycles."
This strategic model combines analytical geometry, energetic symmetry, and technical foundation in a unified framework — with precision, logic, and harmony.
NATGAS Free Signal! Buy!
Hello,Traders!
NATGAS went down and
Almost reached the horizontal
Support of 3.014$ from where
We can enter a long trade
With the Take Profit of 3.066$
And the Stop Loss of 2.981$
Buy!
Comment and subscribe to help us grow!
Check out other forecasts below too!
Disclosure: I am part of Trade Nation's Influencer program and receive a monthly fee for using their TradingView charts in my analysis.

EUR/USD Latest Update TodayHello everyone, what do you think about FX:EURUSD ?
EUR/USD previously broke the downward price channel, but failed to maintain the momentum, leading to a strong correction phase. Currently, the price is trading around 1.156 and testing key Fibonacci levels, with the 0.5 - 0.618 levels marked as potential reversal zones, as highlighted in the analysis.
With the current market sentiment, the strong recovery of the USD has been the main factor driving the EUR/USD movement in recent days. Positive economic data from the US has strengthened the US dollar, decreasing the appeal of gold and safe-haven assets like the EUR. Furthermore, expectations surrounding Fed policy decisions continue to add pressure on EUR/USD, with investors bracing for the possibility of the Fed maintaining high interest rates for a longer period.
For traders, it's clear that the bearish trend is in favor, as indicated by the EMA reversal. The Fibonacci levels 0.5 (1.164) and 0.618 (1.161) will be crucial zones, where reaction signals could open opportunities for SELL positions. The next target will be at Fib 1 and Fib 1.618.
That's my perspective and share, but what do you think about the current trend of EUR/USD? Leave your comments below this post!

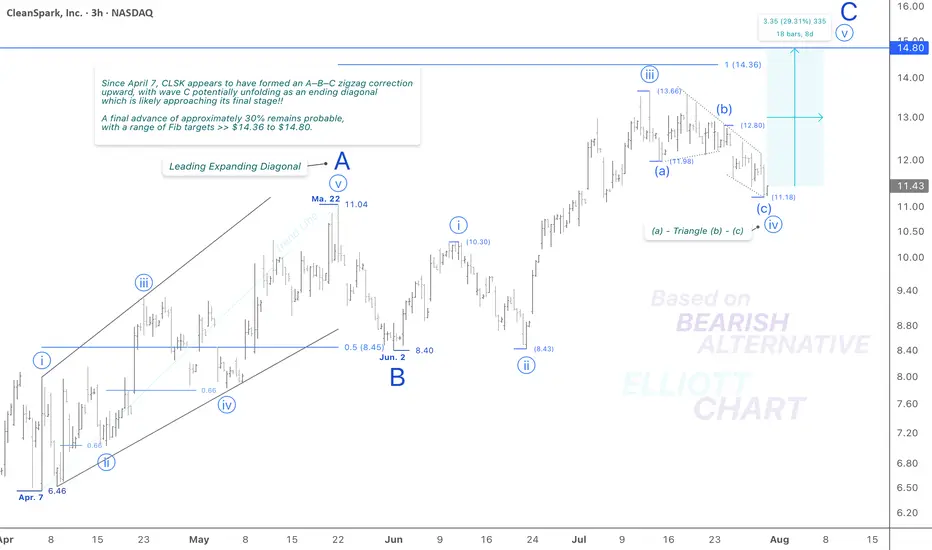
CLSK / 3hToday’s unexpected 2.6% decline, along with the continued development of an ending diagonal in the final leg of the correction, supports a reversion to the previously considered structure: an formation for wave iv (circled). This revised interpretation aligns more closely with the current price action and wave behavior.
I continue to view Minor wave C as an impulsive sequence as well, which now appears to be entering its final stage—an anticipated advance in wave v (circled), with a projected Fib target in the 14.36–14.80 range.
Wave Analysis >> While the current outlook on NASDAQ:CLSK remains consistent with previous analysis, the 3-h frame above shows that Minor wave C—completing the corrective advance of wave (B)—appears to be unfolding in an impulsive sequence, likely entering its final stages.
Within this structure, Minute wave iv (circled) has taken the form of an correction. A final push higher in Minute wave v (circled) is now anticipated, which would complete the ongoing wave C and, in turn, mark the conclusion of the countertrend advance in Intermediate degree wave (B).
Trend Analysis >> Upon completion of Minor wave C, a broader trend reversal to the downside is anticipated, marking the beginning of the final decline in Intermediate wave (C). This bearish phase may develop over the coming months and could persist through the end of the year.
#CryptoStocks #CLSK #BTCMining #Bitcoin #BTC
NASDAQ:CLSK MARKETSCOM:BITCOIN CRYPTOCAP:BTC BITSTAMP:BTCUSD
EURUSD market structure analysis on M15, H1 timeframesH1 Timeframe – Main Trend: BULLISH
🟢 Current Situation:
The H1 structure is showing a clear sequence of Higher Highs (HH) and Higher Lows (HL) ⇒ indicating an uptrend.
The market is currently in a retracement phase following the last bullish impulse.
Price is approaching a demand zone from a previous structure, where buy orders may be stacked.
📉 M15 Timeframe – Main Trend: BEARISH (within H1 pullback)
🔍 Current Observations:
While H1 is in a retracement, M15 shows a clear bearish market structure (Lower Lows – Lower Highs).
However:
Price has tapped into the H1 demand zone.
A liquidity grab (sweep of highs/lows) just occurred on M15.
This was followed by a Break of Structure (BOS) to the upside ⇒ signaling potential absorption of sell-side liquidity and a reversal in alignment with the higher timeframe (H1).

USD-JPY Will Keep Growing! Buy!
Hello,Traders!
USD-JPY keep growing and
The pair made a bullish breakout
Of the key horizontal level
Of 149.181 and the pair is
Already retesting the new
Support and we will be
Expecting a further
Bullish move up
Sell!
Comment and subscribe to help us grow!
Check out other forecasts below too!
Disclosure: I am part of Trade Nation's Influencer program and receive a monthly fee for using their TradingView charts in my analysis.

BLDE – VolanX Smart Cycle Activation📈 BLDE – VolanX Smart Cycle Activation
Timeframe: Weekly
Posted by: WaverVanir International LLC | VolanX Protocol
Model: Accumulation → Manipulation → Expansion
After multiple Breaks of Structure (BOS) and prolonged markdown, BLDE has now confirmed a Smart Money Accumulation Cycle. A clear manipulation sweep below prior lows has triggered the upside phase. This chart follows the classic SMC model with:
🔹 Accumulation → Trap → Manipulation → Expansion
🔍 Key Observations:
Accumulation zone: $2.00–$4.00
Trap high: ~$5.00 (liquidity run & rejection)
Clean reclaim of $3.92 structure now acting as launchpad
Next zones of interest:
• $6.35
• $6.58
• $6.76
• Ultimate distribution zone: $9.90
📊 VolanX Thesis:
We are entering a Mark-Up Phase consistent with the VolanX Alpha Expansion Model. As liquidity rotates upward, expect a stair-step climb toward the equilibrium zone near $9.90.
🧠 Strategic Insight:
If price pulls back into the $3.92–$4.10 range, that would be considered a high-probability re-entry for bulls aligned with institutional footprints.
🛡️ Risk Lens:
Monitor for early distribution at $6.76. VolanX Guardian Protocol flags rising volume anomalies in that range.

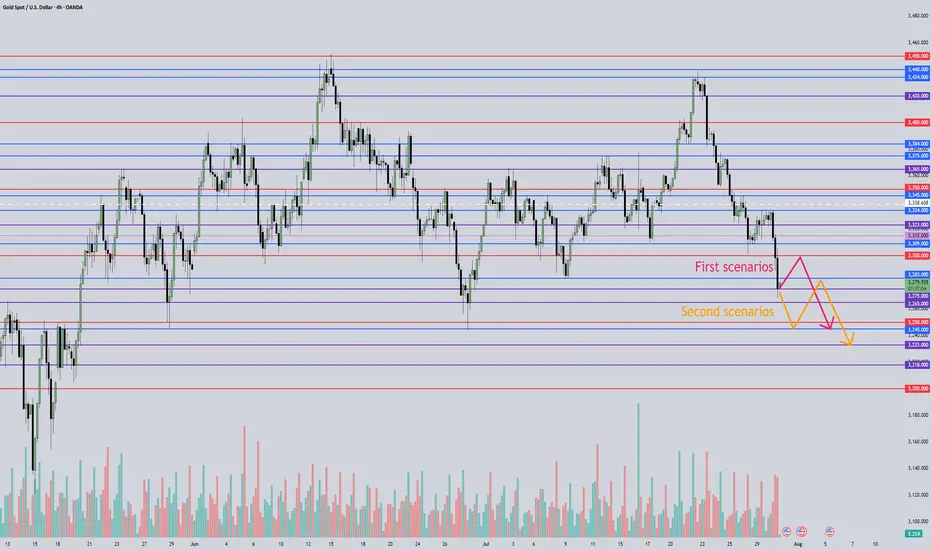
July 31, 2025 - XAUUSD GOLD Analysis and Potential OpportunitySummary:
The Fed held interest rates unchanged, and Powell’s remarks reduced the likelihood of a rate cut in September — this is fundamentally bearish for gold. Until new fundamental developments emerge, the strategy remains: sell on rallies into resistance.
After reviewing the 4H chart, I see two possible scenarios:
Price continues down to 3245, pulls back to 3283, then resumes the drop toward 3245 or even lower.
Price pulls back immediately toward 3300, then resumes the downtrend toward 3245.
These are ideal cases — I will still wait for clear confirmation before taking action.
🔍 Key Levels to Watch:
• 3323 – Resistance
• 3309 – Resistance
• 3300 – Psychological level
• 3283 – Key resistance
• 3268 – Short-term support
• 3260 – Support
• 3245 – Major support
• 3233 – Support
📈 Intraday Strategy:
• SELL if price breaks below 3268 → target 3265, then 3260, 3255, 3250
• BUY if price holds above 3283 → target 3289, then 3295, 3300, 3305
👉 If you find this helpful or traded using this plan, a like would mean a lot and keep me motivated. Thanks for the support!
Disclaimer: This is my personal view, not financial advice. Always use proper risk control.
GRANULES india ltd - short term trend - bearishaccording to EWP analysis, Granules india Ltd
from the bottom of 422 to 547 price has unfolded in Flat correction
wave (B) retraced wave (A) X more than 78.6%
Wave(C) projected wave (A) X 1.618%
from the top of 547 to 478 is impulsive wave (1)
from 478 to 511 price is unfolded in extended flat corrective wave format.
from price 511 to down trend is identified as wave(3) in progress
followed expecting impulsive wave towards down trend or another correction resulting in complex correction.
target for impulsive wave(3) would be 400 -wave(A) X1.618%

AUDCAD Resistance Ahead!
HI,Traders !
#AUDCAD is trading in an
Uptrend but the pair is locally
Overbought so after the pair
Hits the horizontal resistance
Level of 0.90210 we will be
Expecting a local bearish
Move down !
Comment and subscribe to help us grow !

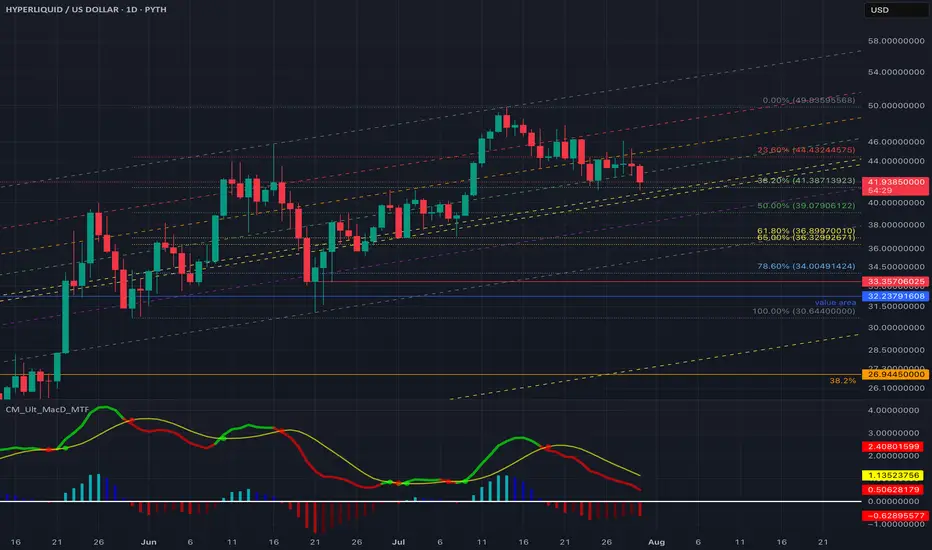
Analyzing Healthy Pullback on $HYPE with Fibs + RSIAfter a strong rally to ~$49.83, PYTH:HYPEUSD is now retracing into a critical Fibonacci confluence zone — a key moment to watch as we position for the next potential leg up.
Key Observations
Price is hovering around Fib 0.382 and nearing the Fib Channel 0.618
RSI is approaching oversold (currently ~32)
MACD remains bearish with momentum still building
If the golden pocket zone (~$39–$40) holds, it could mark the end of this short-term correction.
Trade Setup to Watch
When price taps the $39–$40 level, we will be looking for
✅ MACD crossover on lower timeframes
✅ Bullish RSI divergence
Because this could signal a short-term bounce opportunity.
So, I am expecting the entry zone around $39.0 – $40.0
TP1 - $44.4 (Fib 0.236 – first resistance)
TP2 - $49.8 (Previous swing high)
TP3 - $53–$55++ (Extension target if bullish continuation resumes)
If there is any changes in the macro environment, we also have a contingency plan to buy more lower. If price breaks below the golden pocket, strong support lies in the $30–$33 region. So we will do big accumulation there. It is a huge discounts imo. It is like 5% of probability to actually happen at the current market condition though.
Even a deeper move toward $27 (TOTALLY unlikely at the moment!) would be a mega long opportunity. When it happens, it should not be a breakdown panic.
Final Thoughts
Current price action appears to be a standard pullback.
The confluence of Fib retracement + channel support makes this a high-probability bounce zone.
Watch for bullish divergence or volume spike between $36–$39
Patience now = Better positioning later.
EURUSD Bear dominating the market30th June Daily candle closed with strong bearish.
we could observed a drop-base-drop candle pattern in a lower time frame.
for today plan:-
i will wait at the "base" area around 1.147*** area for the bearish signal.
calculate your own risk & reward.
Good luck

XAUUSD Update CONSOLIDATIONAfter bullish rejection, Gold make a new lower and break 3283 support level.
Now it seemslike bounce to make a correction and retest 3305 resistance.
If 3305 reject, price will continue moving downside and retest 3245 support.
If it break 3245...it will continue to find it support, near 3205 support zone.
Have a blessing day !

Gold Wave Analysis – 30 July 2025- Gold falling inside wave b
- Likely fall to support level 3250.00
Gold is under bearish pressure after the price broke the two upward-sloping support trendlines from May and February.
The breakout of these support trendlines accelerated the active short-term correction b – which belongs to the impulse wave 3 from June.
Gold can be expected to fall further to the next round support level 3250.00 (former low of waves 2 and (b) from May and June).

RDDT Earnings Play — July 30 (BMO)
## 🚀 RDDT Earnings Play — July 30 (BMO)
**🎯 Bullish Call Trade | 75% Confidence | High Momentum Setup**
---
### 📈 REDDIT, INC. (RDDT) – EARNINGS SNAPSHOT
🧠 **Revenue Growth**: +61.5% TTM — AI + Ads combo paying off
💸 **Margins**:
• Gross: 90.8% ✅
• Op: 1.0% 🚩
• Profit: 8.1% 👍
🧾 **EPS Surprise Streak**: ✅ 5 for 5 | Avg. +191%
🎯 **Target Price**: \$155.58 (+9.5%)
⚖️ **Forward P/E**: 222.6 — Rich but justified?
**Score: 8/10**
📊 Sector: Comm Services (AI-driven tailwinds)
---
### 💥 OPTIONS FLOW SNAPSHOT
💰 Calls Stack at \$150 & \$160
🛡️ Puts cluster \$140–\$149 = Hedges, not bearish bets
📉 IV High = Juicy premiums
📈 Gamma Bias: Positive Skew
**Score: 7/10**
---
### 🔍 TECHNICAL CHECK
📍 Price: \~\$145.32
🧭 20D MA: \$147.89
📊 RSI: 59.5 (Momentum neutral, room to run)
🔓 Resistance: \$150
🛡️ Support: \$140
**Score: 6/10**
---
### 🌎 MACRO CONTEXT
🧠 Sector tailwinds from AI hype + digital ad rebound
🛑 No major regulatory red flags
**Score: 8/10**
---
## 🔥 THE TRADE SETUP
**📈 Direction**: Bullish
🎯 **RDDT 08/01 \$150C**
💸 **Entry**: \$9.55
🛑 **Stop Loss**: \$4.78
📈 **Target**: \$19.55+
🧮 **Size**: 1 Contract = \$955 Risk
🕒 **Entry Timing**: Pre-earnings close
📆 **Earnings Time**: BMO (Before Market Open)
📊 Expected Move: \~5%
📈 Setup = High risk / High reward, theta-sensitive
---
## ⚡ TRADE PLAN
✅ Take partial profit at 100%, full at 200%
⏳ Exit within 2H post-ER if target unmet
🛑 Cut below \$4.78 to cap drawdown
---
## 🧠 CONVICTION SCORE
🎯 75% Bullish Bias
📊 Based on fundamentals, options, and flow
📉 Risk = Valuation + Thin Op Margin
📈 Reward = Explosive upside w/ surprise history
---
💬 **Watch for \$150 breakout. If cleared post-ER = moonshot to \$160 possible.**
📢 #RDDT #EarningsTrade #RedditStock #CallOptions #AIStocks #TechMomentum #OptionsFlow #IVSurge #TradingViewIdeas #SwingTrade #OptionsStrategy #VolatilityPlays #RDDTstock

XAUUSD Long@3275 TP@3350 SL@3243XAUUSD
Long@3275
TP@3350
SL@3243
It is better to long XAUUSD@3275 as the price hold above the dow theory of daily and weekly timeframe. Good risk/reward ratio. Target for 3350.

META Earnings Trade Setup — July 30 (AMC)
## 🧠 META Earnings Trade Setup — July 30 (AMC)
📈 **META (Meta Platforms Inc.)**
💥 **Confidence**: 85% Bullish
💡 **Play Type**: Pre-earnings call option
📊 **Fundamentals + Flow + Setup = High Conviction Swing**
---
### 📊 FUNDAMENTALS SNAPSHOT
✅ **Revenue Growth**: +16.1% YoY
✅ **Profit Margin**: 39.1%
✅ **Gross Margin**: 81.8%
📈 **8/8 EPS Beats** — Avg Surprise: +13%
🧠 **Digital Ad Rebound + AI Integration = Growth Engine**
🟢 **Score: 9/10**
📌 Bottom line: Elite execution + consistent guidance beats
---
### 🔥 OPTIONS FLOW CHECK
💰 **Call Walls**: \$720 / \$730
📈 **Call/Put Skew**: Bullish tilt
🔎 **IV Rank**: 0.65 — High enough for a move, not extreme
📈 **Market Expectation**: \~6% move
🟢 **Score: 8/10**
📌 Institutional flow leans long — smart money eyes upside
---
### 📉 TECHNICAL SETUP
📍 **Price**: \~\$700
📉 RSI: 34.34 → OVERSOLD
📉 20D MA: \$713.27 (near-term bounce target)
📌 Support: \$692.50 | Resistance: \$720
🟡 **Score: 7/10**
📌 Post-consolidation rebound setup into earnings
---
### 🌎 MACRO CONTEXT
💡 Growth + AI names in focus
📢 Communication Sector → Risk-On Rotation
📌 META riding digital ad/AI secular trends
🟢 **Score: 8/10**
📌 Macro tailwinds match company strengths
---
## 🎯 TRADE IDEA
**META 08/01 \$730 CALL**
💵 Entry: \$10.00
🎯 Target: \$30.00 (300% ROI)
🛑 Stop: \$5.00 (50% loss cap)
⏰ Entry: Pre-close on July 30 (AMC earnings)
📏 Size: 1 Contract (Risk \$1,000 max)
### ⚖️ Risk/Reward
* Max Risk: \$1,000
* Target Profit: \$3,000
* IV Crush Protection: **Exit within 2 hours post-earnings**
---
## 📌 WHY IT WORKS
✅ Meta beats 8 straight quarters
✅ Fundamentals elite
✅ Bullish options stack
✅ Oversold tech setup
⚠️ Risk? Always — but *structured speculation wins* 📐
---
📣 Tag someone who trades earnings like a sniper 🎯
\#META #EarningsPlay #OptionsTrading #IVCrush #CallOptions #TechStocks #AIStocks #TradingView #DigitalAds #SwingTrade #StructuredRisk

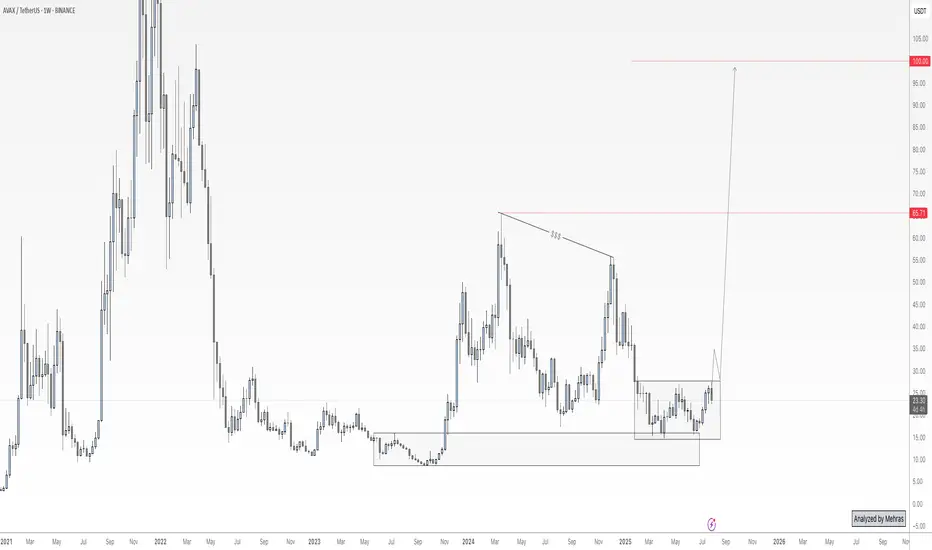
AVAX – Hidden Chance for Latecomers🔥AVAX – High-Potential Setup Amid Market Catch-Up
While many crypto assets have surged in the recent bullish wave, AVAX appears to have been left behind — and that could present a high-reward opportunity ahead.
From both a fundamental and on-chain perspective, this project shows promising signs, especially with notable activity among whale wallets. I believe AVAX has the potential for a strong long-term rally — but there’s one critical condition to watch.
Price has recently reacted to a key custom demand zone. However, for confirmation of buy-side strength, we need to see a clean breakout and daily close above the ~$28 level. If that breakout is confirmed, I’ll be looking to accumulate for a long-term hold, with a target of $65 — and possibly up to $100 if momentum continues.
That said, risk management remains my top priority. I’ll allocate no more than 3–4% of my total portfolio to this position.
Keep an eye on the $28 breakout. If the trade is triggered, I’ll provide updates here.
🔁 This analysis will be updated whenever necessary.
Disclaimer: This is not financial advice. Just my personal opinion.
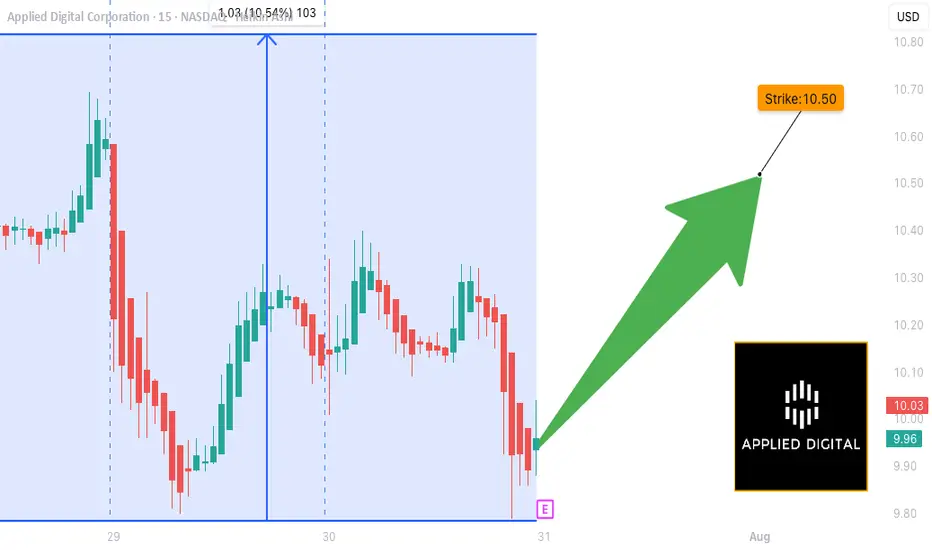
APLD (Applied Digital):EARNINGS TRADE SETUP (2025-07-30)
🚨 **EARNINGS TRADE SETUP: APLD (Applied Digital)**
🗓️ Earnings: **July 31 (AMC)**
💥 Confidence: **65% Moderate Bullish**
🔥 Recent Run: **+94% past 3 months**
🧠 AI Infrastructure Hype + High IV = Opportunity
---
### 📊 FUNDAMENTALS SNAPSHOT
🟢 **Revenue Growth**: +22.1% YoY
🔴 **Profit Margin**: -110.4%
🔴 **Operating Margin**: -34.7%
⚠️ Historical EPS Beat Rate: **12% only**
📈 Analyst Target: **\$14.61** (+42.8% upside)
🔎 **Verdict**: High growth, deep losses — speculative with upside
---
### 🧠 OPTIONS FLOW
💣 **High IV Crush Risk**
🟥 **Put Wall**: \$10.00 (6,700 contracts)
🟩 **Speculative Calls**: \$10.50 & \$11.00 loaded
⚖️ Mixed Sentiment → Tilted Bullish
---
### 📉 TECHNICAL CHECK
💹 Price: **\$10.12**
📉 Below 20D MA (\$10.31)
📌 Support: **\$10.00**
📌 Resistance: **\$10.50**
⚠️ RSI Cooling → Watch for breakout or rejection
---
### 💥 TRADE IDEA
**🎯 Call Option — Strike \$10.50 — Exp 08/01**
💵 Entry: \$0.57
🚀 Profit Target: \$2.28 (200–400% ROI zone)
🛑 Stop Loss: \$0.285
📈 Size: 1 contract (2% of portfolio)
🕓 Exit: 1–2 hours post earnings to avoid IV crush
---
### 🧠 TRADE LOGIC
Risky setup — but technicals + AI narrative + speculative flow = **earnings lotto ticket with strategy.**
💬 *"Speculation with structure beats blind YOLO."*
---
📌 Tag a trader who likes calculated risk 📈
📉 Don’t forget to scale OUT, not just IN.
\#APLD #EarningsPlay #OptionsTrading #TradingView #AIStocks #YOLOWithStops #IVCrushProof #CallOptions #SwingTrade #BullishSetup
MSFT Earnings Play (2025-07-31) — STRONG BULLISH SETUP
**🚨 MSFT Earnings Play (2025-07-31) — STRONG BULLISH SETUP 🚨**
**Microsoft \ NASDAQ:MSFT Pre-Earnings Trade Idea — 545C (Aug 1)**
---
### 🧠 **Earnings Thesis (🔥 80% Conviction)**
MSFT is set to report **BMO July 31**, and all signs point *bullish*:
📈 **Revenue Growth**: +13.3% YoY, driven by **AI + Cloud** momentum
💰 **Margins**: Profit 35.8%, Op 45.7%, Gross 69.1% — textbook pricing power
📊 **Guidance**: 100% beat history, avg. +5.8% surprise
📌 **Analyst Consensus**: 💪 Strong Buy | Target: \$549.90
📊 **Sector Tailwinds**: Tech favored in current macro with Fed on hold
➡️ **Score: 9/10 Fundamentals | Bullish Momentum Across the Board**
---
### 🔍 **Options Flow & Technicals**
🔥 **Implied Move**: \~6.3% by Aug 1
📉 **IV Rank**: 0.75 (Room to expand post-earnings)
💸 **Call Flow**: Strong OI in 540–550 zone, gamma buildup may fuel squeeze
📊 **RSI**: 70.14 → Bullish, close to overbought
📈 **Support**: \$505 | **Resistance**: \$518.29
➡️ **Score: 8/10 Options | 8/10 Technicals**
---
### 🧨 Trade Setup: 545 CALL (Aug 1 Exp)
🎯 **Entry Price**: \$0.90
📅 **Expiry**: 2025-08-01
📈 **Profit Target**: \$1.80 (⚡️+100%)
🛑 **Stop Loss**: \$0.45
📐 **Size**: 2 contracts (2% portfolio risk)
💡 **Timing**: Enter **EOD July 30 (Pre-earnings)**
⚠️ **IV Crush Alert** → Exit within 2 hours *post-earnings*
---
### ✅ RISK PLAN
* Position: Max 2–3% of portfolio
* IV crush & gap protection: Tight stop and quick post-earnings exit
* Exit Plan: \$1.80 or Stop \$0.45, OR close manually after earnings move
---
📊 **Trade JSON Snapshot**
```json
{
"ticker": "MSFT",
"direction": "CALL",
"strike": 545,
"entry": 0.90,
"target": 1.80,
"stop": 0.45,
"expiry": "2025-08-01",
"entry_time": "EOD Jul 30",
"earnings_date": "2025-07-31 BMO",
"confidence": "80%",
"expected_move": "6.3%",
"iv_rank": "0.75"
}
```
---
🧠 **Summary**
MSFT is poised for a **clean earnings beat** with bullish fundamentals, strong options flow, and upside momentum. This is a **high-conviction, short-dated trade** with defined risk.
🎯 **Watchlist it. Size smart. Exit fast.**

Apple - The next major push higher!🍎Apple ( NASDAQ:AAPL ) will head for new highs:
🔎Analysis summary :
Apple has been underperforming markets for a couple of months lately. However technicals still remain very bullish, indicating an inherent and substantial move higher soon. All we need now is bullish confirmation and proper risk management and this setup looks very decent.
📝Levels to watch:
$200, $300
🙏🏻#LONGTERMVISION
Philip - Swing Trader
