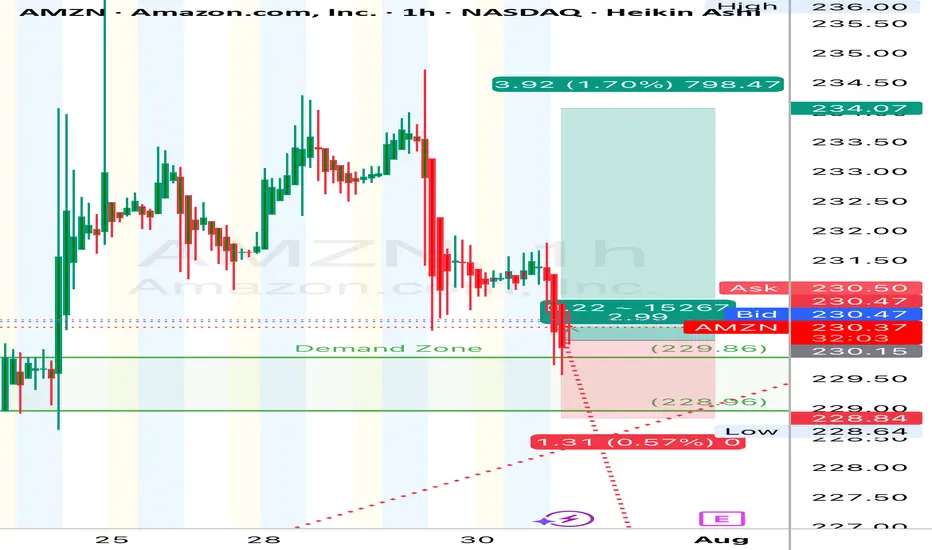
(AMZN) | 1H Chart Long
“Buyers defended the zone hard. Tight bull flag breakout setup forming after the demand tap. Looks like this thing wants to take another leg up. Clean R/R if managed tight.”
Price surged impulsively from mid-July lows, followed by a shallow correction—suggestive of a micro **Wave 4**.
* Current bounce off demand zone implies the potential start of **Wave (5)** to retest or break highs.
* **Demand Zone:** \$228.00–\$230.00 —
* **Supply Zone:** \$236.00 —234
🎯 **Trade Setup (Long Bias):**
* **Entry:** \$230.20 (current level near demand bounce)
* **Stop Loss:** \$228.80 (below the demand zone)
* **Take Profit :** \$236.00
* **Risk/Reward:** \~**1:3 RR**
*“The goal of a successful trader is to make the best trades. Money is secondary.” – Alexander Elder*
#### ⚠️ **Disclaimer:**
This is for educational purposes only and not financial advice. Trade at your own risk. Always manage your capital responsibly and use proper risk management.
Wave Analysis
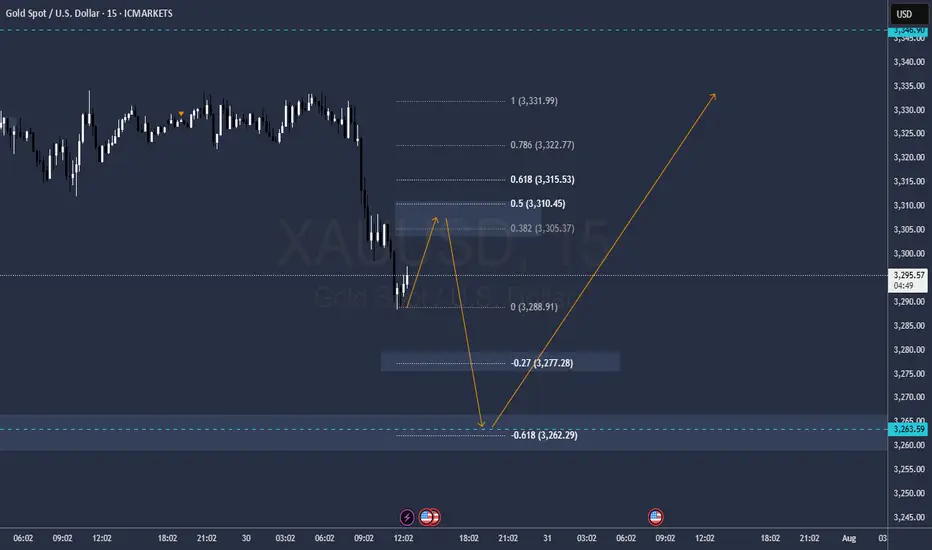
GOLD FOMC Ok it will be rising this previous FOMC 90 minutes but then will fall fasta and sharp
Sell levels 3305 / 3310 SL above .618
Targets 3277 3263
Reversal spectation on 3263 towars all time highs 3550 and 3650
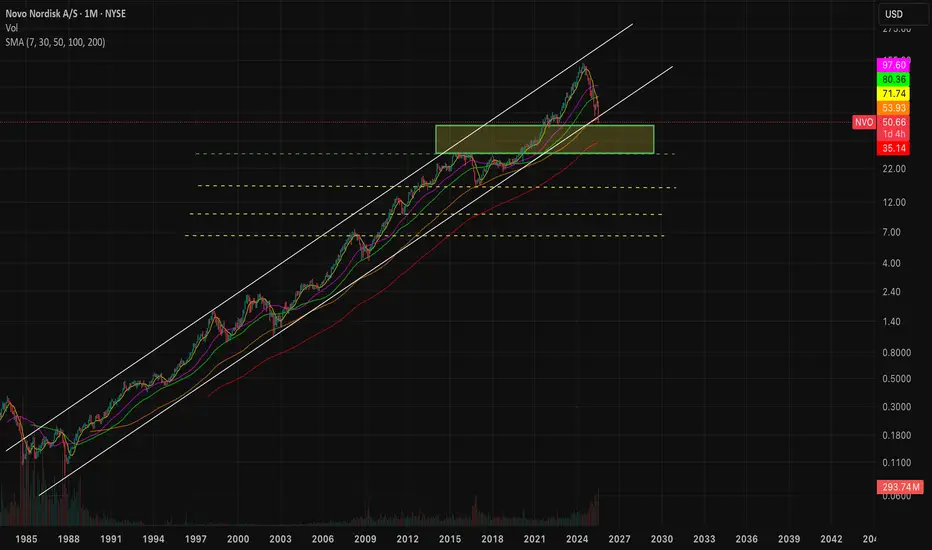
$NVO Accumulating long term compounder! - Previously, I have shorted NYSE:NVO when it was in $75-85 when moat was weakening and then went long around $58 to $75 for 40% on the long side. Everything is documented in my two posts.
- People are asking me if NYSE:NVO is cheap or not. After cutting guidance, I believe most of the estimates for EPS about NYSE:NVO are way off which would be revised downwards.
- At the same time, I believe NYSE:NVO has kitchen sinked their guidance because of new CEO transition which is very common in the publicly traded company.
- NYSE:NVO might not be cheap after cutting guidance honestly but not overvalued either.
- NYSE:NVO could be a dead money for some time 6 months, 1 year or 2 years who knows?
- But I know that weight loss industry in general is growing overall at least till 2030 and beyond.
- Some concerns I have is NYSE:NVO leadership is getting challenged by NYSE:LLY so it could be possible that NYSE:NVO might get lesser piece of the pie. However, overall piece is growing along with it so NYSE:NVO should continue to grow but at a lower rate than earlier.
- Net free cash flow should grow and company might return on investment to shareholders via share buybacks?
- Finally, I am buying NYSE:NVO in increments and have bought first lot of shares in $50.xx and will continue to add more if it drops more. I think NYSE:NVO can test 200 monthly moving average @ $35.
- I have marked the accumulation box in the chart for your reference.
SHIB Bullish DivergenceBINANCE:SHIBUSDT
Trade Setup:
Target 1: 0.00001335 (0.786 Fibonnaci Golden Zone).
Target 2: 0.00001391 (0.618 Fibonnaci Golden Zone).
Target 3: 0.00001430 (0.5 Fibonnaci Golden Zone).
Target 4: 0.00001597 (0 Fibonnaci).
Stop Loss: 0.00001172 (1.272 Fibonnaci).
RSI Analysis: The RSI is showing a bullish divergence, suggesting potential bullish momentum. The current RSI is around 24.02, approaching oversold territory, so caution is advised.

Soluna Holdings Inc.Stock on triggering level, Target prices between 261.8% - 300%
Highly recommended for Buying now 👌
Above 1$ will be the Target price.
Buy it now as much as you can before ignition starting UP 🔥🔥🔥💥💣🚀

Crypto Trade: PEPEUSDT Long Swing Trade BINANCE:PEPEUSDT Long Swing Trade, with my back testing of this strategy, it hits multiple possible take profits, manage your position accordingly.
This is good trade, don't overload your risk like greedy, be disciplined trader.
I manage trade on daily basis.
this is good trade, lets see, don't be greedy, risk what you can afford.
Use proper risk management
Looks like good trade.
Lets monitor.
Use proper risk management.
Disclaimer: only idea, not advice

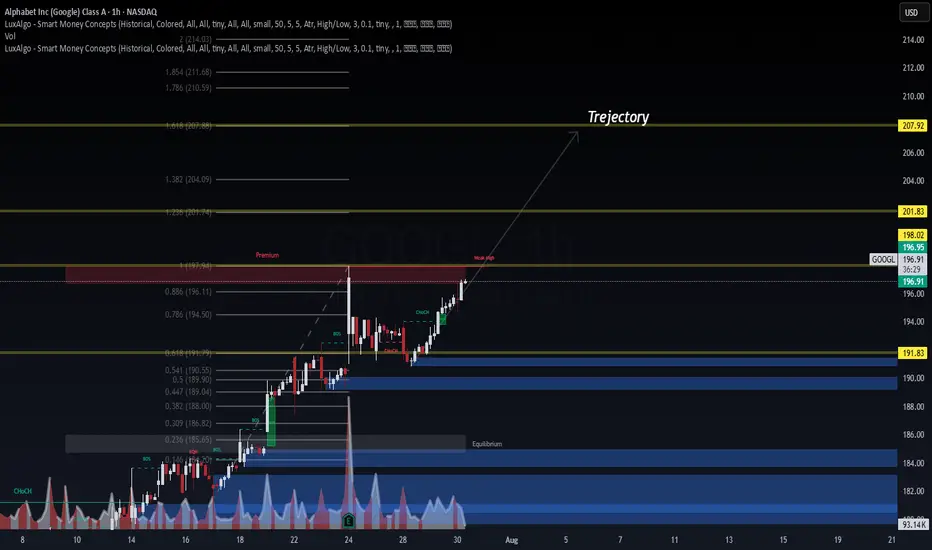
GOOGL Forecast – Dual AI Model Confirmation📊 GOOGL Forecast – Dual AI Model Confirmation
🔹 Posted by WaverVanir | VolanX Protocol
NASDAQ:GOOGL is showing strong bullish structure backed by both Smart Money Concepts (SMC) and AI model consensus.
🧠 VolanX AI Protocol Forecast (30-Day)
🎯 Target: $223.08 (+13.3%)
📈 Accuracy: 98.2%
📉 Drawdown: 0.00% (Backtested)
🧮 Sharpe Ratio: 7.70
🔵 Rating: Strong Buy
📉 WaverVanir DSS Model (Sentiment Score: 83)
🔸 30-Day Target: $198.47
🔸 Micro pullback expected before resuming uptrend
🔸 Ideal for refining short-term entries
🔍 SMC Structure:
BOS + CHoCH Confirmed
Premium zone at $197.94 cleared
1.236 Fib target: $201.83
1.618 Fib confluence: $207.92
Trajectory path = $223.08 if liquidity extends
📌 Strategy:
Entry: ~$196.95
TP1: $200.89
TP2: $223.08
SL: $188.80
R:R ~ 3.2:1
📢 Signal powered by WaverVanir DSS + VolanX Protocol
This is institutional-grade AI meets market structure.
#GOOGL #VolanX #WaverVanir #AITrading #SmartMoneyConcepts #SMC #Fibonacci #SwingTrade #Forecast #TradingView #StockSignals #InstitutionalAlpha #DecisionSupport #MachineLearning #DSS
CryptoTrade: AVAXUSD Long Trade with SL and TPCOINBASE:AVAXUSDT Long Swing Trade, with my back testing of this strategy, it hits multiple possible take profits, manage your position accordingly.
This is good trade, don't overload your risk like greedy, be disciplined trader.
I manage trade on daily basis.
this is good trade, lets see, don't be greedy, risk what you can afford.
Use proper risk management
Looks like good trade.
Lets monitor.
Use proper risk management.
Disclaimer: only idea, not advice

GBPJPY What Next? SELL!
My dear friends,
Please, find my technical outlook for GBPJPY below:
The price is coiling around a solid key level - 199.08
Bias - Bearish
Technical Indicators: Pivot Points Low anticipates a potential price reversal.
Super trend shows a clear sell, giving a perfect indicators' convergence.
Goal - 198.77
Safe Stop Loss - 199.23
About Used Indicators:
The pivot point itself is simply the average of the high, low and closing prices from the previous trading day.
Disclosure: I am part of Trade Nation's Influencer program and receive a monthly fee for using their TradingView charts in my analysis.
———————————
WISH YOU ALL LUCK

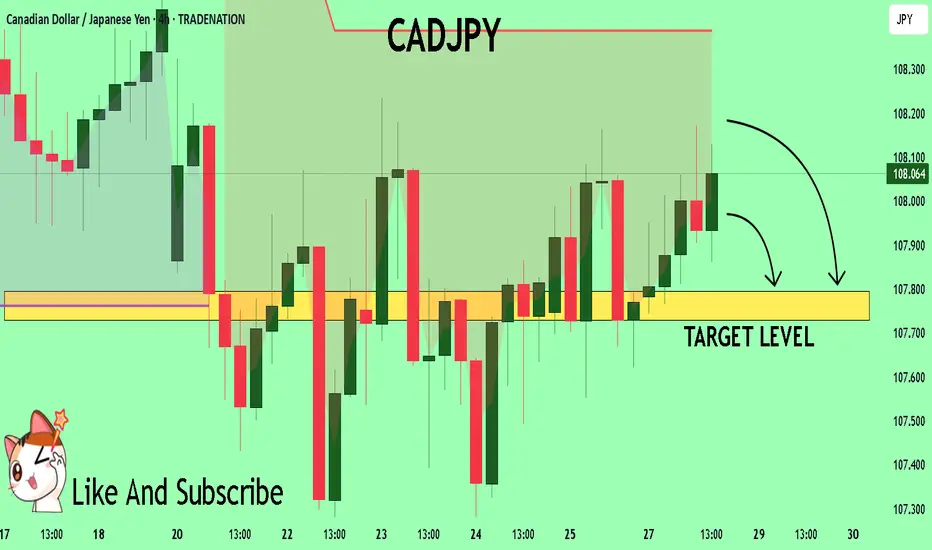
CADJPY Trading Opportunity! SELL!
My dear followers,
I analysed this chart on CADJPY and concluded the following:
The market is trading on 108.08 pivot level.
Bias - Bearish
Technical Indicators: Both Super Trend & Pivot HL indicate a highly probable Bearish continuation.
Target - 107.79
About Used Indicators:
A super-trend indicator is plotted on either above or below the closing price to signal a buy or sell. The indicator changes color, based on whether or not you should be buying. If the super-trend indicator moves below the closing price, the indicator turns green, and it signals an entry point or points to buy.
Disclosure: I am part of Trade Nation's Influencer program and receive a monthly fee for using their TradingView charts in my analysis.
———————————
WISH YOU ALL LUCK
USDJPY A Fall Expected! SELL!
My dear subscribers,
My technical analysis for USDJPY is below:
The price is coiling around a solid key level - 148.71
Bias - Bearish
Technical Indicators: Pivot Points Low anticipates a potential price reversal.
Super trend shows a clear sell, giving a perfect indicators' convergence.
Goal - 147.93
About Used Indicators:
By the very nature of the supertrend indicator, it offers firm support and resistance levels for traders to enter and exit trades. Additionally, it also provides signals for setting stop losses
Disclosure: I am part of Trade Nation's Influencer program and receive a monthly fee for using their TradingView charts in my analysis.
———————————
WISH YOU ALL LUCK

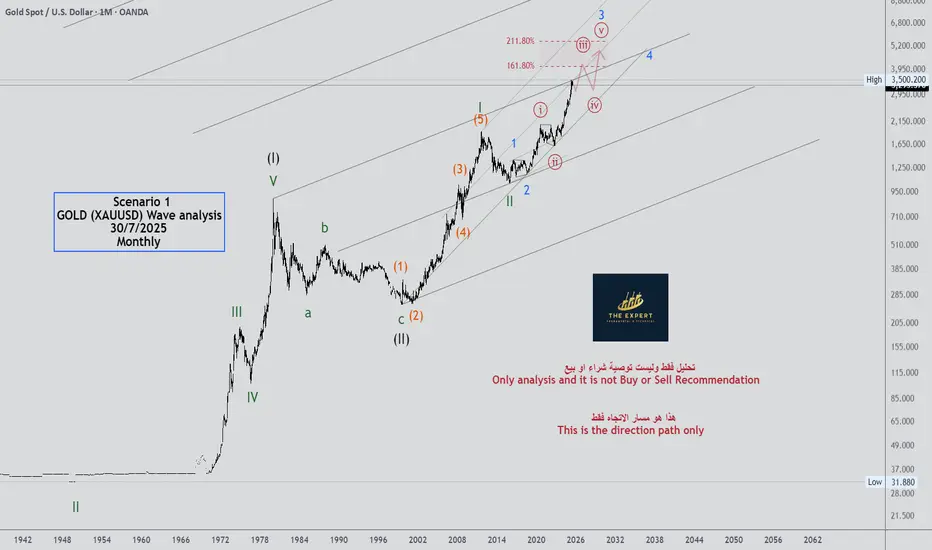
Gold analysis by majidbabaeiasl My predictions for gold in previous years have been quite accurate and calculated. Right now, I think a wave 4 correction, which is a micro-wave, is taking place.

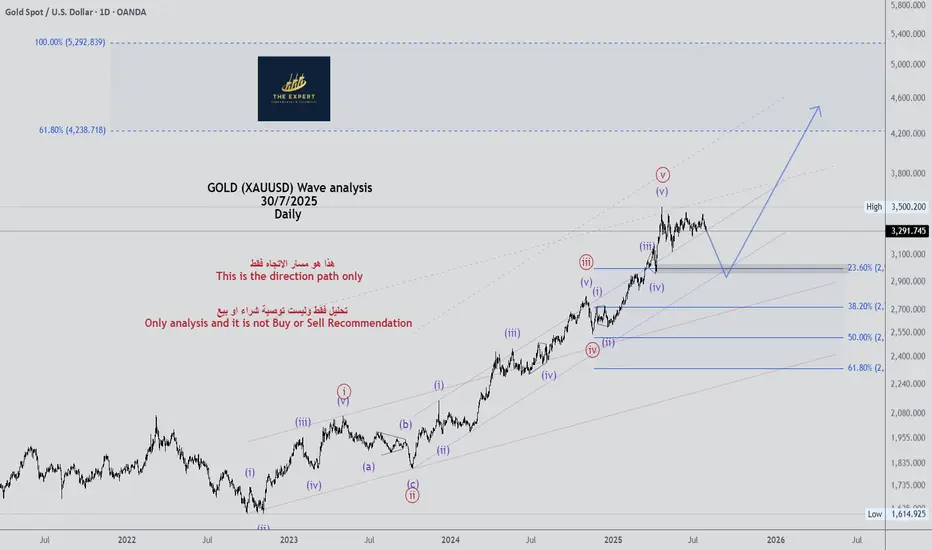
GOLD (XAUUSD) Wave analysis Daily - 30/7/2025GOLD (XAUUSD) Wave analysis Daily - 30/7/2025
see the chart
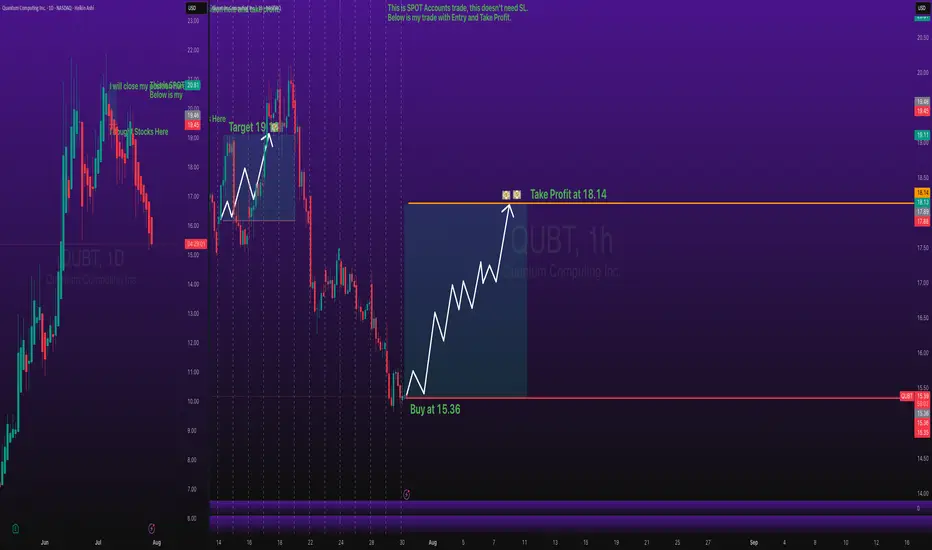
QUBT Stocks BUY Entry with Take Profit Level - Key ZonesStocks SPOT ACCOUNT: NASDAQ:QUBT stocks my buy trade with take profit.
This is my SPOT Accounts for Stocks Portfolio.
Trade shows my Buying and Take Profit Level.
Spot account doesn't need SL because its stocks buying account.
GOLD (XAUUSD) Wave analysis Weekly - 30/7/2025 (Scenario 2)GOLD (XAUUSD) Wave analysis Weekly - 30/7/2025 (Scenario 2)

GOLD (XAUUSD) Wave analysis Weekly - 30/7/2025 (Scenario 1)GOLD (XAUUSD) Wave analysis Weekly - 30/7/2025 (Scenario 1)

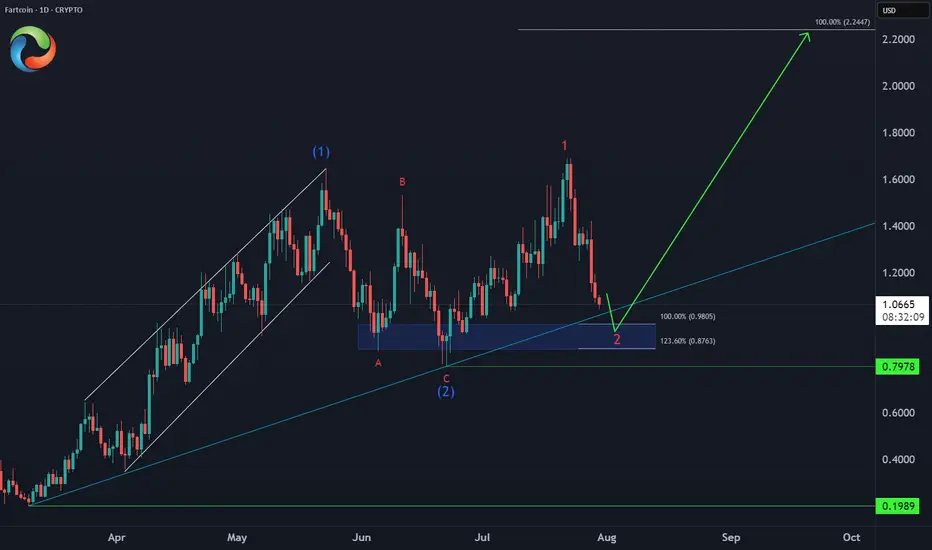
FARTCOIN Bullish Setup 📈 CRYPTO:FARTCOINUSD Entering an extreme buying area:
✅ Key support zone: $0.98-$0.87 (April trendline + equal legs)
⛔ Invalidation: $0.79
🎯 Target: $2.20 (124% upside)
This is how explosive meme setups look before liftoff.
GOLD (XAUUSD) Wave analysis Monthly - 30/7/2025 (Scenario 2)GOLD (XAUUSD) Wave analysis Monthly - 30/7/2025 (Scenario 2)

GOLD (XAUUSD) Wave analysis Monthly - 30/7/2025 (Scenario 1)GOLD (XAUUSD) Wave analysis Monthly Scenario 1 - 30/7/2025
GOLD BUY M15 Gold (XAU/USD) 15-Minute Chart Analysis – July 30, 2025
Price recently broke structure (BOS) to the downside, reaching a key demand zone near the 3293 level, which is marked as a potential weak low. The current analysis suggests a possible bullish reversal from this demand area.
Entry Zone: Price is currently testing the demand zone near 3293-3300.
Stop Loss (SL): Placed at 3293, just below the weak low.
Target (TP): 3339, which aligns with a previous strong high and resistance area.
Intermediate Resistance Levels:
3310.049
3320.396
A bullish structure is expected to form with higher highs and higher lows as price potentially climbs toward the target. The analysis anticipates a breakout from current consolidation and a move toward the upper resistance zone.

ELLIOTT WAVE EURUSD Daily update
EW Trade Set Up daily
minute ((i)) seems finished
H4 scenario 210725:
the price upward movement from 1.1557 area on 17/07/25 has broken decisively 1.1684-1.1705 area but it had not the
strenght to go further so that the lagging span (green line) could break upward the leading span B (red line).
A decrescent high has been registered at 1.1800 area on 24/07/25.
In this new scenario it looks like that the impulsive movement that started from 1.0180 on 13/01/25
finisced at 1.1834 on 010725 in the minute wave (i). (EWO divergence, break down of the upward (ii)/(iv) channel).
So i have to register that a correction to minute wave ((ii) has started
key levels VP area
1.1800
1.1370 POC
1.0850
note :
monitor the price reaction at any supports level: VP area and LVN

NIKE Confirms A Bullish Reversal With An Impulsive RecoveryWe talked about Nike on July 10 with our members, where we mentioned and highlighted a completed higher degree ABC correction in wave IV on the monthly and weekly charts.
Today we want to represent a closer view, as we see a five-wave impulsive recovery away from the lows on a daily chart. It actually confirms the bottom and bullish reversal, but since it can be trading in 5th wave that can stop around 80-85 area, we should be aware of a three-wave corrective setback soon. It can slow down the price back to the open GAP, so ideal buy zone is in the 70-60 area. Invalidation level is at 52.
Highlights:
Direction: Up, but watch out for a correction
Structure: Impulse, Wave 5 in final stages
Support: 70 / 60

EUR-USD Free Signal! Buy!
Hello,Traders!
EUR-USD keeps falling and
The pair is locally oversold so
As the pair is retesting the
Horizontal support level
Of 1.1468 we can enter a
Long trade with Take Profit
Of 1.1510 and Stop Loss
Of 1.1443
Buy!
Comment and subscribe to help us grow!
Check out other forecasts below too!
Disclosure: I am part of Trade Nation's Influencer program and receive a monthly fee for using their TradingView charts in my analysis.
