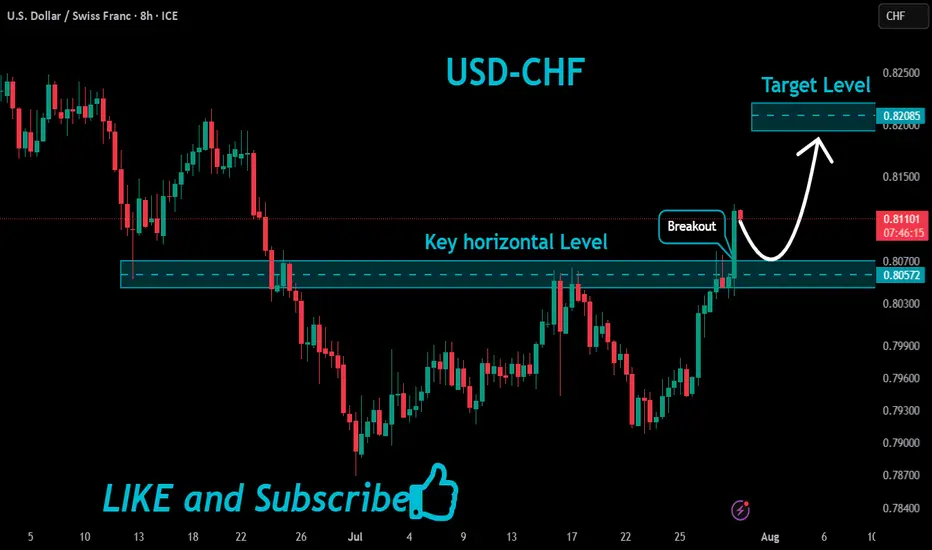
USDCHF Bullish Breakout!
HI,Traders !
#USDCHF is trading in a strong
Uptrend and the price made a
Bullish breakout of the key
Horizontal level of 0.80572
So we are bullish biased
And we will be expecting a
Further bullish move up !
Comment and subscribe to help us grow !
Wave Analysis
[Deep Dive] SUSHI – Edition 3: Accumulate. Anticipate. Accelerat🧠 Cycle Anatomy: What the Chart Is Telling Us
📉 Phase 1: Markdown
The bears dominated, slicing price downward into key historical support around the $0.50 mark — the same level that anchored the previous accumulation zone.
📦 Phase 2: Accumulation
Both accumulation phases (mid-2023 and Q2 2025) occurred near identical support zones, with rounded bases and sideways chop — signaling strong hands quietly absorbing supply.
📈 Phase 3: Markup Incoming?
Following breakout point “1” and retest point “2,” the current structure aligns remarkably well with the previous markup phase — which propelled SUSHI from ~$0.50 to over $3 in just weeks. While past performance isn’t a guarantee, this fractal deserves attention.
🔥 Why Fundamentals May Support This Move
- SushiSwap v3 continues rolling out on multiple chains, optimizing capital efficiency and fee structure for LPs.
- Governance has stabilized after the rough patches of 2022–2023, with more transparent treasury and development direction.
- Cross-chain expansion and integrations with major aggregators (like 1inch, Matcha, and DeBank) are boosting SUSHI’s visibility in the broader DeFi flow.
Additionally, a surge in TVL and DEX activity on low-fee chains could redirect volume back to SushiSwap — a platform known for its cross-chain capabilities.
📍 What to Watch Next
- A confirmed breakout above $1.00 would validate the “markup” thesis.
- A dip toward the $0.65–$0.70 zone could offer a high-risk/reward entry aligned with point “2.”
- Failure to hold the $0.50 level would invalidate the structure.
For now, the rhythm is clear: markdown → accumulation → markup. And if the pattern holds, SUSHI might just be preparing for its third vertical.
💬 Do you think this is just another fakeout — or is SUSHI gearing up for a DeFi comeback?
🔔 Disclaimer: This post is for educational and informational purposes only. It does not constitute financial advice. Always do your own research and manage risk carefully.
📚 Always follow your trading plan => including entry, risk management, and trade execution.
Good luck!
All strategies are good, if managed properly.
~ Richard Nasr

USDJPY UPSIDE The dollar index (DXY00) on Tuesday rose by +0.22% and posted a 5-week high. The dollar has carryover support from Monday following the EU-US trade deal that is seen as favoring the US. Also, expectations for the Fed to keep interest rates unchanged at the end of Wednesday's 2-day FOMC meeting are supportive of the dollar. The dollar extended its gains after the US Jun advance goods trade deficit unexpectedly shrank, a supportive factor for Q2 GDP, and after July consumer confidence rose more than expected.

GBPUSD DOWNSIDE UPDATE The dollar index (DXY00) on Tuesday rose by +0.22% and posted a 5-week high. The dollar has carryover support from Monday following the EU-US trade deal that is seen as favoring the US. Also, expectations for the Fed to keep interest rates unchanged at the end of Wednesday's 2-day FOMC meeting are supportive of the dollar. The dollar extended its gains after the US Jun advance goods trade deficit unexpectedly shrank, a supportive factor for Q2 GDP, and after July consumer confidence rose more than expected.

EURUSD DOWN SIDE The dollar index (DXY00) on Tuesday rose by +0.22% and posted a 5-week high. The dollar has carryover support from Monday following the EU-US trade deal that is seen as favoring the US. Also, expectations for the Fed to keep interest rates unchanged at the end of Wednesday's 2-day FOMC meeting are supportive of the dollar. The dollar extended its gains after the US Jun advance goods trade deficit unexpectedly shrank, a supportive factor for Q2 GDP, and after July consumer confidence rose more than expected.

AUDCAD: Long Trade Explained
AUDCAD
- Classic bullish formation
- Our team expects pullback
SUGGESTED TRADE:
Swing Trade
Long AUDCAD
Entry - 0.8914
Sl - 0.8901
Tp - 0.8941
Our Risk - 1%
Start protection of your profits from lower levels
Disclosure: I am part of Trade Nation's Influencer program and receive a monthly fee for using their TradingView charts in my analysis.
❤️ Please, support our work with like & comment! ❤️

DXY UPDATE FOR LONG as we forecast a long term this an update
The dollar index (DXY00) on Tuesday rose by +0.22% and posted a 5-week high. The dollar has carryover support from Monday following the EU-US trade deal that is seen as favoring the US. Also, expectations for the Fed to keep interest rates unchanged at the end of Wednesday's 2-day FOMC meeting are supportive of the dollar. The dollar extended its gains after the US Jun advance goods trade deficit unexpectedly shrank, a supportive factor for Q2 GDP, and after July consumer confidence rose more than expected.

AUDUSD My Opinion! BUY!
My dear subscribers,
AUDUSD looks like it will make a good move, and here are the details:
The market is trading on 0.6455 pivot level.
Bias - Bullish
Technical Indicators: Both Super Trend & Pivot HL indicate a highly probable Bullish continuation.
Target - 0.6512
About Used Indicators:
The average true range (ATR) plays an important role in 'Supertrend' as the indicator uses ATR to calculate its value. The ATR indicator signals the degree of price volatility.
Disclosure: I am part of Trade Nation's Influencer program and receive a monthly fee for using their TradingView charts in my analysis.
———————————
WISH YOU ALL LUCK

XAU/USD – Endphase der Circle Wave 1 & Vorbereitung auf die KorrOANDA:XAUUSD
We are currently in the final stages of the yellow (Circle) Wave 1 on Gold.
We have just completed wave 4.
How do I identify wave 4? Simple:
📏 I drew a trendline, and once that trendline was broken, the trend of wave 3 was considered complete.
However, we’ve now made a new low, which broke the low of wave 3 — this could very well be our wave A of wave 4 ⚠️.
I’m expecting one more final low, potentially around 3252, or even as low as 3200.
But personally, I lean towards ~3252 as the likely target 🎯.
After that, we should see a move upward into the yellow Fibonacci zone of wave 2 🟡.
The path from Circle 1 to Circle 2 will likely unfold as a corrective A-B-C structure to the upside 🔁.
Following that, we hopefully get a clean five-wave impulse into our (Circle) Wave 3 🚀.

Elliott Wave Analysis – XAUUSD | July 30, 2025📊
🔍 Momentum Analysis
• D1 Timeframe: Momentum has started to reverse upward, but we need to wait for today’s daily candle to close for confirmation. Until then, there is still a risk of another short-term decline.
• H4 Timeframe: Momentum lines are clustering in the overbought zone, signaling a possible weakening of the current upward move. However, this signal alone is not enough to confirm that the uptrend has ended.
________________________________________
🌀 Wave Structure
• Price has reached the projected target for wave e, but there has been no strong bullish reaction. The recent candles are short-bodied and overlapping – typical of corrective structures. Also, this wave has lasted longer than previous corrective upswings, suggesting that the decline may not be over yet and the wave count needs to be reviewed.
Currently, we are facing two equally probable scenarios (50/50), but they suggest opposite outcomes:
➤ Scenario 1: Zigzag (5-3-5) Structure
• The current structure may represent only wave A of a larger zigzag.
• We are now in wave B, which tends to be complex and unpredictable, making it not ideal for wave-based trading.
• The red zones marked on the chart indicate potential target areas for wave B.
➤ Scenario 2: Completed 5-Wave Correction
• The downtrend may have completed at wave (e).
• The current upward movement could be wave 1 forming as a triangle – a potential start of a new bullish cycle.
• However, to confirm this scenario, price must hold above 3309. If it fails to do so and H4 momentum reverses downward, a new low is very likely.
________________________________________
📝 Trading Plan
Given the current market conditions, I only recommend short-term scalp trading based on the predefined support and resistance zones.
Avoid wave-based trading until the structure becomes clearer. Once clarity returns, I will provide an updated trading plan.

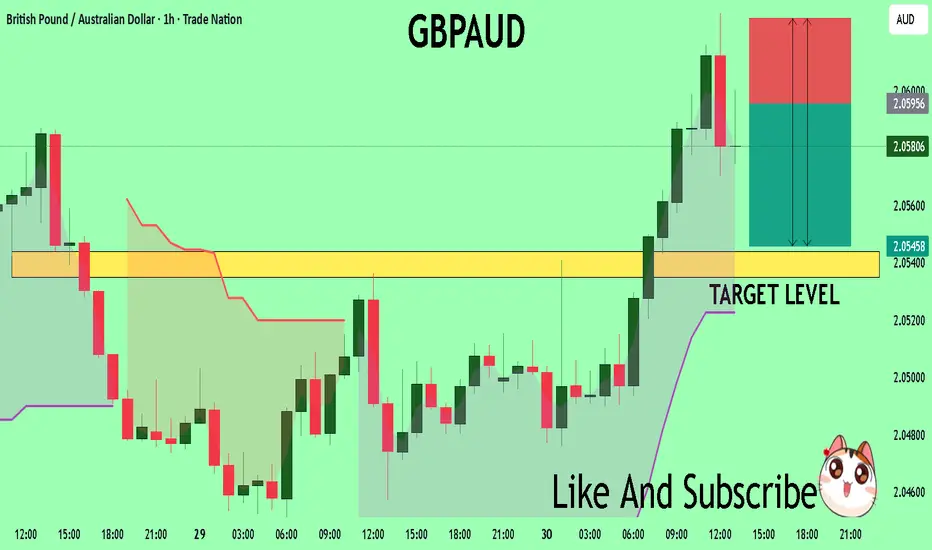
GBPAUD Massive Short! SELL!
My dear subscribers,
My technical analysis for GBPAUDis below:
The price is coiling around a solid key level - 2.0596
Bias - Bearish
Technical Indicators: Pivot Points Low anticipates a potential price reversal.
Super trend shows a clear sell, giving a perfect indicators' convergence.
Goal - 2.0543
My Stop Loss - 2.0626
About Used Indicators:
By the very nature of the supertrend indicator, it offers firm support and resistance levels for traders to enter and exit trades. Additionally, it also provides signals for setting stop losses
Disclosure: I am part of Trade Nation's Influencer program and receive a monthly fee for using their TradingView charts in my analysis.
———————————
WISH YOU ALL LUCK
Gold (XAUUSD) Breaks Trendline – Potential Downside Ahead?Gold (XAU/USD) has officially broken below a long-term ascending trendline on the 4H chart, indicating a potential shift in market structure. The recent breakout from a bear flag pattern confirms bearish momentum, and price is now approaching a key horizontal support zone around $3,249 and $3,242.
🔹 Trendline support (now resistance) broken
🔹 Bear flag breakdown – strong bearish candle
🔹 Eyes on support levels: $3,249, $3,165, and possibly lower
🔹 Watch for a potential retest of the broken trendline for short opportunities
A clean break and close below $3,249 could open the door for further downside in the coming sessions. Trade cautiously and manage your risk!

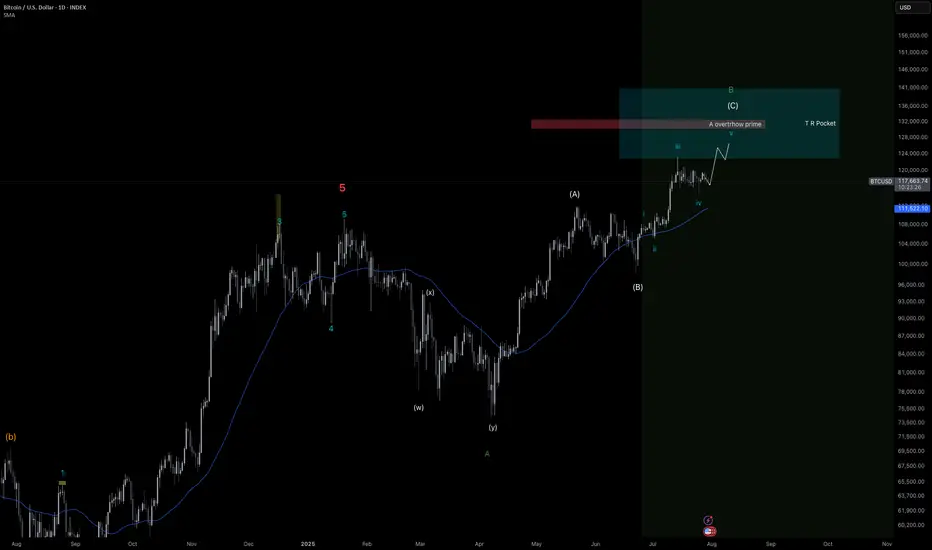
Accroding to VSFA+ long turm BTC Asalam-o-Alikum All,
Accroding to VSFA+ Strategy BTC very soon big drop coming, BTC testing 90k to 95k price velue, Total market cap crashing so overall crypto coin's crashing toO so becareful...

Primary Bitcoin count still Following The Primary Flat bitcoin count is still ongoing and seesm to play out well so far giving still small long opportunities.NFA
GOLD Long After Lower Dip - Catching PullbackOANDA:XAUUSD / TVC:GOLD Long Trade, with my back testing of this strategy, it hits multiple tp, here price will pullback up.
Price will bounce in this zone.
I kept SL slight big to be safe because TP levels are good so I don't want to get pushed out because of tight SL.
Note: Manage your risk yourself, its risky trade, see how much your can risk yourself on this trade.
Use proper risk management
Looks like good trade.
Lets monitor.
Use proper risk management.
Disclaimer: only idea, not advice

USDCAD Bullish Breakout!
HI,Traders !
#USDCAD was trading in a
Falling wedge pattern
But now we are seeing a
Bullish breakout so we
Will be expecting a
Further bullish move up !
Comment and subscribe to help us grow !

USDJPY POTENTIAL CONTINUATION AFTER A PULLBACK Price has returned to a higher time frame supply zone after a change in structure and is now showing signs of rejection following a pullback (retracement). The mitigation of the supply zone suggests that institutions may have filled their sell orders and are now ready to push price lower.
📉 Execution Plan:
• Entry: On lower timeframe BOS/CHOCH or strong bearish reaction after mitigation.
• SL: Just above the supply zone (allow breathing room).
• TP: Next demand zone or based on structure (e.g., swing low, imbalance fill).
• RR: Minimum 1:3, ideally 1:5 depending on refinement and volatility.

BTC – Pre-FOMC consolidation, bullish momentum, key zones__________________________________________________________________________________
Technical Overview – Summary Points
__________________________________________________________________________________
Momentum : Primary uptrend confirmed on all swing timeframes (daily to 1H). Active consolidation below major resistance (119650–120247), no capitulation or massive selling signals at this stage.
Major Supports / Resistances :
Main Supports: 116950, then 114732. Structural invalidation if daily close below 114K or low <110K.
Key Resistances: 119650–120247 (recent block), then 123218. Clean breakout >125K targets next stat zone at 141K.
Volumes : Transactional flows remain healthy, no anomalies or distribution events; normal volumes with a few impulsive bursts. No panic or selling climax detected.
Multi-timeframe behavior : Uptrend alignment from 1D to 2H; short-term divergence (MTFTI “Down” on 30m/15m/5m) indicates only breath/consolidation pre-macro event (FOMC).
__________________________________________________________________________________
Strategic Summary
__________________________________________________________________________________
Global Bias : Medium/long-term bullish bias, confirmed, with no behavioral excess or visible structural weakness.
Opportunities : Pullbacks to major supports (116950–114732) offer strategic accumulation. Potential for adding exposure on clear breakout above 125K with volume confirmation.
Risk Areas : Post-FOMC flushes, anticipated high volatility until Thursday morning, $115–123K range still active. Tactical stop loss below 114.5K, structural recalibration <110K.
Macro Catalysts : FOMC tonight (20:00 Paris): status quo expected, but markets highly sensitive to Powell’s statement. Widened spreads, max volatility expected within the following 2 hours.
Action Plan : Favor patience on breakout, accumulate on retracement, keep stops disciplined. Avoid aggressive scalping until post-FOMC volatility peak fades.
__________________________________________________________________________________
Multi-Timeframe Analysis
__________________________________________________________________________________
1D (Daily): Uptrend confirmed up to dense resistance zone 119800–123200. Solid momentum, no excess on Risk On / Risk Off Indicator or volume. Key Supports: 116950, 114732.
12H/6H/4H: Structured consolidation below 120247–119650. No behavioral warnings; markets strong, healthy liquidity. Accumulation-distribution rhythm without extremes.
2H/1H: Sideways, no sell-off or euphoria; potential consolidation before breakout. Major supports unchanged.
30min/15min: Noticeable short-term divergence (“Down”). Micro bearish setup, possible loss of short-term momentum before FOMC.
Summary: Broadly bullish swing trend with consolidation below resistance, reinforcement possible on breakout; short term fragile until macro moves (Fed) are digested.
Patience is key ahead of FOMC: prioritize accumulation on major pullback, keep stops disciplined, and avoid intraday over-trading unless clear exhaustion signals emerge.
__________________________________________________________________________________
Risk On / Risk Off Indicator: Strong Buy from 1D to 1H, intact sector support, positive structural bias.
ISPD DIV: Neutral across all timeframes: no excess, no behavioral climax.
On-chain/macro: 97% of holders still in profit; market absorbed stress test ($9B sell-off); only moderate euphoria, consistent with late bull phase but not exhausted.
Swing validation if >125K.
Tactical stop <114.5K; full capitulation <110K.
__________________________________________________________________________________

Boeing Company (BA) Long Setup Boeing Company (BA) Long Setup
Probable **Wave (5)** upside impulse from the recent \$225.26 low.
* Wave (4) looks complete — bullish structure shift starting from LL.
* Price is now breaking minor resistance, building momentum for continuation.
* **Demand Zone:** \$224.00–\$226.00 — proven bounce area, high-volume rejection
* **Supply Zone:** \$242.70–\$243.00 — last bearish engulfing + strong wick rejection
* RSI still recovering from **bullish divergence** on LL.
* **Entry:** \$227.75 (current consolidation near breakout)
* **Stop Loss:** \$224.00 (beneath recent low and demand)
* **Take Profit :** \$243.00 (supply zone)
* **Risk/Reward:** \~**3.0 R**
“In trading, the moment you think you’ve figured it out, the market humbles you.” – Mark Douglas*
#### ⚠️ **Disclaimer:**
This chart analysis is for educational purposes only and not financial advice. Always do your own research, manage risk, and trade responsibly.

XAUUSD ideaWe are waiting for our asset to reach our action zone, and based on the reaction, we’ll decide on our next moves.ALWAYS WAIT FOR A CONFIRMATION TO SEE IF THE PRICE VALIDATES THE ZONE.and you what is your vision of the EURUSD its interests me! i wait you in the commentary

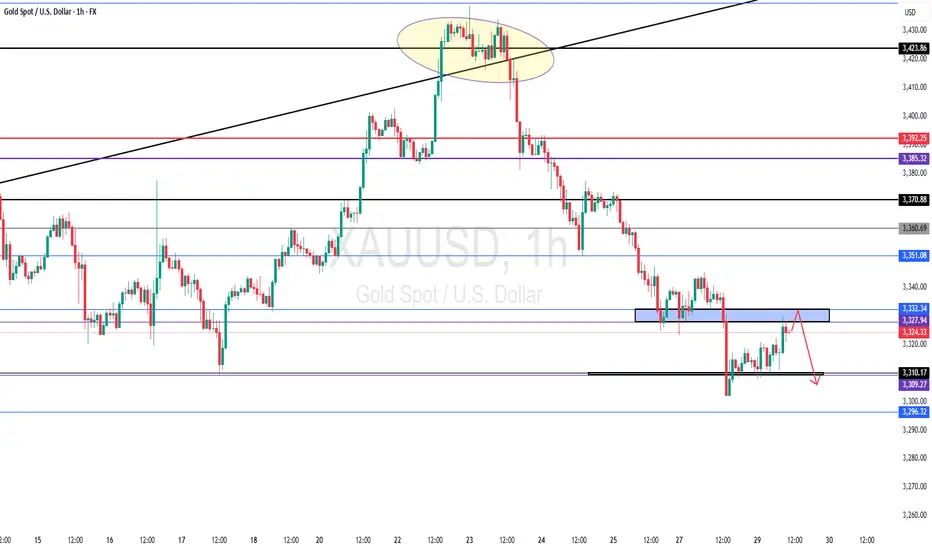
GOLD - Near Current Resistance? holding or not??#GOLD... so market perfectly holds our expected bottom and bounced back and now market just near to his current Resistance region.
that is around 3328 to 3332
keep close that region because if market hold it in that case we can see again drop towards our ultimate support 3310
NOTE: we will go for cut n reverse above 3332 on confirmation.
good luck
trade wisely
USDJPY 30Min Engaged (Buy & Sell Reversal Entry's Detected )Time Frame: 30-Minute Warfare
Entry Protocol: Only after volume-verified breakout
🩸Bullish Reversal - 148.350
🩸Bearish Reversal - 148.370
➗ Hanzo Protocol: Volume-Tiered Entry Authority
➕ Zone Activated: Dynamic market pressure detected.
The level isn’t just price — it’s a memory of where they moved size.
Volume is rising beneath the surface — not noise, but preparation.
🔥 Tactical Note:
We wait for the energy signature — when volume betrays intention.
The trap gets set. The weak follow. We execute.
