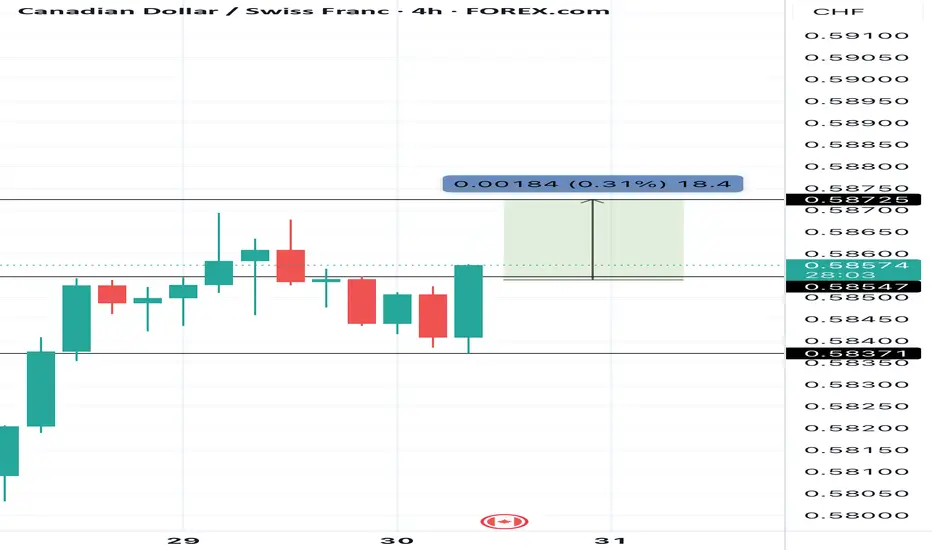
CADCHF buy for quick scalping trade position CADCHF buy for quick scalping trade position .... just looking to scalp this for a strong strength movement here
Wave Analysis
Gold’s Biggest Day of 2025: Collapse or New High Incoming?🟡 Gold Pre-FOMC Update | Patience Paid Off
In my previous analysis released on Monday, we highlighted the significance of the 3310 key red level on gold. I mentioned that if we got a daily candle close below this zone, it could trigger further downside.
That scenario didn’t play out — price closed above 3310, and that’s exactly why we stayed out of any short positions. No guessing, no forcing. Just patience.
On the flip side, I also said we need a daily close above 3350 to even consider going long. And as you can see, for the past two days, price has been ranging tightly between 3310 and 3330 — with relatively low trading volume across the board.
After 9 years of optimizing this strategy, one core principle remains unchanged:
🛡️ Capital protection and maximum risk control always come first.
And I can confidently say — those filters are working beautifully. I hope you’re benefiting from this approach too.
Now technically speaking, everything is lining up for a bullish DXY and bearish gold —
But tonight’s FOMC meeting and Powell vs. Trump drama will be the final trigger.
Let’s watch closely. Smart trading is patient trading. 🧠⚖️
🔁 This analysis will be updated whenever necessary.
Disclaimer:This is not financial advice. Just my personal opinion.

MSFT & META Daily Trade SetupsIn this update we review the recent price action in Microsoft & Meta and identify the next high-probability trading opportunities and price objectives to target. To review today's video analysis clcik here!

XAUUSD: July 30th Market Analysis and StrategyGold Technical Analysis:
Daily Chart Resistance: 3351, Support: 3300
4-Hour Chart Resistance: 3340, Support: 3310
1-Hour Chart Resistance: 3334, Support: 3315.
Trading risk will increase today. We will focus on the Federal Reserve's interest rate decision and the ADP employment data, which are expected to increase market liquidity. If trading, please avoid news releases.
On the daily chart: Bollinger Bands are moving horizontally, with gold prices trading above the lower band. The MACD indicator has formed a downward death cross, indicating a release of bearish momentum. The RSI indicator has fallen back into the overbought range of 50-40, indicating a clear bottoming out and rebound in gold prices.
On the 4-Hour Chart: Bollinger Bands are narrowing, with gold prices trading near the middle band. The MACD indicator is beginning to turn upward, and the RSI is showing an oversold rebound. Gold prices are poised for an upward rebound! The NY market is focusing on the $3351 resistance level above and the $3308 support level below.
SELL: 3351near
BUY: 3315near

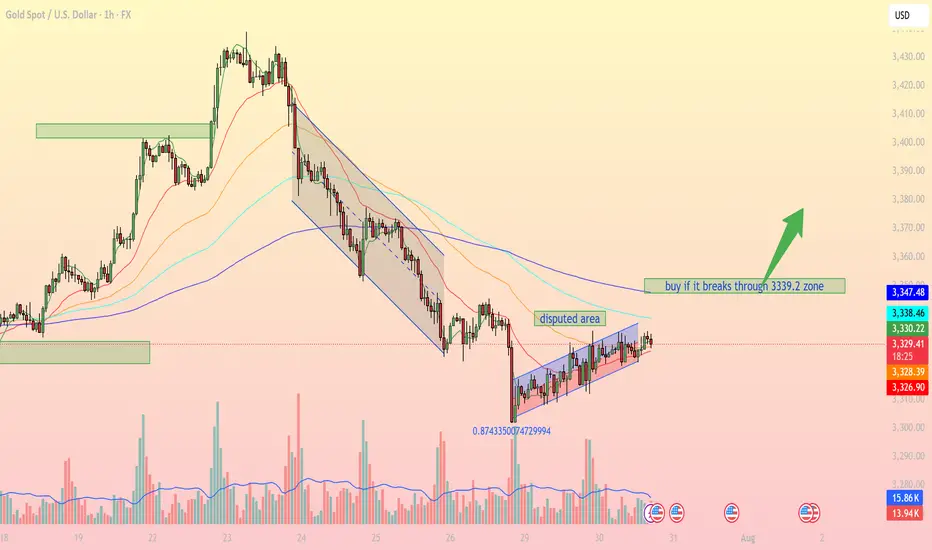
Accumulation pattern awaiting breakout confirmationIntraday Outlook: Accumulation pattern awaiting breakout confirmation
On the 1H timeframe, XAUUSD is forming a clear consolidation pattern within a narrow ascending channel after falling from a prior distribution zone. Buyers are attempting to regain control, but strong resistance remains around the 3,339 – 3,347 USD area.
1. Technical Breakdown:
Trendline & Channel: Price is currently moving inside a small rising channel, indicating a short-term bullish bias, though momentum remains limited.
EMA Dynamics: EMA 20, 50, and 100 are beginning to converge, signaling a potential breakout. A bullish EMA crossover (EMA20 > EMA50) could confirm stronger upward momentum.
Disputed Area: This zone represents heavy indecision between bulls and bears. A clear breakout above or below is needed for directional clarity.
Fibonacci Level: The 0.874 retracement level from the recent low shows strong buyer interest, potentially forming a short-term bottom.
2. Key Support & Resistance Levels:
3,339.2 USD Major resistance – needs to be broken for bullish continuation
3,347.4 USD Next resistance if breakout occurs
3,328.2 USD Immediate support (current price zone)
3,326.7 USD Strong support if price retraces
3. Suggested Trading Strategies:
Scenario 1 – Breakout Buy Strategy:
Entry: Buy if price breaks and closes above 3,339.2 USD on the 1H chart.
Stop Loss: Below 3,328 USD.
Take Profit: First target at 3,347, extended targets at 3,358 and 3,372 USD.
Scenario 2 – Pullback Long Entry:
If price fails to break resistance, consider buying the dip near the 3,326 – 3,328 USD support zone for a better risk-reward setup.
Scenario 3 – Breakdown Sell Setup:
If price breaks below 3,326 USD and exits the channel, a bearish move towards 3,295 – 3,300 USD becomes likely.
Gold is in a key consolidation phase, with the 3,339 USD resistance acting as the decisive breakout zone. Traders should closely monitor price action, volume, and EMA behavior to catch the next directional move.
Follow for more trading strategies like this. Save this post if you find it useful!
High R:R Play on PEPE — 3.2X Reward WaitingThe PEPEUSDT 4H chart clearly shows that the market has been in a downtrend since late July, forming consistent lower highs and lower lows. The trend indicator lines (red above price, blue below) suggest that bearish momentum has been dominant for several sessions.
From July 28 onwards, price tested the short-term moving average multiple times but failed to break above it, confirming that sellers remain in control. However, over the past few candles, we can see that price has started to slow its decline and is now consolidating near the 0.00001145 support zone. This is an area where buyers have previously stepped in, making it a potential pivot point for a short-term bounce.
The marked trade idea on the chart suggests a countertrend long trade. This makes sense because the market is oversold on lower timeframes and showing signs of accumulation. The upside target is set just below a prior reaction level at 0.00001289, which has historically acted as resistance. This creates an opportunity for a clean bounce if buying pressure increases.
Trade Setup
• Entry: 0.00001145 (at current support)
• Stop Loss: 0.00001100 (below recent swing low)
• Take Profit: 0.00001289 (targeting prior resistance)
• Risk-to-Reward Ratio: ~1:3.2
• Trade Bias: Short-term countertrend long

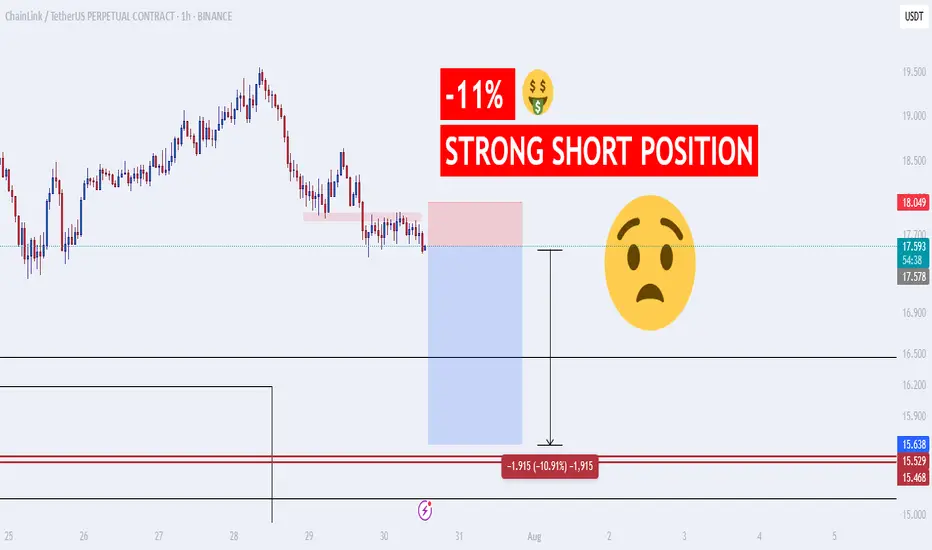
OMG!!! Srtong Short Position!! -10%The price of BIST:LINK is expected to drop by 10% soon. If you enter a short position with 10x leverage, you can potentially make a 100% profit and double your capital! This is an excellent opportunity. Strong sell signal: just take a look at the chart.
White House Crypto Report Incoming: Will BTC Pump from Support? One of the important news for Bitcoin ( BINANCE:BTCUSDT ) that was released today was that " White House confirms first Bitcoin and crypto report will be released TOMORROW ". Bitcoin is likely to rise with the release of the White House report .
What do you think? At least a temporary pump may be in store for Bitcoin.
Bitcoin fell to the Support zone($116,900-$115,730) and filled the New CME Gap( $119,500-$118,295) as I expected in the previous idea .
Bitcoin is currently moving near the Support zone($116,900-$115,730) , Cumulative Long Liquidation Leverage($116,828-$115,710) and Potential Reversal Zone(PRZ) .
I expect Bitcoin to rise from the Support zone($116,900-$115,730) to at least $118,680(First Taregt) .
Second target: Upper line of the descending channel
Note: Stop Loss: $114,680 = Worst Stop Loss(SL)
CME Gap: $115,060-$114,947
Cumulative Short Liquidation Leverage: $118,827-$118,298
Cumulative Short Liquidation Leverage: $120,144-$119,200
Please respect each other's ideas and express them politely if you agree or disagree.
Bitcoin Analyze (BTCUSDT), 1-hour time frame.
Be sure to follow the updated ideas.
Do not forget to put a Stop loss for your positions (For every position you want to open).
Please follow your strategy and updates; this is just my Idea, and I will gladly see your ideas in this post.
Please do not forget the ✅' like '✅ button 🙏😊 & Share it with your friends; thanks, and Trade safe.

GOLD → False breakdown 3310. Consolidation ahead of news...FX:XAUUSD is forming a false breakdown of support at 3310, thereby confirming the boundaries of the trading range. The dollar is testing strong resistance within the global downtrend. And in the near future, we can expect more economic news...
Gold is trading below the key resistance level of $3345, remaining in a narrow range ahead of the Fed's decision and US GDP data for Q2. Weak data could reinforce expectations of a rate cut and support gold, while strong data would strengthen the dollar. The Fed is likely to keep rates at 4.25–4.5%, with markets pricing in a 64% chance of a 25 bps cut in September. Investors are waiting for signals from Jerome Powell, with a possible split within the Fed: some members may support calls for easing, which would be a driver for gold.
Technically, the situation on D1 is quite interesting. Gold is still below the previously broken trend resistance, but there is no continuation of the momentum. Buyers are reacting to support at 3310, but the market is stagnating due to uncertainty ahead of the news...
Resistance levels: 3345, 3375
Support levels: 3320, 3310, 3287
Thus, from a technical analysis perspective, I expect a retest of 3345, followed by a pullback to support at 3320, from which gold could move higher (if the bulls take the initiative), but if 3320 breaks and 3310 comes under pressure, gold could test 3287. Again, the emphasis is on trend support (the upward line) in the 3335-33450 zone. If the price can consolidate in this zone, we will have confirmation that the price has returned to the boundaries of the upward trend.
Best regards, R. Linda!

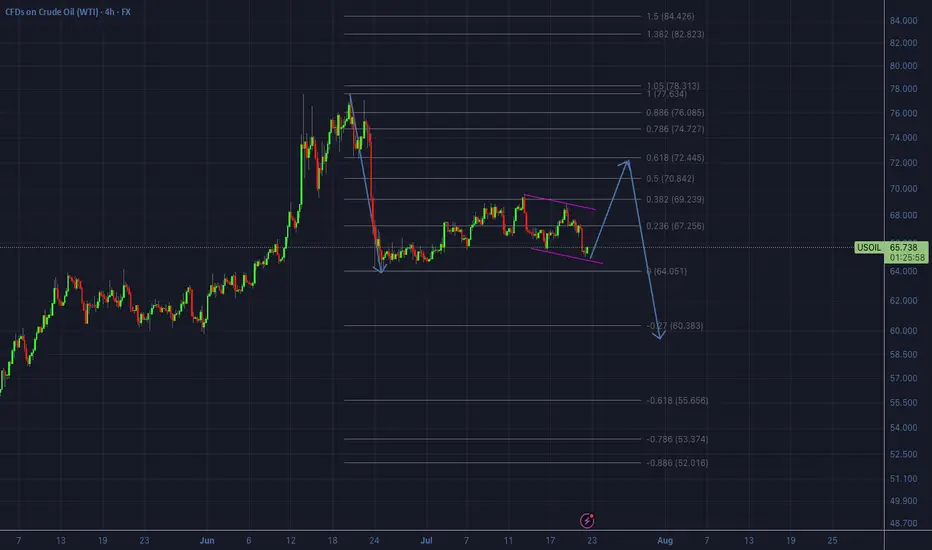
OIL - Likely development on the 4hr/daily scenarioThis looks like the likely scenario that will now develop on oil on the 4hr/daily timeframe.
In other words, we will look for an upside from now on first, back to the 0.618 re-tracement of the huge downside impulse that occurred in the last week of June.
So all buy setups we will be able to take until price hits the $72 area, then we will start looking for sells.
Short-Term "Counter-Short" Position A "counter-short" strategy, Short-Term "Counter-Short" Position
A "counter-short" strategy, also known as counter-trend trading, involves taking a short position against the prevailing short-term trend, anticipating a temporary reversal or correction. This is generally a high-risk, high-reward strategy that requires precise timing and strong risk management.
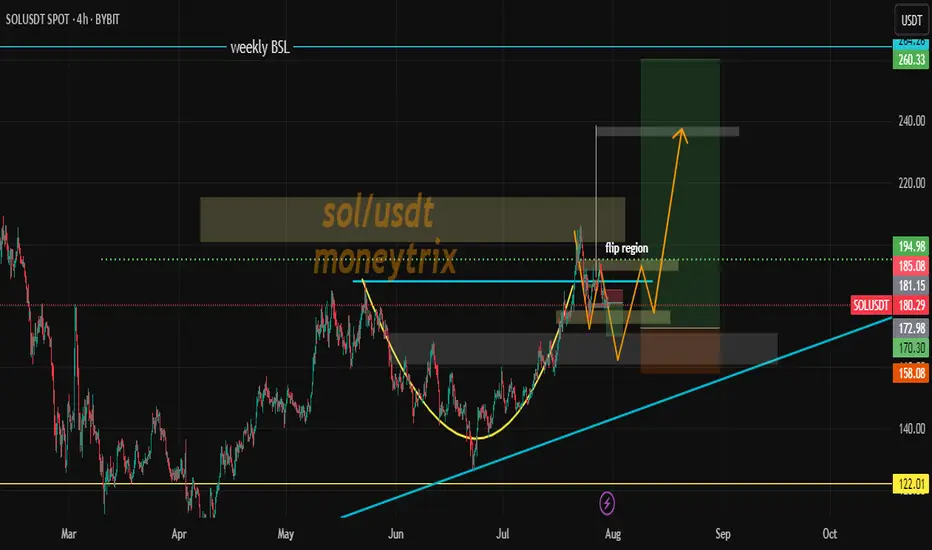
Long-term long positions on SOL/USDT with a cup and handle pattern aim for substantial gains after a period of consolidation. This strategy relies on identifying a well-formed bullish continuation pattern on higher timeframes, confirmed by volume, to indicate a strong upward trajectory for Solana. till previous ATH
EURCHF: Market of Buyers
Looking at the chart of EURCHF right now we are seeing some interesting price action on the lower timeframes. Thus a local move up seems to be quite likely.
Disclosure: I am part of Trade Nation's Influencer program and receive a monthly fee for using their TradingView charts in my analysis.
❤️ Please, support our work with like & comment! ❤️

#ETH/USDT SETUP ,Bought From $4003#ETH
The price is moving within an ascending channel on the 1-hour frame, adhering well to it, and is on track to break it strongly upwards and retest it.
We have support from the lower boundary of the ascending channel, at 3700.
We have a downtrend on the RSI indicator that is about to break and retest, supporting the upside.
There is a major support area in green at 3711, which represents a strong basis for the upside.
Don't forget a simple thing: ease and capital.
When you reach the first target, save some money and then change your stop-loss order to an entry order.
For inquiries, please leave a comment.
We have a trend to hold above the 100 Moving Average.
Entry price: 3811.
First target: 3867.
Second target: 3936.
Third target: 4003.
Don't forget a simple thing: ease and capital.
When you reach your first target, save some money and then change your stop-loss order to an entry order.
For inquiries, please leave a comment.
Thank you.

GOLD: Bearish Continuation & Short Trade
GOLD
- Classic bearish pattern
- Our team expects retracement
SUGGESTED TRADE:
Swing Trade
Sell GOLD
Entry - 3331.7
Stop - 3334.0
Take - 3327.0
Our Risk - 1%
Start protection of your profits from lower levels
Disclosure: I am part of Trade Nation's Influencer program and receive a monthly fee for using their TradingView charts in my analysis.
❤️ Please, support our work with like & comment! ❤️

BTCUSDT - UniverseMetta - Signal#BTCUSDT - UniverseMetta - Signal
D1 - Formation of potential 3rd wave from the level in continuation of the 5th wave on W1. Stop behind the maximum of the 2nd wave.
Entry: 119823.70
TP: 123162.36 - 128518.11 - 131787.21 - 137038.63
Stop: 116693.72

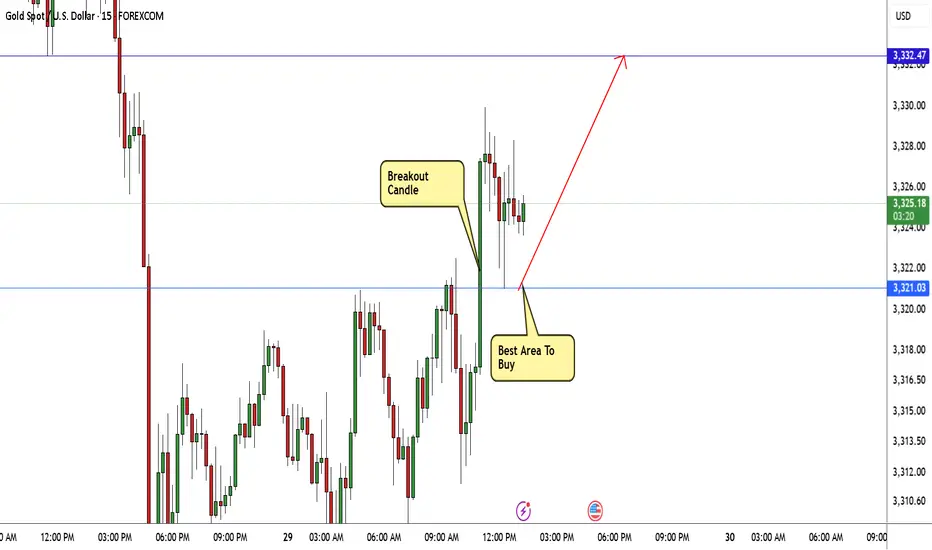
GOLD Breakout Done , Long Setup Valid To With Great ProfitHere is My 15 Mins Gold Chart , and here is my opinion , we finally above 3321.00 and we have a 15 Mins Candle closure above this strong res , so I'm waiting the price to go back and retest this res and new support and give me a good bullish price action to can enter a buy trade , and if we have a 4H Closure Above This res this will increase the reasons for buyers , just wait the price to back a little to retest it and then we can buy it . if we have a daily closure below it this idea will not be valid anymore .
$VRANASDAQ:VRA on daily time frame non logarithmic chart pattern is showing sign of break out. are we going to break. lets wait and find out

EURUSD Set To Grow! BUY!
My dear followers,
This is my opinion on the EURUSD next move:
The asset is approaching an important pivot point 1.1557
Bias - Bullish
Technical Indicators: Supper Trend generates a clear long signal while Pivot Point HL is currently determining the overall Bullish trend of the market.
Goal - 1.1632
About Used Indicators:
For more efficient signals, super-trend is used in combination with other indicators like Pivot Points.
Disclosure: I am part of Trade Nation's Influencer program and receive a monthly fee for using their TradingView charts in my analysis.
———————————
WISH YOU ALL LUCK

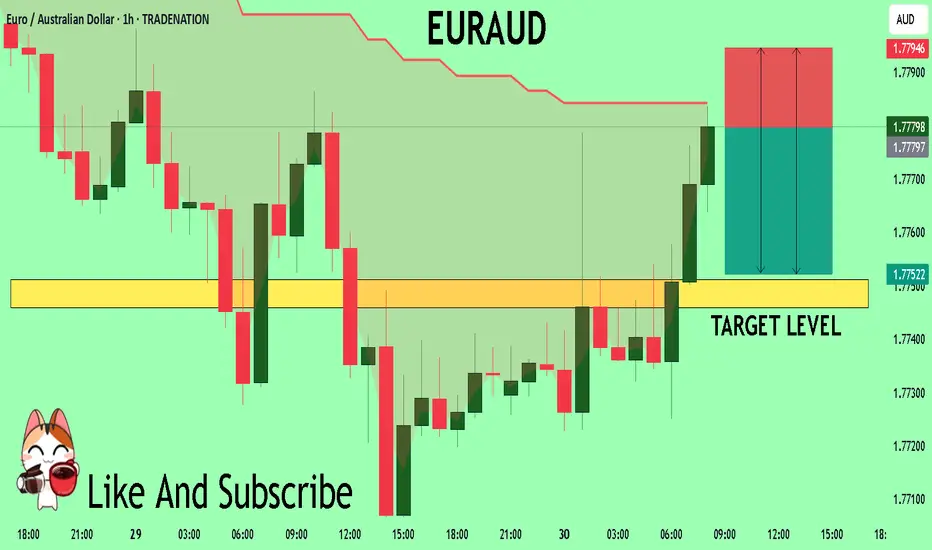
EURAUD Under Pressure! SELL!
My dear followers,
I analysed this chart on EURAUD and concluded the following:
The market is trading on 1.7780 pivot level.
Bias - Bearish
Technical Indicators: Both Super Trend & Pivot HL indicate a highly probable Bearish continuation.
Target - 1.7751
Safe Stop Loss - 1.7794
About Used Indicators:
A super-trend indicator is plotted on either above or below the closing price to signal a buy or sell. The indicator changes color, based on whether or not you should be buying. If the super-trend indicator moves below the closing price, the indicator turns green, and it signals an entry point or points to buy.
Disclosure: I am part of Trade Nation's Influencer program and receive a monthly fee for using their TradingView charts in my analysis.
———————————
WISH YOU ALL LUCK
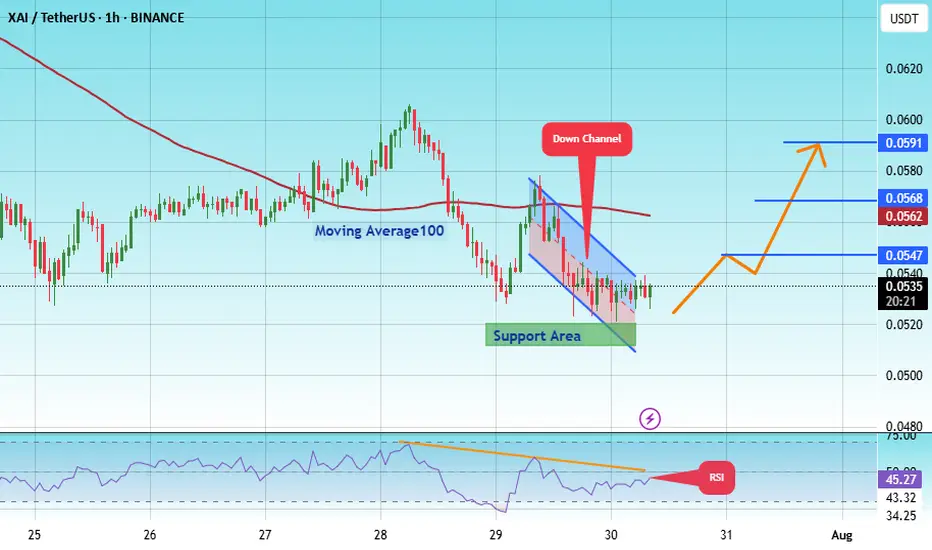
#XAI/USDT breakout Buy breakout,#XAI
The price is moving within an ascending channel on the 1-hour frame, adhering well to it, and is on its way to breaking strongly upwards and retesting it.
We have support from the lower boundary of the ascending channel, at 0.0511.
We have a downtrend on the RSI indicator that is about to break and retest, supporting the upside.
There is a major support area in green at 0.0513, which represents a strong basis for the upside.
Don't forget a simple thing: ease and capital.
When you reach the first target, save some money and then change your stop-loss order to an entry order.
For inquiries, please leave a comment.
We have a trend to hold above the 100 Moving Average.
Entry price: 0.0591.
First target: 0.0547.
Second target: 0.0568.
Third target: 0.0591.
Don't forget a simple thing: ease and capital.
When you reach your first target, save some money and then change your stop-loss order to an entry order.
For inquiries, please leave a comment.
Thank you.
Hellena | Oil (4H): SHORT to support area of 65.944.Colleagues, I previously recommended moving trades to break-even, and for good reason. It is always necessary to hedge and reduce losses—this is part of professional work.
(Breakeven=Risk Free: Move Stop loss to the entry level).
The price has nevertheless shown a stronger correction, and I now believe that the medium-term “ABC” waves have not yet formed, nor has the large “Y” wave.
This means that I expect the completion of wave “B” and then a continuation of the downward movement in wave “C.”
I consider the support area of 65.944 to be the minimum target.
Manage your capital correctly and competently! Only enter trades based on reliable patterns!

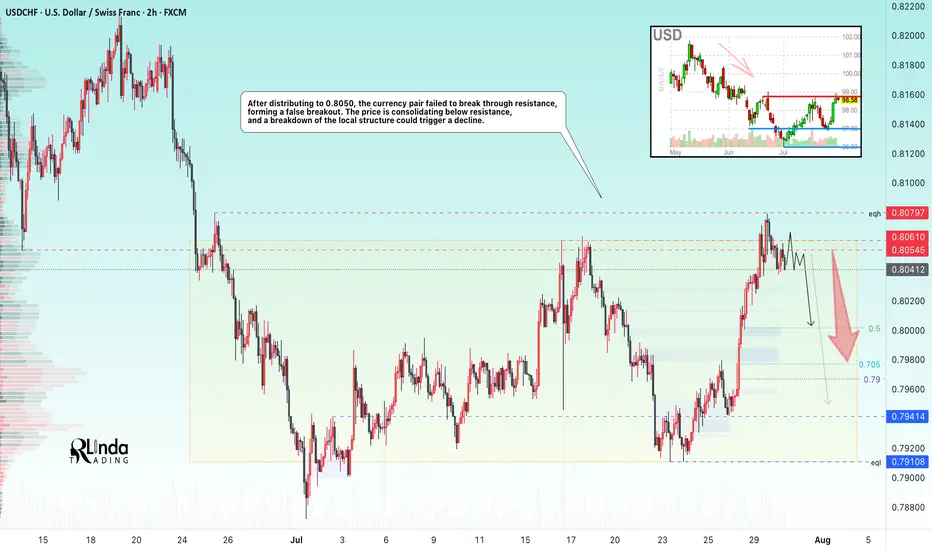
USDCHF → The resistance retest ended with a false breakoutFX:USDCHF tested resistance at 0.805 - 0.806 and formed a false breakout without the possibility of continuing growth. The global trend is downward...
Against the backdrop of the dollar's growth (reaction to news), the currency pair also moved to distribution to 0.8050. The price failed to break through resistance, forming a false breakout. USDCHF is consolidating below resistance, and a breakdown of the local structure could trigger a decline.
The dollar index is also facing fairly strong resistance and may continue its downward trend, which will also affect the decline in the USDCHF price.
Resistance levels: 0.805, 0.806, 0.81
Support levels: 0.800, 0.794, 0.791
If, within the current consolidation, the price begins to fall and break the local structure, then we can expect the decline to continue towards the specified targets!
Best regards, R. Linda!
DXY Rebound Pulls EURUSD Below 1.16Following the DXY’s significant rebound off a 17-year trendline, the EURUSD has broken below a trendline that connected all consecutive lows of 2025. This opens the door to further bearish risks, with key support levels now in sight.
If the pair closes cleanly below 1.15, 1.1440 and 1.1380, downside extensions could reach 1.12 and 1.11, respectively.
On the upside, a close back above the 2025 trendline and the 1.18 mark could reinstate bullish momentum, potentially lifting the pair toward the 2021 highs between 1.20 and 1.23.
Written by Razan Hilal, CMT
