Bitcoin (BTCUSDT) - Possible Completion of a Complex CorrectionTimeframe: 4H + 1H
Methodology: NeoWave (Glen Neely) + Smart Money Concepts (ICT/SMC)
Posted by: @CryptoPilot
⸻
🧠 NeoWave Analysis: Complex Correction Ending?
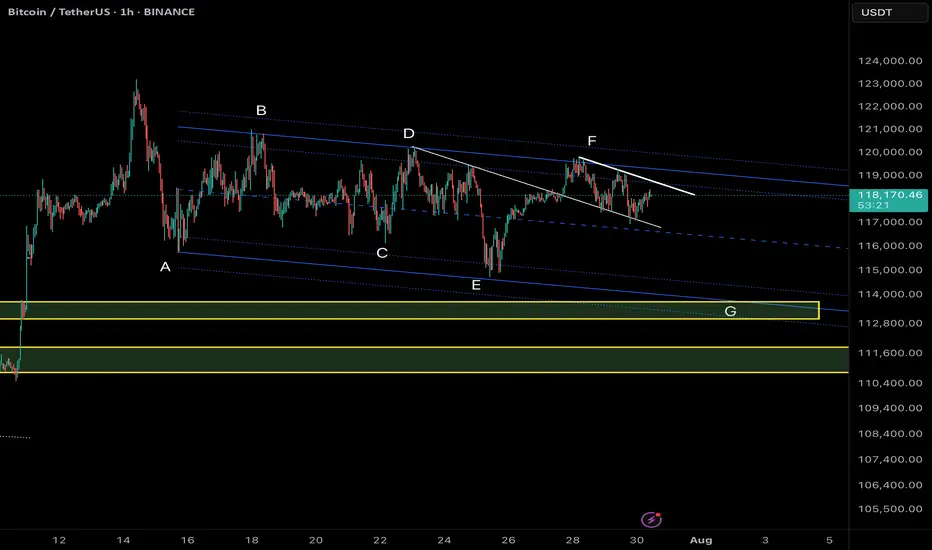
From a NeoWave perspective, BTC seems to be in the final stages of a Complex Correction that started in March 2025 from ~72k. The upward move appears to form a Contracting Diametric structure (7 legs: A–B–C–D–E–F–G), with the current leg G potentially unfolding now.
• ✅ Wave A: Sharp recovery from March lows
• ✅ Waves B–F: Alternating corrective legs with varied time and complexity
• 🔄 Wave G: Could be starting now, expected to break structure to the downside
This suggests that the entire move from March till now may represent a large Wave B, setting the stage for a deeper Wave C down.
⸻
🔍 Price Action + Smart Money Confluence
The following observations strengthen the NeoWave scenario:
• 🟨 Liquidity Pools above 120k were swept recently, creating a potential Buy-side Liquidity Grab
• 🟥 Imbalance/FVGs below 114.5k remain unfilled
• 🔻 Market Structure Shift (MSS) evident on 1H chart — lower highs forming
• 🧠 Price rejected from a key Supply Zone, aligning with end of Wave F
• 🟩 If price re-tests the internal bearish OB (near 119.5k–120k), it may provide an ideal short trigger
⸻
📌 Key Levels to Watch:
Level
Description
120.2k
Liquidity sweep zone / MSS confirmed
118k
Current structure base (pivot)
114.5k
FVG + potential Wave G target
111–112k
Strong demand zone (accumulation support)
🧭 Scenario Outlook:
Primary:
→ Price is in Wave G of a Diametric (NeoWave)
→ Likely to unfold as a 3-leg Zigzag down or a Complex combination
→ Objective: break below Wave E low and target the unmitigated imbalances
Alternative:
→ Extended Flat or Triangle, if 120.5k is broken impulsively
→ Invalidation = clean break and hold above 121k
⸻
⚠️ Risk Note:
This analysis assumes Wave G is beginning. If bulls manage to reclaim 120.5k with momentum and close above, the bearish structure will be invalidated.
⸻
💬 Final Thought:
We are potentially nearing the end of a complex corrective rally. The confluence of NeoWave structural symmetry, Smart Money traps, and market inefficiencies suggests that BTC may be preparing for a retracement. Stay alert for confirmations before executing.
⸻
📌 Follow @CryptoPilot for advanced wave structure updates, market geometry insights, and ICT-style smart money traps.
💬 Share your views or alternate wave counts in the comments!
Wave Analysis
#PYTH/USDT#PYTH
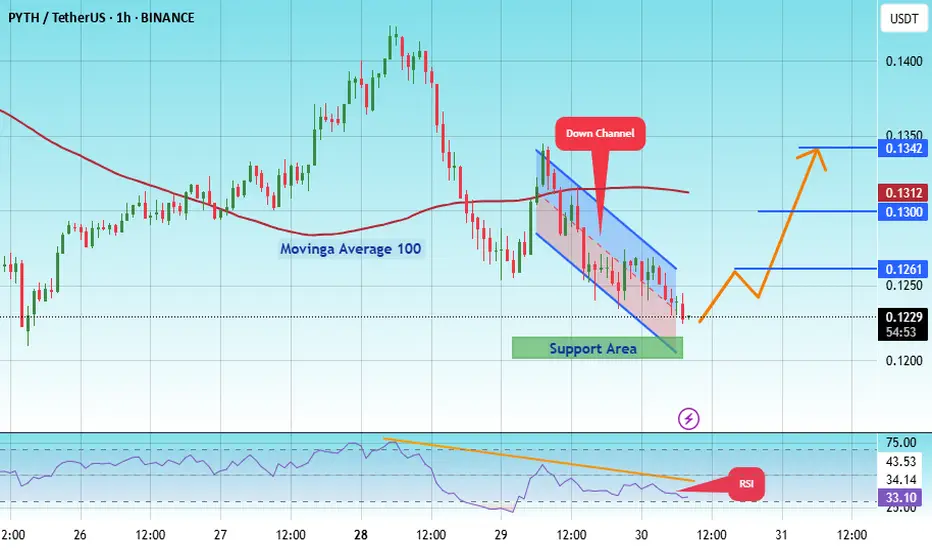
The price is moving within an ascending channel on the 1-hour frame, adhering well to it, and is on track to break it strongly upwards and retest it.
We have support from the lower boundary of the ascending channel, at 1215.
We have a downtrend on the RSI indicator that is about to break and retest, supporting the upside.
There is a major support area in green at 0.1200, which represents a strong basis for the upside.
Don't forget a simple thing: ease and capital.
When you reach the first target, save some money and then change your stop-loss order to an entry order.
For inquiries, please leave a comment.
We have a trend to hold above the 100 Moving Average.
Entry price: 0.1230
First target: 0.1261
Second target: 0.1300
Third target: 0.1342
Don't forget a simple thing: ease and capital.
When you reach your first target, save some money and then change your stop-loss order to an entry order.
For inquiries, please leave a comment.
Thank you.
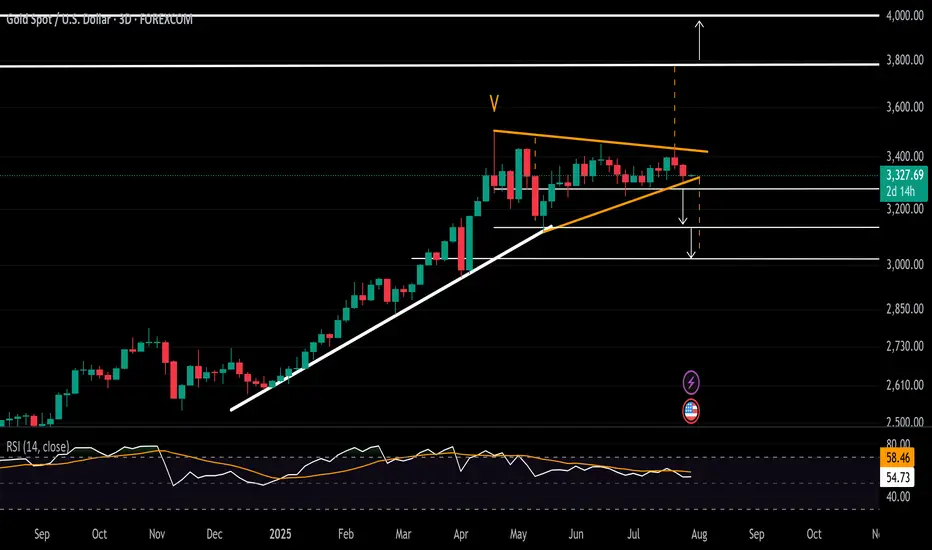
Gold Eyes Breakout From 3-Month Consolidation After reaching its record high of 3500 in April 2025, Gold entered a contracting consolidation phase for more than 3 months now, bounded between the 3500 resistance and 3100 support. This structure sets the stage for a breakout, with price action tracing five waves—raising the probability of another leg higher.
• Bullish Scenario: A close above the 3450 level could open the door to 3780 and even 4000, aligning with the broader monthly cup-and-handle formation target.
• Bearish Scenario: A close below 3300 could expose the market to downside risks, with potential retracements to 3280, 3250, 3200, and 3130.
Written by Razan Hilal, CMT
EurUsd Going Bullish 20 to 30 pipsEur usd now buy mode 20 to 30 pips .
If anyone wanted to learn this System Analysis contrect with me .

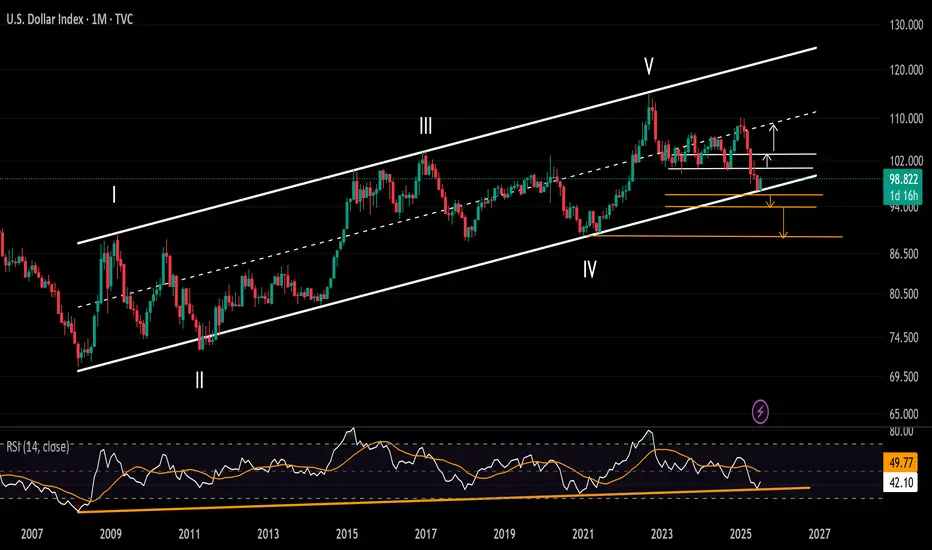
DXY Surge Pressures Currency Market in Volatile Market WeekThe US Dollar Index (DXY) has held its rebound off historical support zones on both the price chart and the RSI indicator throughout July. The monthly RSI is bouncing off a support line extending between the troughs of 2008 and 2020. Meanwhile, price action is rebounding from a support trendline that connects the lows of 2008, 2014, and 2021, within the 96–94 zone.
Bearish Scenario: A solid close below this support zone may confirm a long-term bearish signal, potentially pushing the index toward the 94 and 90 levels.
Bullish Scenario: A confident move above 100 and 103 could signal a reversal in the currency market, potentially leading the DXY back toward the mid-range of the long-standing channel between 105 and 107, originating from the 2008 lows.
Written by Razan Hilal, CMT
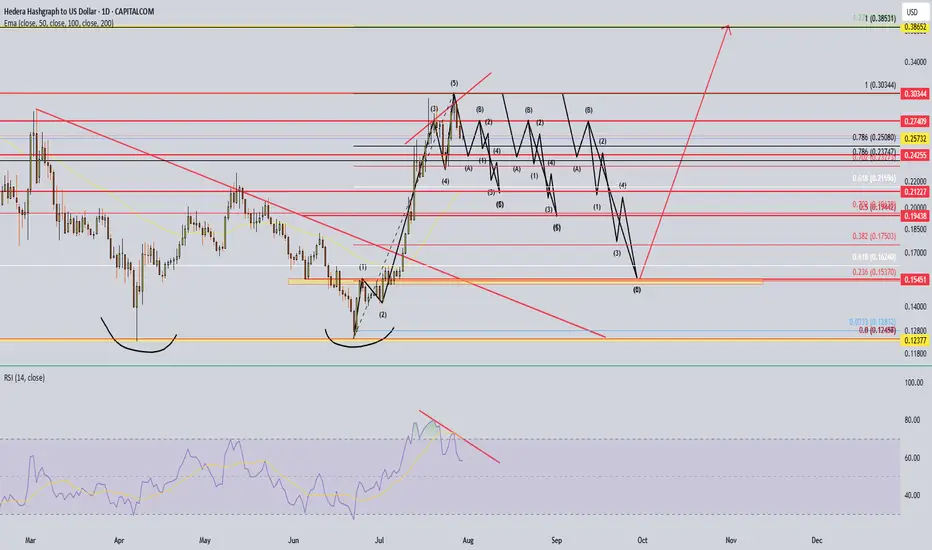
Hbar to 0.236 fib for backtest?@Dogg561 Hii
Here an update,
Hbar did a beautifull 5 move up. After this its likely it wil make an abc correction. For now just need to see a pull down for the wave A (doesnt matter where it goes), after that it needs to make a Wave B (also doesnt matter where it goes) Afther those 2 waves (A&B) you just want to count 5 waves down for the wave C (i drew 3 possible scenarios). If you put your fib tool over the complete 5 waves then you can see a super beautifull backtest on the top op wave 1 at the 0.15370 level. For now patient and wait until you see a finished abc correction to jump in again. The macro target would be 3.69 level.
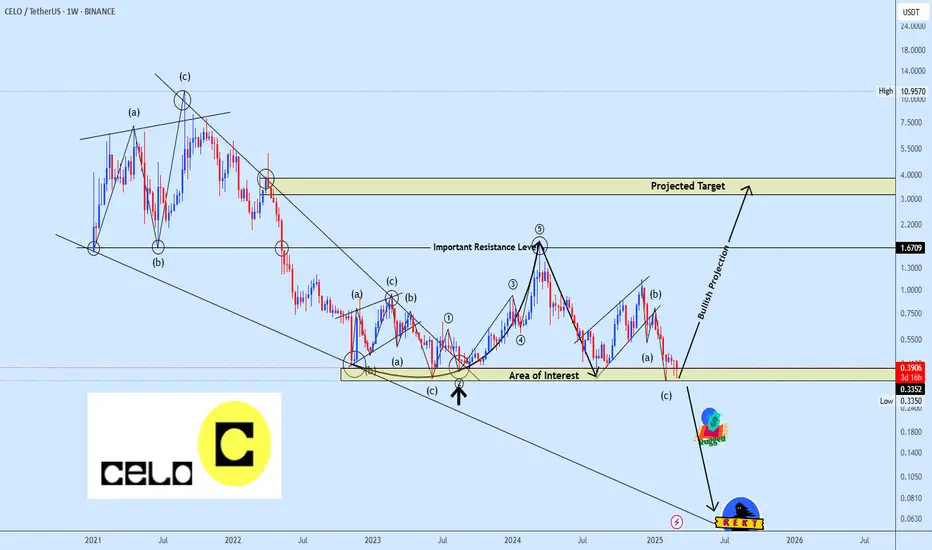
Celousdt trading ideaCELOUSDT initially broke out bullish from a falling wedge but faced strong rejection at the critical $1.67 resistance level, triggering a significant sell-off that retraced the entire breakout move.
Price has now retested the initial bottom, positioning the market for a potential double-bottom formation, contingent on the $0.3352 support holding firm. If confirmed, the projected upside target extends towards the $4 region, aligning with key structural levels.
However, a breakdown below this crucial support would invalidate the bullish scenario, exposing the asset to deeper losses and amplifying downside risks.
Market reaction at this zone will dictate the next major move.
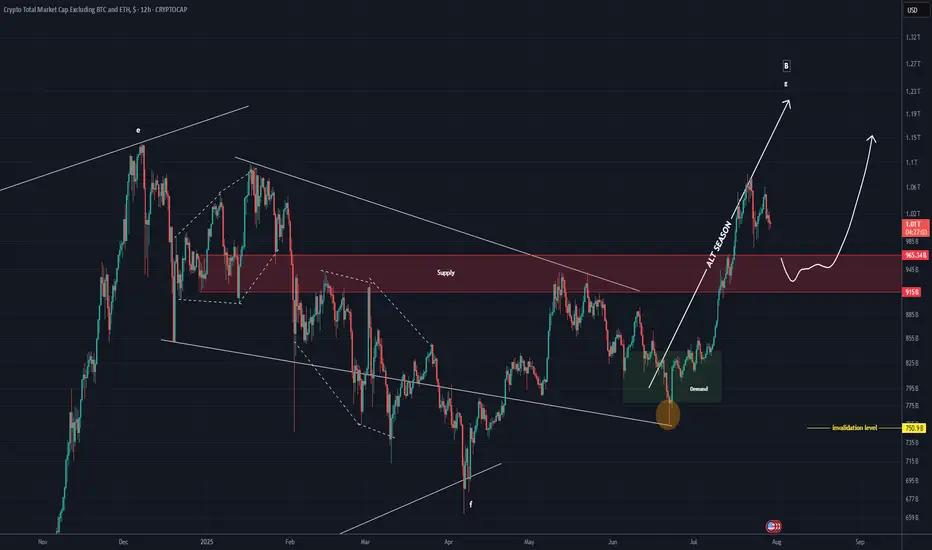
TOTAL 3 New Update (12H)This analysis is an update of the analysis you see in the "Related publications" section
This index has broken below the red zone; if a pullback to this area occurs, it may act as support again and the index could move upward
For risk management, please don't forget stop loss and capital management
Comment if you have any questions
Thank You
[XAUUSD – Intraday Price Action Outlook | 30 July 2025Gold (XAUUSD) is currently trading around 3,329 USD and is consolidating within a narrow rising channel after completing a significant downtrend. The market is showing signs of a potential breakout, either to continue a short-term bullish correction or resume the dominant bearish momentum.
Key Technical Zones:
Resistance zone: 3,339.2 – 3,348
This is a critical zone where bullish breakout confirmation is likely to attract momentum buyers. The zone aligns with upper trendline resistance and previous consolidation highs.
Support zone: 3,325.6 – 3,292.7
This range acts as a short-term support base, marked by multiple rejections and aligned with the lower boundary of the current rising wedge formation. A breakdown here could trigger strong bearish continuation.
Indicators & Confluences:
EMA200 (blue): Acting as dynamic resistance, slightly above current price.
EMA50 & EMA100: Compressing toward current price action, indicating price equilibrium and coiling volatility.
RSI (not shown): Likely hovering near 50 – signaling market indecision.
Fibonacci 0.874 has been tagged – often a zone where false breakouts or liquidity grabs occur, demanding caution.
Trading Strategy Suggestions:
Bullish Scenario (Breakout Strategy)
Entry: Buy only if price closes above 3,339.2 (confirmed breakout of wedge).
Stop-loss: Below 3,328.1 (previous supply turned demand).
Target: 3,370 – 3,392 zone (aligned with EMA200 breakout & prior structure).
Note: This setup relies on confirmation and should not be anticipated early. Wait for candle close above 3,339.2 to invalidate current wedge structure.
Bearish Scenario (Rejection & Breakdown Strategy)
Entry: Sell if price rejects 3,330–3,332 area and returns below 3,327.80 (as marked).
Stop-loss: Above 3,332.04 (above trendline and EMA cross).
Target: 3,292.74 (volume node + base of channel).
Risk/Reward: >7.0 (based on current tool parameters shown in chart).
This is a favorable setup if price respects current wedge resistance and fails to breakout convincingly.
Conclusion:
Gold is at a decisive point. The formation of a rising wedge in a prior downtrend signals potential bearish continuation, but a breakout above 3,339.2 could trigger a reversal short-term. Both bulls and bears need confirmation before entering. Monitor volume closely — rising volume on breakout/breakdown will validate either scenario.

20250730-XAUUSD IdeaSupport was found at the key level of 3310. The ADP report is scheduled to be announced at 8:15 p.m. today. Monitoring whether the price continues to break lower or begins an ABC retracement following the strong downward impulse.

TSLA: short as short can...below 200 certainly worth considering a reentry, but currently not sure if it will stop at 200 of 150.

bullish move can start. good risk reward swing tradePerfect spot to buy as comppany has also shown positive quaterly result.
small time swing trade

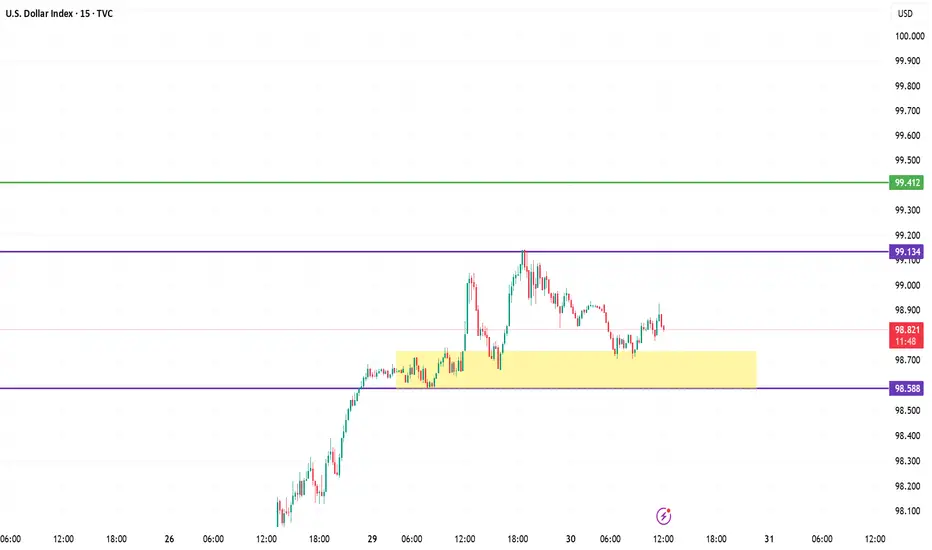
U.S. Dollar Index (DXY) – July 30, 2025 | 15-Min Chart1. **Range-Bound Structure**
DXY is consolidating between 98.588 support and 99.134 resistance. The 98.68–98.74 zone has acted as demand, but repeated retests show weakening buyer interest.
2. **Failed Breakouts**
Multiple rejections at 99.134 indicate it's a trap zone where sellers absorb buy-side pressure.
3. **Bearish Momentum Signs**
Lower highs and wicks into resistance with weak closes suggest distribution. Momentum likely shows bearish divergence.
4. **Critical Levels**
* **Support:** 98.588 — a break below this opens downside potential.
* **Resistance:** 99.134 — bulls need a strong breakout above this for continuation to 99.41+.
Summary:
Sellers dominate below 99.134. If 98.588 breaks, expect bearish continuation. Only a confirmed breakout above 99.134 shifts bias bullish.
BITCOIN Will Move Higher! Long!
Take a look at our analysis for BITCOIN.
Time Frame: 2h
Current Trend: Bullish
Sentiment: Oversold (based on 7-period RSI)
Forecast: Bullish
The price is testing a key support 118,043.14.
Current market trend & oversold RSI makes me think that buyers will push the price. I will anticipate a bullish movement at least to 119,900.74 level.
P.S
The term oversold refers to a condition where an asset has traded lower in price and has the potential for a price bounce.
Overbought refers to market scenarios where the instrument is traded considerably higher than its fair value. Overvaluation is caused by market sentiments when there is positive news.
Disclosure: I am part of Trade Nation's Influencer program and receive a monthly fee for using their TradingView charts in my analysis.
Like and subscribe and comment my ideas if you enjoy them!

USDCAD Is Bearish! Sell!
Please, check our technical outlook for USDCAD.
Time Frame: 7h
Current Trend: Bearish
Sentiment: Overbought (based on 7-period RSI)
Forecast: Bearish
The market is trading around a solid horizontal structure 1.377.
The above observations make me that the market will inevitably achieve 1.369 level.
P.S
We determine oversold/overbought condition with RSI indicator.
When it drops below 30 - the market is considered to be oversold.
When it bounces above 70 - the market is considered to be overbought.
Disclosure: I am part of Trade Nation's Influencer program and receive a monthly fee for using their TradingView charts in my analysis.
Like and subscribe and comment my ideas if you enjoy them!

GBPUSD Is Very Bullish! Buy!
Here is our detailed technical review for GBPUSD.
Time Frame: 1D
Current Trend: Bullish
Sentiment: Oversold (based on 7-period RSI)
Forecast: Bullish
The market is testing a major horizontal structure 1.334.
Taking into consideration the structure & trend analysis, I believe that the market will reach 1.358 level soon.
P.S
Overbought describes a period of time where there has been a significant and consistent upward move in price over a period of time without much pullback.
Disclosure: I am part of Trade Nation's Influencer program and receive a monthly fee for using their TradingView charts in my analysis.
Like and subscribe and comment my ideas if you enjoy them!

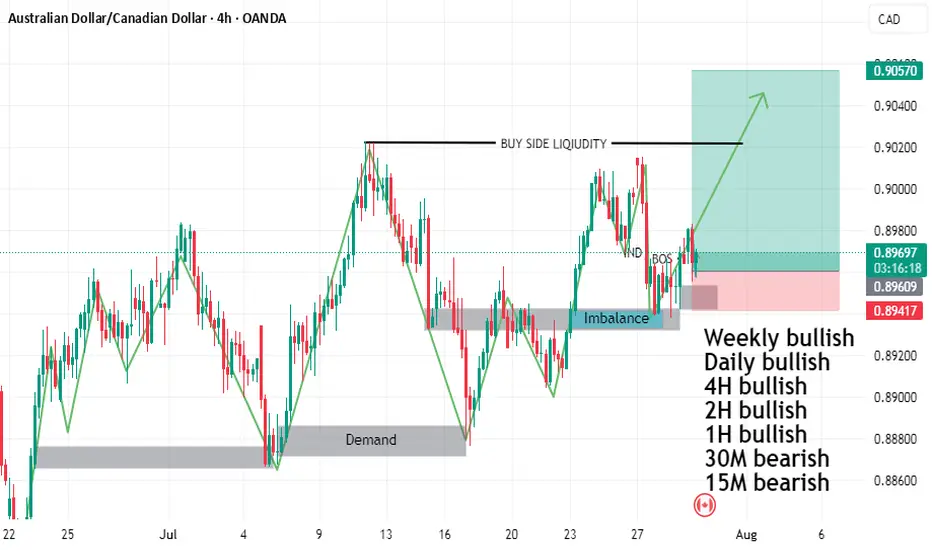
AUDCAD Is Going Up! Long!
Take a look at our analysis for AUDCAD.
Time Frame: 12h
Current Trend: Bullish
Sentiment: Oversold (based on 7-period RSI)
Forecast: Bullish
The market is approaching a key horizontal level 0.896.
Considering the today's price action, probabilities will be high to see a movement to 0.905.
P.S
Please, note that an oversold/overbought condition can last for a long time, and therefore being oversold/overbought doesn't mean a price rally will come soon, or at all.
Disclosure: I am part of Trade Nation's Influencer program and receive a monthly fee for using their TradingView charts in my analysis.
Like and subscribe and comment my ideas if you enjoy them!

Get Ready to Sell...I'm expecting another swing high (probably by FOMC upcoming statement) just before a an almost 80% drop!
Get ready to sell your PEPE and other crypto before the huge drop.
YOU HAVE BEEN WARNED !!!


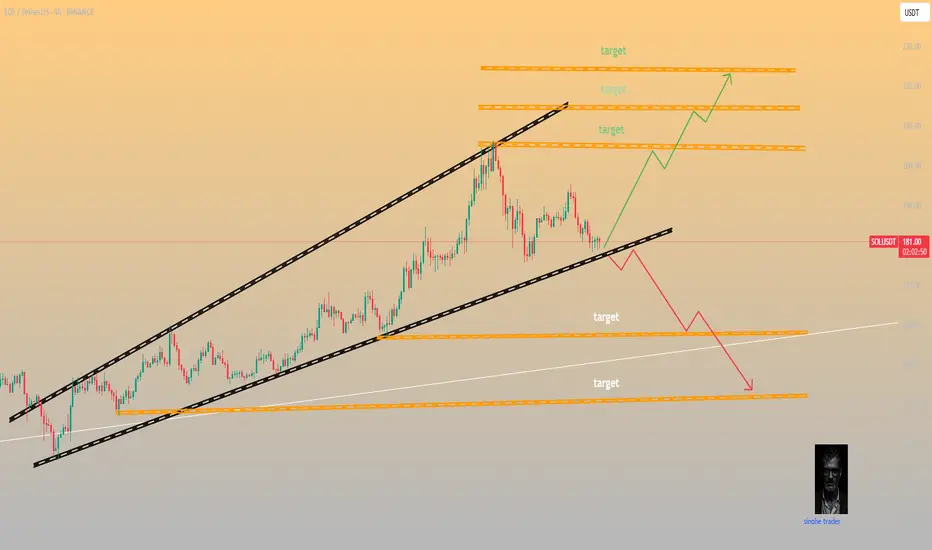
SOL Both scenarios are valid! SOL is still bullishSOL Both scenarios are valid! SOL is still bullish
SOL is in a critical zone. The price is still inside a large bullish pattern and as long as it stays inside the pattern, the trend remains bullish and SOL should follow the bullish scenario.
The bullish targets are at 205, 214 and 224
It may happen that the FOMC will bring surprises, so if SOL manages to break below the pattern, it will activate the bearish scenario after that and the chances of falling will increase further as shown in the red scenario.
The bearish targets are at 160 and 139
You may find more details in the chart!
Thank you and Good Luck!
PS: Please support with a like or comment if you find this analysis useful for your trading day
GBPJPY Is Very Bearish! Sell!
Please, check our technical outlook for GBPJPY.
Time Frame: 7h
Current Trend: Bearish
Sentiment: Overbought (based on 7-period RSI)
Forecast: Bearish
The market is trading around a solid horizontal structure 199.004.
The above observations make me that the market will inevitably achieve 198.074 level.
P.S
Please, note that an oversold/overbought condition can last for a long time, and therefore being oversold/overbought doesn't mean a price rally will come soon, or at all.
Disclosure: I am part of Trade Nation's Influencer program and receive a monthly fee for using their TradingView charts in my analysis.
Like and subscribe and comment my ideas if you enjoy them!

AUDCAD BUY SETUPTHE PRICE FORMED HEAD AND SHOULDER
and do rejection from mitigation order block and imbalance
and we have liquidity on time frame daily buy side liquidity
and time frame weekly double top
so I will buy with you
DON'T forget to follow me so that get more refresh analysis
USD/JPY BEARS ARE GAINING STRENGTH|SHORT
USD/JPY SIGNAL
Trade Direction: short
Entry Level: 147.871
Target Level: 145.815
Stop Loss: 149.230
RISK PROFILE
Risk level: medium
Suggested risk: 1%
Timeframe: 1D
Disclosure: I am part of Trade Nation's Influencer program and receive a monthly fee for using their TradingView charts in my analysis.
✅LIKE AND COMMENT MY IDEAS✅
