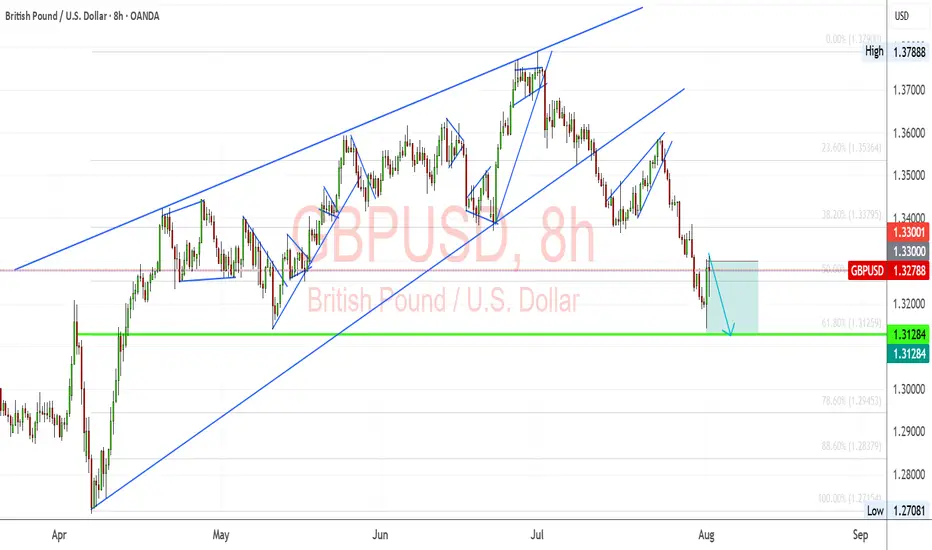
GBPUSD: Bearish Momentum vs. Fundamental Repricing – Key LevelsGBPUSD is at a critical juncture, balancing a clear technical breakdown with a fundamental backdrop favoring near-term volatility. The pair has slipped from its rising wedge structure and is now testing key retracement zones while markets reprice expectations for Fed rate cuts after weak US jobs data. Traders are closely watching whether this bearish momentum will extend toward the 1.3128 support or if a rebound from oversold conditions could trigger a corrective bounce.
Technical Analysis (8H Chart)
Pattern: Clear breakdown from a rising wedge, confirming bearish bias.
Current Level: Price sits near 1.3278, struggling to reclaim the 1.3300 resistance zone.
Key Support Zones:
1.3128 (61.8% Fibonacci retracement) – main bearish target.
1.2945 (78.6% retracement) – extended downside target if selling pressure deepens.
Resistance Levels:
1.3300 (immediate resistance, prior support now flipped).
1.3380 (secondary resistance if a retracement rally occurs).
Projection: Likely bearish continuation toward 1.3128, with a potential retest of 1.3300 before continuation.
Fundamental Analysis
Bias: Bearish in the short term, but Fed policy and risk sentiment remain key drivers.
Key Fundamentals:
USD: Weak NFP (73K), higher unemployment (4.2%), and downward revisions boost Fed cut bets (~75% for September), typically a USD-negative factor.
GBP: BOE maintains a cautious stance due to sticky inflation but lacks clear hawkish conviction as growth slows.
Tariffs: US tariffs add a mild negative weight on GBP trade sentiment.
Risks:
Hot US CPI could slow Fed cut bets, supporting USD.
Hawkish BOE comments could limit GBP downside.
Global risk sentiment shifts could either favor USD (risk-off) or weaken it further (risk-on).
Key Events:
US CPI and PPI for USD direction.
BOE policy updates and UK CPI.
US jobless claims and Fed commentary.
Leader/Lagger Dynamics
GBP/USD is a lagger, mainly reacting to USD shifts. However, its moves directly influence GBP crosses such as GBP/JPY and GBP/CHF.
Summary: Bias and Watchpoints
GBP/USD remains in a bearish phase, targeting 1.3128 with a potential corrective bounce toward 1.3300 first. The primary driver is the technical breakdown, while fundamentals add volatility around US CPI and BOE policy. If CPI surprises lower, the bearish outlook could reverse into a short-term rebound; if CPI is hot, downside momentum could extend. You should monitor USD-driven events closely as GBP/USD sets the tone for broader GBP movements.
Wave Analysis
#PEPE/USDT or Breakdown? PEPE Eyes 0.00001166 Target !#PEPE
The price is moving within a descending channel on the 1-hour frame and is expected to break and continue upward.
We have a trend to stabilize above the 100 moving average once again.
We have a downtrend on the RSI indicator that supports the upward break.
We have a support area at the lower boundary of the channel at 0.00000980, acting as a strong support from which the price can rebound.
We have a major support area in green that pushed the price upward at 0.00000990.
Entry price: 0.00001030.
First target: 0.00001075.
Second target: 0.00001120.
Third target: 0.00001166.
To manage risk, don't forget stop loss and capital management.
When you reach the first target, save some profits and then change the stop order to an entry order.
For inquiries, please comment.
Thank you.

The Great XRP Escape Plan: Thief Strategy Deployed🌀 XRP/USDT – Thief Trader’s Master Heist Plan: Crack the Vault Before They Catch On! 🧠💰
🔐💸 Operation Code: Ripple Raid 3.9 - Eyes on the Prize, Hands on the Trigger 💥
🌍 Attention Global Market Robbers and Strategic Money Movers!
This ain't just another analysis—this is the Thief Trading Style Blueprint, surgically designed for the XRP/USDT Crypto Market. Whether you're a silent sniper or full-squad raider, this trade setup is your next high-voltage money heist.
🔍 Market Breakdown:
📊 Technical + Fundamental = Robbery Precision
Currently, Ripple (XRP) is showing bullish fuel—charging into our trap-the-bears zone. Volatility is tightening, resistance is trembling, and it smells like liquidity is about to get stolen.
⚠️ Warning: The market’s at a risky cross-zone – overbought with heavy consolidation – where big bears and trapped traders usually play defense. That’s exactly where we strike.
🔓 Entry Gameplan – “Wait, Trigger, Execute”
📈 Entry:
"The heist begins when the candle breaks the high and screams confirmation!"
Set Buy Stop Orders above the recent resistance (around 3.1000).
Alternatively, use Buy Limit Orders on pullbacks at key swing levels (15M or 30M timeframes).
We use a multi-layered entry strategy (aka DCA + stacking like a pro thief stacking vaults). Be surgical. Be patient.
📌 Pro Tip: Always set a chart alert at the trigger zone to avoid missing the breakout party.
🛑 Stop Loss – “Breakout First, Then Talk Safety”
🚫 NO SL BEFORE BREAKOUT. Period.
Once price breaks out, then:
🔐 SL = Nearest 4H candle wick swing low (around 2.8000).
But remember, your SL = your risk appetite.
Whether you're placing 1 big order or 10 mini traps, manage it smart.
🎯 Target – "Get Rich, Then Vanish"
🏴☠️ Primary Take Profit Zone:
Target: 3.9000
Or exit anytime you see signs of reversal.
Don't get greedy—get paid.
👀 Scalpers’ Note:
Only play the Long side.
If you're deep-pocketed, dive in straight. If not, ride with swing traders and trail your SL to protect profits.
🔥 Why This Trade is 🔐:
📈 Current price structure, liquidity zones, and momentum favor bulls.
📊 Correlated intermarket signals + on-chain activity + macro backdrop align with XRP strength.
🧠 Smart money accumulation is visible – this is your window before the big breakout.
🚨 News & Position Management Alert:
📢 Stay clear of opening trades during major news events.
Use Trailing Stop-Loss on running positions to lock gains while letting profits fly.
This is not hype. This is precision.
Thief Trader doesn’t guess – we plan, we trigger, we exit.
📌 Final Words:
Whether you're scalping seconds or swinging for days – follow the blueprint. XRP has a vault to crack, and we’re here to rob it clean.
Now go out there, set those traps, and let the market pay you like it owes you.
🧠💸🕶️ Next Heist Plan Coming Soon… Stay Sharp.

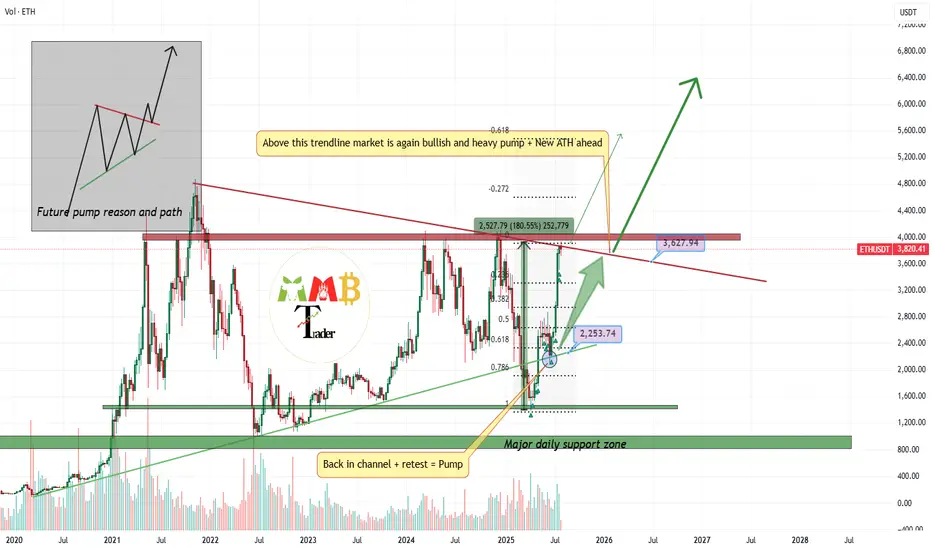
4000$ is last resistance left Ready for breakout and pump?market is still bullish and i am looking for breakout here to the upside for sure But we should consider this factor that major resistance now is touching and we may have first short-term fall.
so for now we may have correction and dump to the targets like 3300$ which is first support of 0.23 Fibonacci level.
and after this healthy correction or without it we can expect more pump and breakout of 4K$ and heavy pump to the targets like 7K$.
DISCLAIMER: ((trade based on your own decision))
<<press like👍 if you enjoy💚
BTCUSDT: Elliot Wave AnalysisAs you can see in the chart, the fourth wave has ended and there is a possibility of an increase in the next stage to the level between 128,000 and 131,000, followed by a correction for a larger fourth wave and finally the last leg of the increase to the fifth wave, which has the possibility of reaching 139,000 to 140,000.

EUR/USD Reversal or Trap? 4H Clean Breakdown InsidePrice just tapped into a high-probability sell zone after a corrective Wave 2 structure. With sellers already active at 1.16342 and 1.17635, this setup is not just textbook—but a potential goldmine for swing traders.
🔻 Is this Wave 3 continuation about to begin?
🔍 Liquidity swept. Zones respected. Structure still bearish.
⚠️ Many traders will miss the bigger picture here—will you?
👇 Drop your thoughts:
Are we about to break 1.13000?
Do you agree with the Elliott Wave count?
What’s your bias on DXY?
💬 I personally reply to every comment—let’s build this chart together.
🔥 If you caught the entry, show your entry point and reasoning—let’s level up as a team.

Short Term Crypto Total Market CapHere are the 2 scenarios which I can imagine for the short-term move of the crypto market with respective invalidation levels and trade ideas.

TESLA: Bullish Continuation & Long Trade
TESLA
- Classic bullish setup
- Our team expects bullish continuation
SUGGESTED TRADE:
Swing Trade
Long TESLA
Entry Point - 302.63
Stop Loss - 296.98
Take Profit - 312.87
Our Risk - 1%
Start protection of your profits from lower levels
Disclosure: I am part of Trade Nation's Influencer program and receive a monthly fee for using their TradingView charts in my analysis.
❤️ Please, support our work with like & comment! ❤️

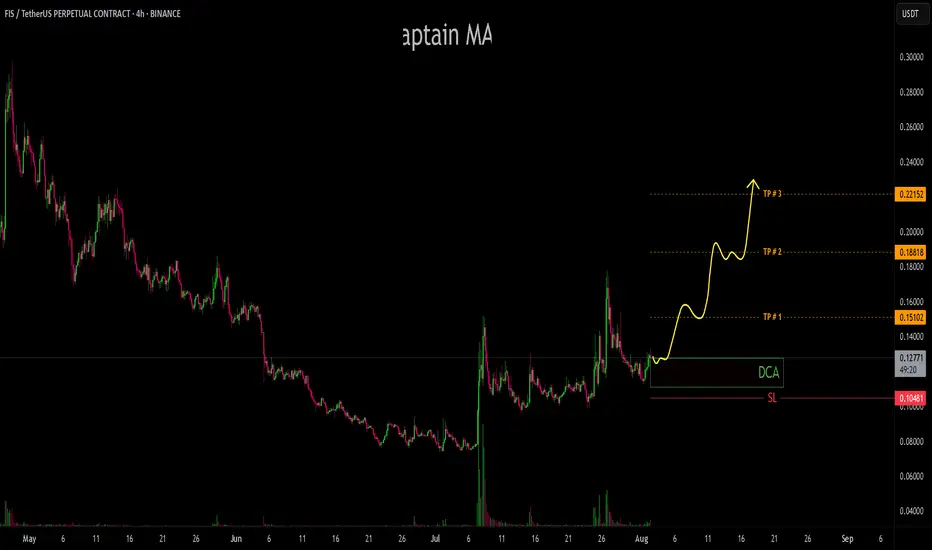
FIS/USDTFIS has shown an aggressive push from buyers, confirming strong demand as the price consistently defends the $0.10–$0.11 zone as solid support. This accumulation range has held firm despite market volatility, indicating a possible base formation. signaling momentum building for a breakout.
BTCUSD ideaWe are waiting for our asset to reach our action zone, and based on the reaction, we’ll decide on our next moves.ALWAYS WAIT FOR A CONFIRMATION TO SEE IF THE PRICE VALIDATES THE ZONE.and you what is your vision of the EURUSD its interests me! i wait you in the commentary

ETHUSDT: Elliot Analysis You can see the Ethereum chart in the long term, which indicates the end of the fourth wave and the beginning of the fifth wave, so with capital management, you can have a good investment.

USDJPY Is Very Bearish! Sell!
Here is our detailed technical review for USDJPY.
Time Frame: 9h
Current Trend: Bearish
Sentiment: Overbought (based on 7-period RSI)
Forecast: Bearish
The market is on a crucial zone of supply 150.492.
The above-mentioned technicals clearly indicate the dominance of sellers on the market. I recommend shorting the instrument, aiming at 148.583 level.
P.S
We determine oversold/overbought condition with RSI indicator.
When it drops below 30 - the market is considered to be oversold.
When it bounces above 70 - the market is considered to be overbought.
Disclosure: I am part of Trade Nation's Influencer program and receive a monthly fee for using their TradingView charts in my analysis.
Like and subscribe and comment my ideas if you enjoy them!

TON/USDT – Daily Price Action Analysis🔹 Price has broken a major descending trendline and entered an ascending channel.
🔹 Currently testing the mid-range resistance zone around $3.60 – $3.70.
🔹 If buyers hold above this area, the next targets could be $4.40 – $4.80.
🔹 If rejected, key supports are at $3.20 and $2.90.

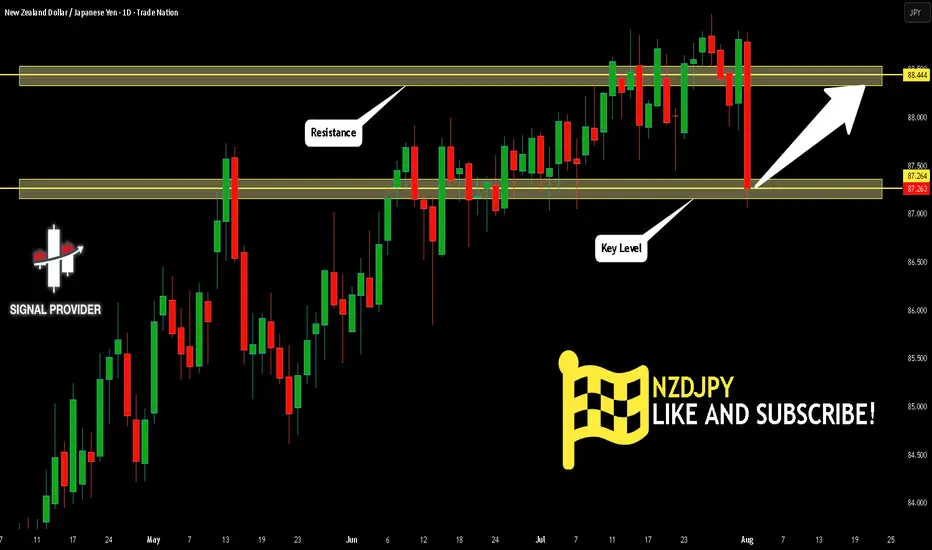
NZDJPY Will Go Up! Buy!
Here is our detailed technical review for NZDJPY.
Time Frame: 1D
Current Trend: Bullish
Sentiment: Oversold (based on 7-period RSI)
Forecast: Bullish
The market is testing a major horizontal structure 87.264.
Taking into consideration the structure & trend analysis, I believe that the market will reach 88.444 level soon.
P.S
Overbought describes a period of time where there has been a significant and consistent upward move in price over a period of time without much pullback.
Disclosure: I am part of Trade Nation's Influencer program and receive a monthly fee for using their TradingView charts in my analysis.
Like and subscribe and comment my ideas if you enjoy them!
NAS100 Trade Idea: Liquidity Sweep & Bullish Reversal Potential📊 NASDAQ 100 (NAS100) Trade Outlook 📈
The NASDAQ 100 is holding a strong bullish trend on the higher timeframes 🟢. However, we’re currently seeing a notable pullback into a key support zone ⚠️ — price has dipped beneath previous lows, tapping into what appears to be an institutional accumulation range 🏦.
This move is likely targeting the liquidity resting below those lows 💧, where sell stops are positioned. Price is also reacting off a significant bullish order block 🧱 — a confluence area that could produce a strong reversal.
🎯 What to look for next:
Wait for a bullish break in market structure 🔁 to confirm a potential entry. If that occurs, consider a long setup with your stop loss below the swing low 🛑 and a 1:2 risk-to-reward target 🎯.
🚫 This is for educational purposes only and not financial advice.

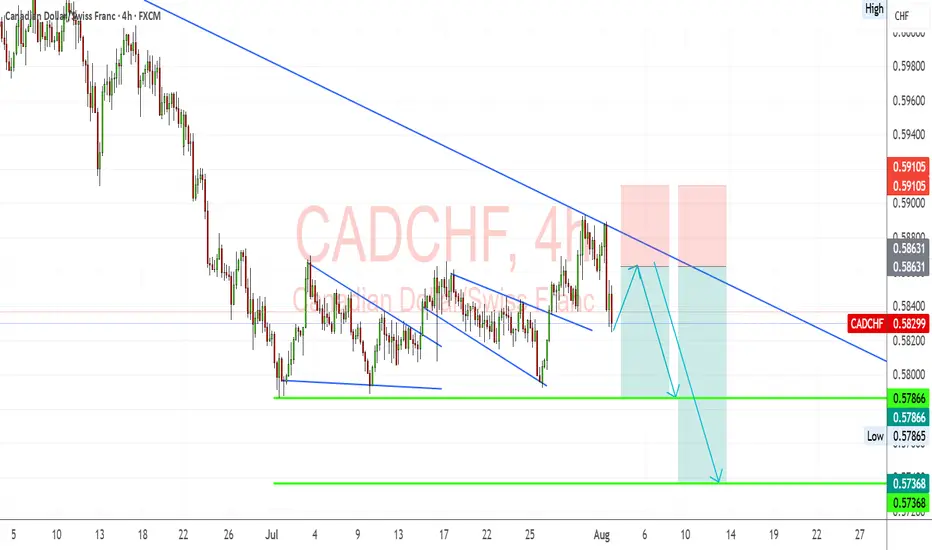
CAD/CHF: Bearish Trend Resumes After Retest of Downtrend LineCAD/CHF continues to respect its prevailing downtrend, with price reacting from the descending trendline and showing signs of renewed bearish pressure. Fundamentals support further downside as CAD remains weighed by weak domestic data, while CHF holds steady as a safe-haven currency amid global tariff concerns.
Technical Analysis (4H Chart)
Trend: Strong downtrend structure, with repeated rejections from the descending trendline.
Current Level: 0.5829, consolidating after failing to break above 0.5863 resistance.
Key Support Levels:
0.5786 (near-term support and first bearish target).
0.5736 (secondary support and next major target).
Resistance Levels:
0.5863 (immediate resistance at descending trendline).
0.5910 (upper resistance if a breakout occurs).
Projection: Likely pullback toward 0.5863 (retest zone) before continuation to 0.5786 and possibly 0.5736.
Fundamental Analysis
Bias: Bearish.
Key Fundamentals:
CAD: Weak Canadian manufacturing PMI and trade risks from US tariffs limit CAD upside.
CHF: Swiss Franc remains supported by safe-haven demand amid tariff uncertainty.
Oil Prices: Stable oil offers partial CAD support but insufficient to change the broader trend.
Risks:
A sharp rise in oil prices could strengthen CAD.
Global risk-on sentiment could weaken CHF and lift CAD/CHF.
Key Events:
BoC policy updates.
SNB stance and global risk sentiment shifts.
Oil market data.
Leader/Lagger Dynamics
CAD/CHF is a lagger, following CAD’s performance relative to oil and CHF’s safe-haven flows.
Summary: Bias and Watchpoints
CAD/CHF remains bearish, with price respecting the downtrend and targeting 0.5786 initially. A break below this level opens the door to 0.5736. The key watchpoints are oil price fluctuations, global risk sentiment, and potential safe-haven demand for CHF.
xauusdxauusd Focus on red line
From the price level of 3368 and above, gold is expected to pull back at least until the Stochastic on the M30–H1 timeframes reaches oversold levels.
After that, a bullish continuation is likely, pushing the price up to around 3400.
This area will be a critical decision point — determining whether the market will continue its uptrend or reverse into a downtrend.
If the H4 chart prints a reversal candlestick pattern, it would indicate the beginning of a bearish trend, which could potentially lead to a downward movement of up to 20,000 points.

Crypto Market Slows Down For A Pullback Within A Bullish TrendGood morning Crypto traders! Cryptocurrencies are coming slightly lower on the intraday basis due to stock market decline yesterday, but we still see them approaching support, so still be aware of a bounce and recovery at the end of the week or maybe next week because of an upcoming weekend. Crypto TOTAL market cap chart can be trading in wave »y« of a complex w-x-y correction in wave 4, unless it's a flat correction, but support is the same at 3.6T – 3.5T area, from where we may see a bullish continuation within wave 5.

ZM: Cross-Cycle Knot in Triangle🏛️ Research Notes
Original
Alternative Interconnection Experimenting with cross-cycle interconnection so coordinates of the 3 point of fib channels are placed on structure's latest connecting point while abiding its original angles.
When elements are extended we have a projection that looks like this:
Other aspects of the shape are being tested
Fibonacci Channels based on angle of the trend fragments the cycle creating probabilistic levels. (The steeper the angle of the FC the more it relates to time axis.)

GOLD → The market is waiting for NFP. What could happen?FX:XAUUSD is bouncing off resistance at 3310, confirming the upper limit of the new trading range. The dollar continues to rally, but the market as a whole is stagnating ahead of upcoming news—NFP is coming up!
Gold is consolidating at monthly lows around $3268, awaiting key US labor market data (NFP). Trump's new tariffs (10% globally, 35% for Canada, 39% for Switzerland) have boosted demand for the dollar, putting pressure on gold. Markets are waiting for NFP: forecast +110K jobs, unemployment 4.2%. Weak data (<100K) → gold may rise to $3400. Strong (>150K) → the dollar will strengthen, gold will continue to fall. The probability of a Fed rate cut in September is <50%.
Based on yesterday's data, I would cautiously suggest that NFP will be in the range of 125K–145K, slightly above the consensus (110K). This will play into Trump's hands (I think you understand what I mean...).
Resistance levels: 3300, 3310, 3320
Support levels: 3287, 3268, 3255
The news has a negative nuance — unpredictability. Be careful.
Technically, based on the data we have at the moment, I would assume that the market may test resistance at 3300-3310 before a possible pullback to the specified support. BUT! Unpredictable data could turn the game around, and in that case, if the dollar falls, gold could start to rise.
Best regards, R. Linda!

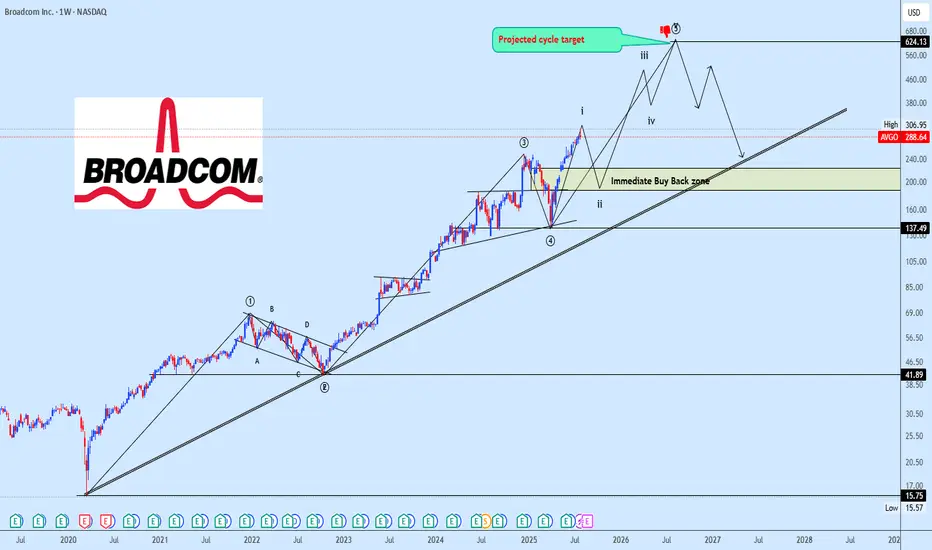
AVGO Bullish Impulse Wave Structure in ProgressAVGO continues its macro advance with a clear 5-wave impulse structure unfolding. The current price action marks the completion of subwave (i) of wave ⑤, setting the stage for a corrective pullback into subwave (ii).
We expect this corrective leg to reach into the 38.2%–50% Fibonacci retracement zone of subwave (i), which will serve as a potential re-accumulation area before the next bullish expansion.
The strategy remains to monitor the development of wave (ii) closely, waiting for key price reaction around the identified retracement zone to build positions in anticipation of subwave (iii) of ⑤ typically the strongest and most impulsive move in Elliott Wave structure.
Targets are shared on the chart for clarity. Patience here is key as we await the right entry zone aligned with technical confluence.
📌 Drop your stock requests in the comment section for quick chart updates — only equity-based assets will be accepted under this post.
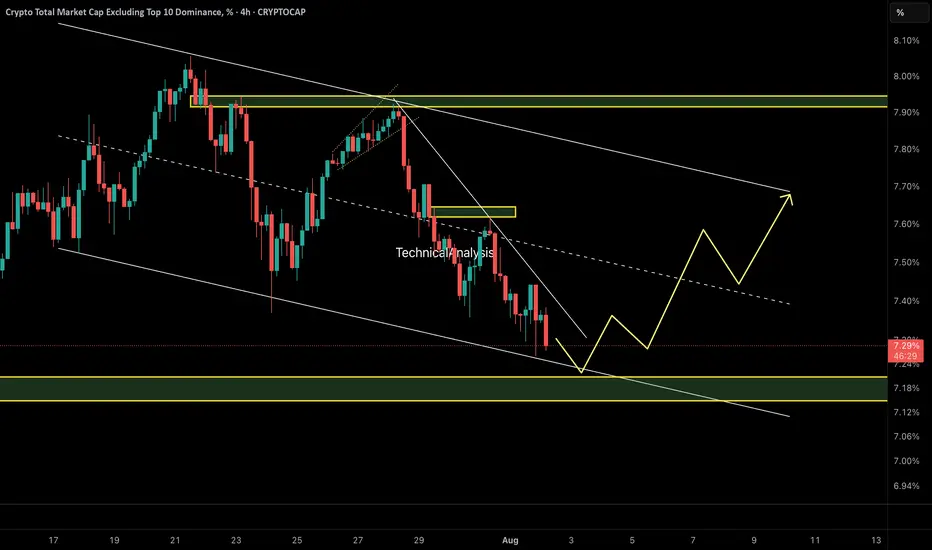
OTHERS.D – Perfect Reaction to Previous AnalysisAs predicted in the last update, OTHERS.D broke structure and dropped sharply toward the 7.20% demand zone — exactly as expected.
Now, we’re waiting for a potential bullish reaction from this key area. If demand holds, a move toward the upper channel boundary (~7.70%) could follow.
🧭 Technical Outlook:
• Price tapped into a key demand zone at 7.20%, which aligns with the lower boundary of a descending channel.
• A bullish reaction is forming, suggesting short-term strength in altcoins.
• A move toward the channel top near 7.70% is now on the table if demand holds.
⚠️ Important Note:
This move is likely to remain a corrective rally unless we see a proper breakout above 7.70% with volume and structure shift. Be selective with altcoin longs.
🔍 Watch for:
• Reaction at 7.50% midline
• Price behavior at 7.70% resistance
• Structure shift or failure pattern near channel top
⚠️ Caution: This remains a corrective rally unless price breaks 7.70% with structure shift.
🔗 Analysis by CryptoPilot
Ethereum: Smart Money Reversal After Stop Hunt?In the previous update, we warned that Ethereum might drop lower before any meaningful bounce — especially if it failed to hold the midline of the ascending channel. That scenario played out exactly as anticipated.
🟡 Price action summary:
ETH broke below the midline of the weak ascending channel, hunted the liquidity below recent lows, and tapped into the key bullish order block near $3,490 – $3,520. Price is now reacting to this zone with early signs of a reversal.
📌 Key observation:
Midlines of weak or low-momentum channels often act as liquidity traps in smart money models. Buying at these levels can be extremely risky — especially during corrective or distribution phases.
⸻
📚 Educational Note:
Never enter long positions solely at the midline of a weak ascending channel, especially when there’s a high probability of liquidity sweep below. Smart entries usually occur at order blocks formed after stop hunts.
⸻
🎯 Next steps:
Wait for confirmation (such as internal BOS or FVG closure) before entering longs. The structure suggests a potential move back toward the upper boundary of the channel if this OB holds.
⸻
🔗 Save this analysis and share it with fellow traders.
💬 Thoughts? Drop your view in the comments.
