$NVO offers solid risk to reward for long term buyers! - I had previously called out that NYSE:NVO would have more pain to come when it was in $85-90s I have attached the link with this post for my reader's reference.
- Now, I am turning bullish on this name given these prices and compressed multiples for the growth prospects it offers.
Fundamentally,
Year | 2025 | 2026 | 2027 | 2028
EPS | 3.93 | 4.78 | 5.41 | 5.97
EPS growth% | 25.41% | 21.60% | 13.19% | 10.24%
For a quality name growing EPS > 20% deserves a fair forward multiple of 25.
| Year | Bear (fp/e = 15) | Cons. Base (f. p/e = 20) | Base (fpe = 25) | Bull Case (fpe=30)
| 2025 | $58.95 | $78 |. $98.25. |. $117.9
| 2026 | $71.7 | $95 |. $119. |. $143.4
| 2027 | $81.15 | $108 |. $135 | $162.3
| 2028 | $90 | $119 |. $149.25 | $179.1
As you can see, If you buy NYSE:NVO under $60 then you will be making money even if multiple remains compressed i.e bear case. Only thing you have to do is hold and returns would amplify once there is optimism back in the market which will lead to multiple expansion.
My fair value for NYSE:NVO for this year is $78 based on the conservative base case.
Wave Analysis

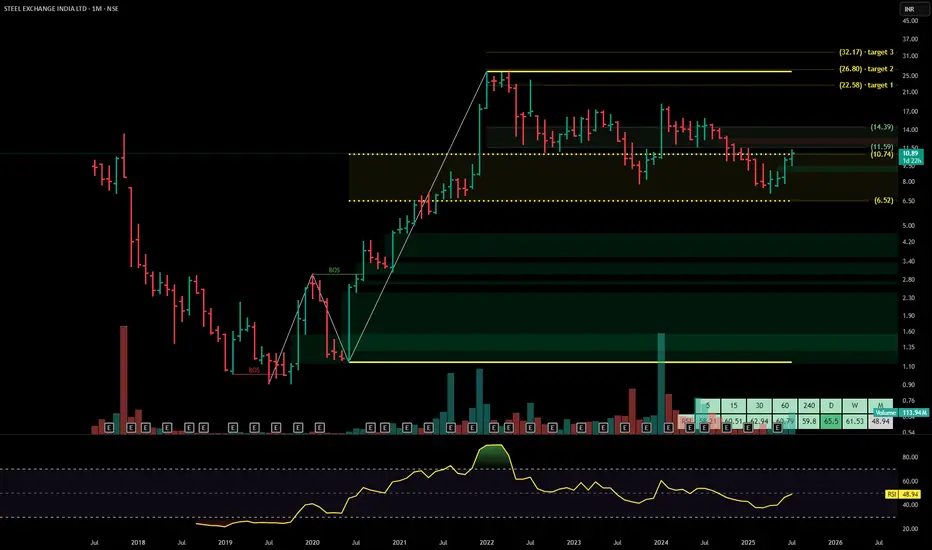
SSTEEL EXCHANGE INDIA Steel Exchange India Ltd. is a mid-sized integrated steel manufacturer, producing billets, TMT bars, and structural steel. The company operates across Andhra Pradesh with backward integration through captive power and sponge iron capacity. It serves construction, infrastructure, and industrial clients through its Vizag Steel vertical. The stock is currently trading at ₹10.89.
Steel Exchange India Ltd. – FY22–FY25 Snapshot
Sales – ₹814 Cr → ₹860 Cr → ₹918 Cr → ₹982 Cr – Gradual expansion driven by volume growth and demand
Net Profit – ₹39.6 Cr → ₹45.3 Cr → ₹50.6 Cr → ₹56.4 Cr – Steady earnings growth through efficiency and pricing Company Order Book – Moderate → Strong → Strong → Strong – Consistent inflow from infra-linked segments Dividend Yield (%) – 0.00% → 0.00% → 0.00% → 0.00% – No payouts, reinvestment-focused strategy
Operating Performance – Moderate → Strong → Strong → Strong – Margin stability supported by captive power Equity Capital – ₹53.68 Cr (constant) – No dilution, lean capital base
Total Debt – ₹190 Cr → ₹180 Cr → ₹168 Cr → ₹155 Cr – Controlled deleveraging from operational cash flows
Total Liabilities – ₹310 Cr → ₹325 Cr → ₹340 Cr → ₹356 Cr – Scaling modestly with demand
Fixed Assets – ₹145 Cr → ₹153 Cr → ₹160 Cr → ₹168 Cr – Capex directed toward plant modernization and efficiency upgrades
Latest Highlights FY25 net profit rose 11.5% YoY to ₹56.4 Cr; revenue increased 7.0% to ₹982 Cr EPS: ₹1.05 | EBITDA Margin: 14.9% | Net Margin: 5.74% Return on Equity: 12.34% | Return on Assets: 9.81% Promoter holding: 59.44% | Dividend Yield: 0.00% Operational efficiency gains from captive power and logistics optimization Rural infra and housing demand driving uptick in TMT segment volumes
Institutional Interest & Ownership Trends Promoter holding remains stable at 59.44% with no pledging or dilution. FII interest is minimal given the mid-cap profile, while HNI accumulation is visible across recent delivery spikes. Institutional exposure remains niche, centered around infra-allocation and value opportunities in commodity-linked verticals.
Business Growth Verdict Yes, Steel Exchange India is growing steadily across core product lines Margins supported by integration and volume expansion Debt is declining steadily with earnings momentum Capex remains efficient and supports operational improvement
Company Guidance Management projects single-digit revenue growth in FY26 driven by product mix enhancement and improved capacity utilization. Margin profile expected to remain consistent due to backward integration and demand visibility from infrastructure.
Final Investment Verdict Steel Exchange India Ltd. presents a modest yet efficient growth story in India’s steel sector. Its improving margin profile, steady earnings, and conservative capital structure make it suitable for gradual accumulation. The company’s core focus on integrated operations and infra-led volumes provides a base for value creation, appealing to investors seeking mid-cap manufacturing exposure in commodity-driven sectors.
ETH Bearish DivergenceBINANCE:ETHUSDT
Rezistance Levels: 3,943.44.
Support: 2,111.83
Trade Setup:
Target 1: 3,027.64 (0.50 Fibonnaci Golden Zone).
Target 2: 2,811.51 (0.618 Fibonnaci Golden Zone).
Target 3: 2,503.80 (0.786 Fibonnaci Golden Zone).
Target 4: 2,111.83 (1 Fibonnaci).
Stop Loss: 3,943.44 (above recent high, ~25% above current price).
RSI Analysis: The RSI shows a bullish divergence (price making lower lows while RSI makes higher lows), suggesting potential upward momentum. Current RSI is around 80.39, nearing overbought territory (>70), so caution is advised.

EURUSD: Bullish Continuation is Expected! Here is Why:
Remember that we can not, and should not impose our will on the market but rather listen to its whims and make profit by following it. And thus shall be done today on the EURUSD pair which is likely to be pushed up by the bulls so we will buy!
Disclosure: I am part of Trade Nation's Influencer program and receive a monthly fee for using their TradingView charts in my analysis.
❤️ Please, support our work with like & comment! ❤️

XAUAUSD ideaWe are waiting for our asset to reach our action zone, and based on the reaction, we’ll decide on our next moves.ALWAYS WAIT FOR A CONFIRMATION TO SEE IF THE PRICE VALIDATES THE ZONE.and you what is your vision of the EURUSD its interests me! i wait you in the commentary
AUDNZD: Short Signal Explained
AUDNZD
- Classic bearish formation
- Our team expects fall
SUGGESTED TRADE:
Swing Trade
Sell AUDNZD
Entry Level - 1.0926
Sl - 1.0929
Tp - 1.0920
Our Risk - 1%
Start protection of your profits from lower levels
Disclosure: I am part of Trade Nation's Influencer program and receive a monthly fee for using their TradingView charts in my analysis.
❤️ Please, support our work with like & comment! ❤️

BTCUSD IdeaWe are waiting for our asset to reach our action zone, and based on the reaction, we’ll decide on our next moves.ALWAYS WAIT FOR A CONFIRMATION TO SEE IF THE PRICE VALIDATES THE ZONE.and you what is your vision of the EURUSD its interests me! i wait you in the commentary

Final Drop?This looks like the final puke of wave 5. It could end up anywhere between $40-50. I have taken a position at $50 and I intend to load up more if we retest the historical support trendline.
Not financial advice, do what's best for you
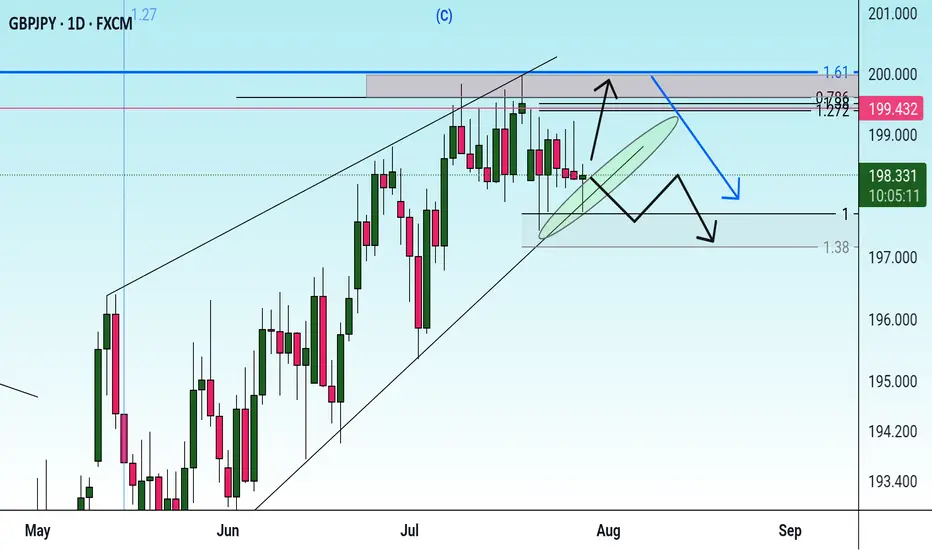
GBPJPY SellLIT cycle combined with Daily cycle. Price is overall bearish as it took liquidity on higher time-frames and we should be trading away from the inducement.

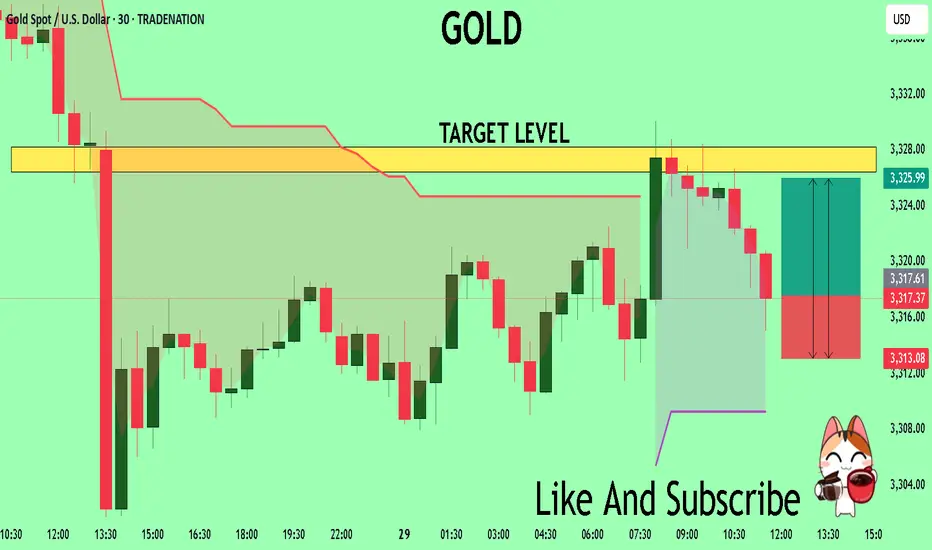
GOLD The Target Is UP! BUY!
My dear subscribers,
This is my opinion on the GOLD next move:
The instrument tests an important psychological level 3317.7
Bias - Bullish
Technical Indicators: Supper Trend gives a precise Bullish signal, while Pivot Point HL predicts price changes and potential reversals in the market.
Target - 3326.4
My Stop Loss - 3313.0
About Used Indicators:
On the subsequent day, trading above the pivot point is thought to indicate ongoing bullish sentiment, while trading below the pivot point indicates bearish sentiment.
Disclosure: I am part of Trade Nation's Influencer program and receive a monthly fee for using their TradingView charts in my analysis.
———————————
WISH YOU ALL LUCK
BITCOIN PREDICTION - MASSIVE CANDLE INCOMING!!! (WARNING) Watch this Bitcoin Prediction video now, you will love it!
Yello, Paradisers! Big warning sign: #Bitcoin is about to liquidate more traders soon if we get these confirmations that I'm sharing with you in this video. Loads of people will get wrecked again. Be careful not to get trapped into fakeouts.
In this video, I'm describing exactly what I'm seeing on Bitcoin, what patterns I'm waiting to form, and what confirmations I want to see before being able to say with 100% accuracy guaranteed that MARKETSCOM:BITCOIN is moving in that direction.
I'm sharing with you all the important targets and also how professional trading works: how risk-reward proper ratio trading works, and how high-probability trading depends a lot on how you choose to create your trades.
Watch this Bitcoin prediction to understand what I'm seeing right now on the chart and how I'm acting and making my decisions.


VINEUSDT – Possible "Double Bottom" in PlayPerhaps the OKX:VINEUSDT chart is continuing to working out the “double bottom” pattern.
🎯 The maximum target for this pattern is $0.35, but so far the price is half that.
💥 Trading #VINE is a complete gamble, as it is a meme coin from the PumpFun platform mentioned by Musk, a manipulative combo with no fundamentals.
🎲 But if the price of #Vine stays above $0.073-0.087, and you like gambling, then maybe this trade, with a potential +350%, is just for you)
________________
📚 Follow us ❤️ for daily crypto insights & updates!
🚀 Don’t miss out on important market moves!

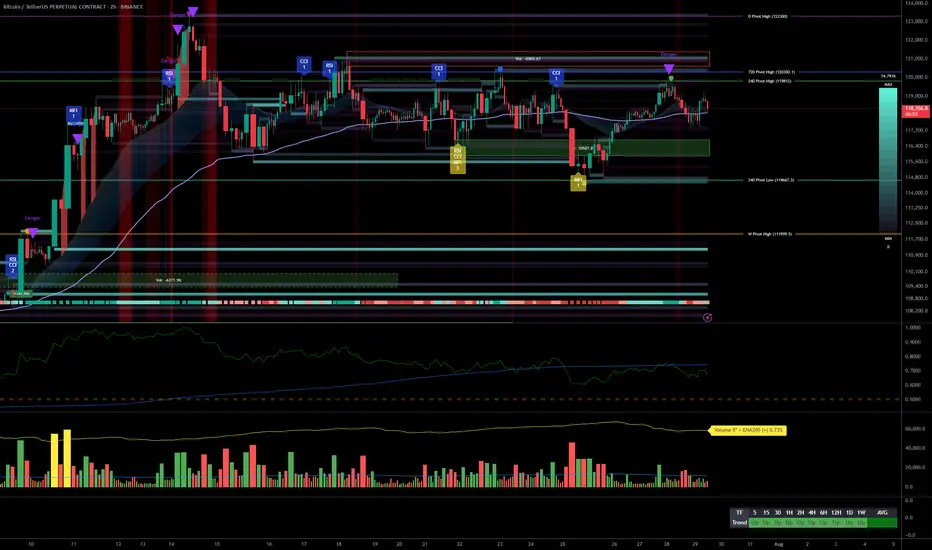
Multi-timeframe analysis, strong momentum, FOMC risk/reward plan__________________________________________________________________________________
Technical Overview – Summary Points
__________________________________________________________________________________
Strong momentum and bullish consensus confirmed across all timeframes.
Key support/resistance : 114k–116k (critical support), 123k (major pivot).
Healthy organic volume , no extreme peaks except isolated moments (30min/15min).
Risk On / Risk Off Indicator : Dominant bullish signal, neutral only on 15min.
Multi-timeframe structure : Perfect alignment daily/4H/2H/1H, caution on 15/30min (slight inflection but no abnormal divergence).
__________________________________________________________________________________
Strategic Summary
__________________________________________________________________________________
Global bias : Structural bull market, intact dynamic.
Opportunities : Tactical buys on pullbacks (114–116k), swing on breakout 123k.
Risk areas : Below 114k = risk of invalidation, targets 111k–105k.
Macro catalysts : FOMC imminent (high volatility expected), watch geopolitical tensions.
Action plan : Favor swing/cautious trading ahead of FOMC, dynamic stops, act on first post-Powell trigger.
__________________________________________________________________________________
Multi-Timeframe Analysis
__________________________________________________________________________________
1D : Active range 114k–123k; strong supports, momentum maintained; Risk On / Risk Off Indicator strongly bullish.
12H/6H/4H : Clean bullish structure, no excesses or divergence; price sits within major horizontal clusters.
2H/1H : Healthy impulse/correction phases; key intermediate supports 114.6k, 117.5k to watch.
30min/15min : Slightly weaker momentum but constructive microstructure, no immediate sell threat; localized volume spikes on support reactions.
ISPD DIV : No behavioral stress observed throughout.
Cross-timeframe summary : Bullish confluence dominant; caution on short-term reversals tied to FOMC and on-chain volatility spikes.
__________________________________________________________________________________
Multi-timeframe Cross Analysis & Decisional Rationale
__________________________________________________________________________________
As long as BTC > 114k = bullish bias, buying pullbacks, swing target 123k.
Active management post-FOMC strongly advised (enter/reduce after first H4 close).
Increased volatility risk in case of Fed/geopolitical shock; mandatory stops.
Sector momentum (Risk On / Risk Off Indicator) and volume underpin the bullish case unless exogenous alert.
Invalidation below 114k = prudent, neutral, or tactical shorts towards 111k–105k.
__________________________________________________________________________________
Macro, On-chain & Economic Calendar
__________________________________________________________________________________
FOMC July 29th : pivotal event, any surprise = strong intraday move (BTC sensitive to Powell speech).
US Macro: strong fundamentals but caution on trade war, inflation "contained."
On-chain : realized cap BTC >$1T, high open interest in derivatives = leveraged risk, beware speculative altcoin excess.
Global risk : market remains buyer until bearish Fed/geopolitical shock; swing trading favored, tight stops recommended.
__________________________________________________________________________________
Action plan
__________________________________________________________________________________
Favor buying/reloading on pullbacks to 114.6k–116k (stop <114k).
Break above 123k = bull confirmation, further extension likely to 126–128k depending on FOMC outcome.
Prioritize strict risk management; monitor liquidity/supports on macro/on-chain volatility peaks.
__________________________________________________________________________________
EURUSD NEW IDEASee the chart above, were on decling its momentum, I believe more trap longs this move.
SEE it in 2 days how things works. targets see charts.
I don't really explain to gain more tractions on how trading works.
I am here to understand the movement. Don't complicate too much, If you're a swing trader, take it a leap and have patience. stick to your own proper stoploss.
Trade it or leave it.
Goodluck folks.


Possibility of uptrend As long as the indicator is above the green resistance zone and the resistance trend line is not consolidated, the continuation of the downtrend is likely. If the strong indicator breaks through the mentioned resistance zone, a long-term uptrend will be formed.
Correction It is expected that the price will consolidate below the trend line and continue the downtrend to the specified support levels. In this case, a three-wave pattern will form.
Check the trend Given that there is a possibility of a triangle pattern forming, it is expected that the price will change direction at the current resistance level and a downtrend will begin. If the price consolidates above the green resistance level, the uptrend will likely continue.

Correction It is expected that the downtrend will continue to form until the specified support levels. Then there is a possibility of a trend change and the start of an uptrend. If the price breaks through the support area, the downtrend will continue to the next support area.

Possibility of correction As long as the price fluctuates above the support trend line, the continuation of the uptrend is likely. If the price crosses the support trend line, it will be a confirmation of the downtrend and the start of a downtrend or correction is likely.
Downtrend If the price can break through the support trend line, a continuation of the downtrend to the support levels is likely. Otherwise, an uptrend is possible with consolidation above the support level.

Check the trend Given the price behavior within the current resistance range, possible scenarios have been identified. It is expected that after some volatility and correction, we will see a continuation of the upward trend.
