NVIDIA Has more room to raise furtherIs it V-Shape pattern ? If Yes, it's definitely ready to go up and possible to hit 199-200
Wave Analysis

SILVER Will Go Up! Buy!
Take a look at our analysis for SILVER.
Time Frame: 9h
Current Trend: Bullish
Sentiment: Oversold (based on 7-period RSI)
Forecast: Bullish
The market is on a crucial zone of demand 3,655.5.
The oversold market condition in a combination with key structure gives us a relatively strong bullish signal with goal 3,780.6 level.
P.S
We determine oversold/overbought condition with RSI indicator.
When it drops below 30 - the market is considered to be oversold.
When it bounces above 70 - the market is considered to be overbought.
Disclosure: I am part of Trade Nation's Influencer program and receive a monthly fee for using their TradingView charts in my analysis.
Like and subscribe and comment my ideas if you enjoy them!

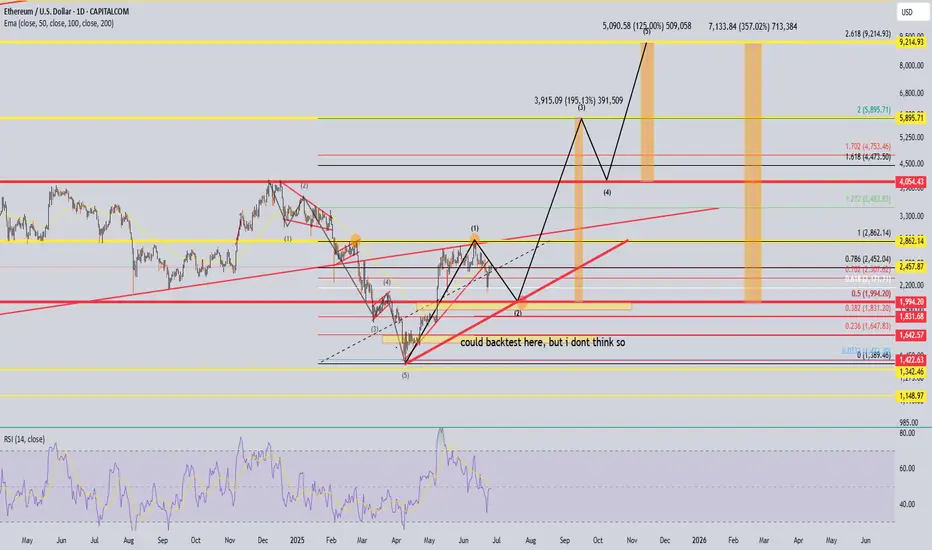
Eth 357% tradeI see a cup and handle forming. Hopefully we get some triangle and it breaks out. I put my bets at the 0.5 fib (level 1994.20) Nice 357% mamacitas!!
EURUSD Will Move Lower! Short!
Please, check our technical outlook for EURUSD.
Time Frame: 15h
Current Trend: Bearish
Sentiment: Overbought (based on 7-period RSI)
Forecast: Bearish
The price is testing a key resistance 1.173.
Taking into consideration the current market trend & overbought RSI, chances will be high to see a bearish movement to the downside at least to 1.144 level.
P.S
Overbought describes a period of time where there has been a significant and consistent upward move in price over a period of time without much pullback.
Disclosure: I am part of Trade Nation's Influencer program and receive a monthly fee for using their TradingView charts in my analysis.
Like and subscribe and comment my ideas if you enjoy them!

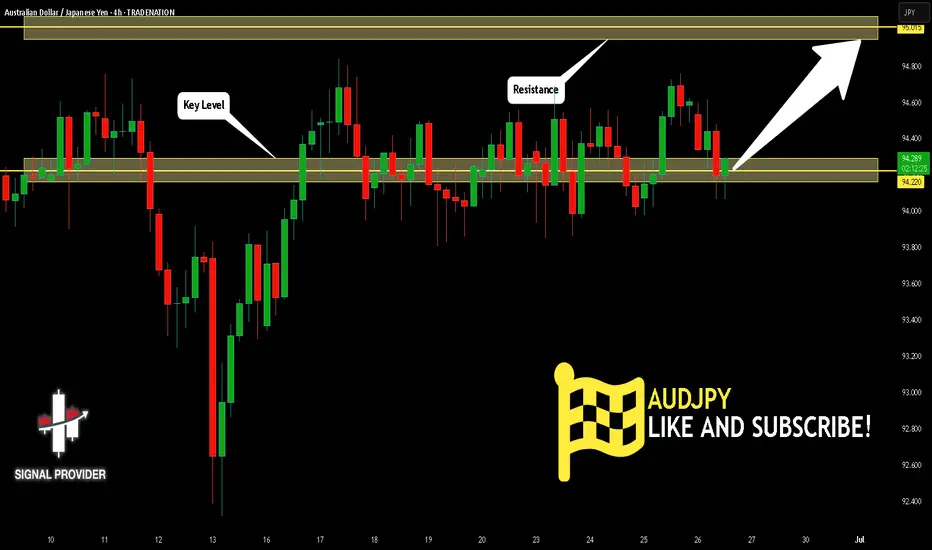
AUDJPY Is Bullish! Long!
Here is our detailed technical review for AUDJPY.
Time Frame: 4h
Current Trend: Bullish
Sentiment: Oversold (based on 7-period RSI)
Forecast: Bullish
The market is trading around a solid horizontal structure 94.220.
The above observations make me that the market will inevitably achieve 95.015 level.
P.S
Please, note that an oversold/overbought condition can last for a long time, and therefore being oversold/overbought doesn't mean a price rally will come soon, or at all.
Disclosure: I am part of Trade Nation's Influencer program and receive a monthly fee for using their TradingView charts in my analysis.
Like and subscribe and comment my ideas if you enjoy them!
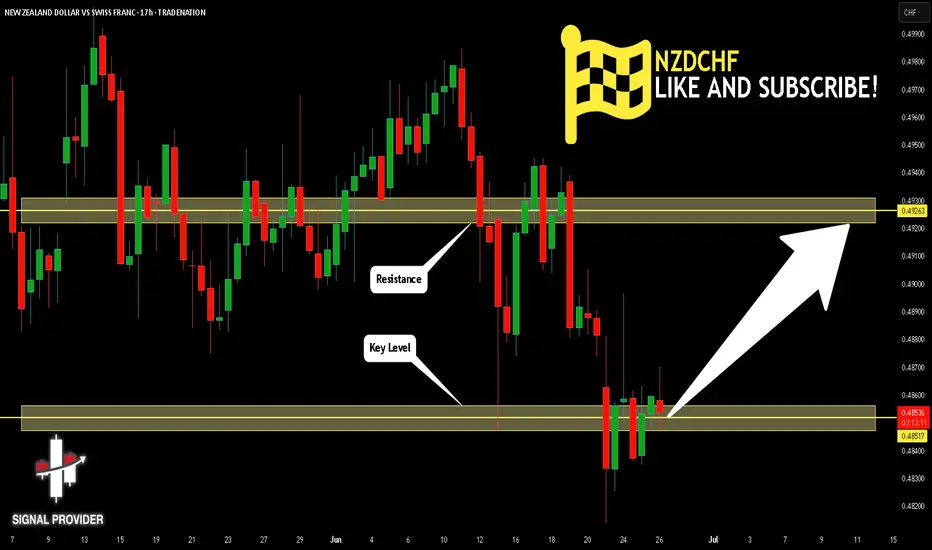
NZDCHF Is Very Bullish! Buy!
Take a look at our analysis for NZDCF
Time Frame: 17h
Current Trend: Bullish
Sentiment: Oversold (based on 7-period RSI)
Forecast: Bullish
The market is testing a major horizontal structure 0.485.
Taking into consideration the structure & trend analysis, I believe that the market will reach 0.492 level soon.
P.S
The term oversold refers to a condition where an asset has traded lower in price and has the potential for a price bounce.
Overbought refers to market scenarios where the instrument is traded considerably higher than its fair value. Overvaluation is caused by market sentiments when there is positive news.
Disclosure: I am part of Trade Nation's Influencer program and receive a monthly fee for using their TradingView charts in my analysis.
Like and subscribe and comment my ideas if you enjoy them!
A Week Ahead: 23.06.2025 – 29.06.2025 | Key Events to WatchMonday, June 23
EU PMI Index – key for EUR
US PMI Index – key for USD
Tuesday, June 24
Canada CPI – important for CAD
Fed Chair Powell Testimony – high-impact event for USD and US stock markets
Wednesday, June 25
Fed Chair Powell Testimony continues – markets will look for monetary policy clues
Thursday, June 26
US GDP Q1 – key for USD
Friday, June 27
UK GDP Q1 – important for GBP
Japan Retail Sales, Unemployment, CPI – important for JPY
Canada GDP – important for CAD
US Personal Income and Spending – key for USD and US stock market
Summary: This week is packed with macroeconomic data and Powell’s testimony, which could shake the USD, CAD, JPY, GBP, and US stocks.

GBPJPY Keeps Recovering, But It’s Approaching ResistanceGBP/JPY is on the rise but is approaching the upper boundary of the 2024–2025 range, which could present strong resistance around the 200 level. Keep in mind that the decline from the 2024 highs to the July lows near 180 was impulsive, while the current rebound appears slow and corrective—possibly a wave B within a flat correction or even part of a triangle formation. In either case, we believe some further sideways price action is likely, followed by a potential downward turn from this prior subwave A resistance zone.


AUD/USD BEARISH BIAS RIGHT NOW| SHORT
AUD/USD SIGNAL
Trade Direction: short
Entry Level: 0.653
Target Level: 0.647
Stop Loss: 0.657
RISK PROFILE
Risk level: medium
Suggested risk: 1%
Timeframe: 9h
Disclosure: I am part of Trade Nation's Influencer program and receive a monthly fee for using their TradingView charts in my analysis.
✅LIKE AND COMMENT MY IDEAS✅

NZD/USD BEST PLACE TO SELL FROM|SHORT
Hello, Friends!
NZD/USD is trending down which is evident from the red colour of the previous weekly candle. However, the price has locally surged into the overbought territory. Which can be told from its proximity to the BB upper band. Which presents a classical trend following opportunity for a short trade from the resistance line above towards the demand level of 0.983.
Disclosure: I am part of Trade Nation's Influencer program and receive a monthly fee for using their TradingView charts in my analysis.
✅LIKE AND COMMENT MY IDEAS✅

EURUSD Jun 26 The information and publications are not meant to be, and do not constitute, financial, investment, trading, or other types of advice or recommendations.
Have a nice day ahead.

GBP/USD BEARS ARE STRONG HERE|SHORT
Hello, Friends!
GBP/USD pair is in the uptrend because previous week’s candle is green, while the price is clearly rising on the 3H timeframe. And after the retest of the resistance line above I believe we will see a move down towards the target below at 1.358 because the pair overbought due to its proximity to the upper BB band and a bearish correction is likely.
Disclosure: I am part of Trade Nation's Influencer program and receive a monthly fee for using their TradingView charts in my analysis.
✅LIKE AND COMMENT MY IDEAS✅

EURCAD Analysis & The Blueprint for a Winning Trading Strategy📍 You’ve got to have a roadmap — a solid trading plan is absolutely essential 🧭.
In this video, I break down my personal trading plan and walk you through exactly how I approach the markets 🎯. I’m currently looking at EURCAD and there’s a lot happening on this chart 📉📊.
First things first: price action is clearly overextended 📈. The question is — do you really want to be buying at a premium? That’s where risk increases significantly ⚠️.
My approach is simple yet effective: I look for signs of reversal or a pullback into equilibrium 🌀 — then I wait for price to break structure before I act 📐.
Having a system in place that alerts you when key conditions are met is critical 🔔. That’s how you build consistency and gain a real edge in the market 🧠⚔️.
In this video, I’ll show you my strategy, how I plan a trade, what I’m looking for, and why patience is key 🧘♂️.
🛑 Don’t chase price. Let the setup come to you. Let the chart reveal its hand 🃏.
Not financial advice — always do your own research. 📚

#AVAX/USDT#AVAX
The price is moving within a descending channel on the 1-hour frame and is expected to break and continue upward.
We have a trend to stabilize above the 100 moving average once again.
We have a downtrend on the RSI indicator that supports the upward move with a breakout.
We have a support area at the lower limit of the channel at 17.22, acting as strong support from which the price can rebound.
Entry price: 17.54
First target: 17.92
Second target: 18.22
Third target: 18.62


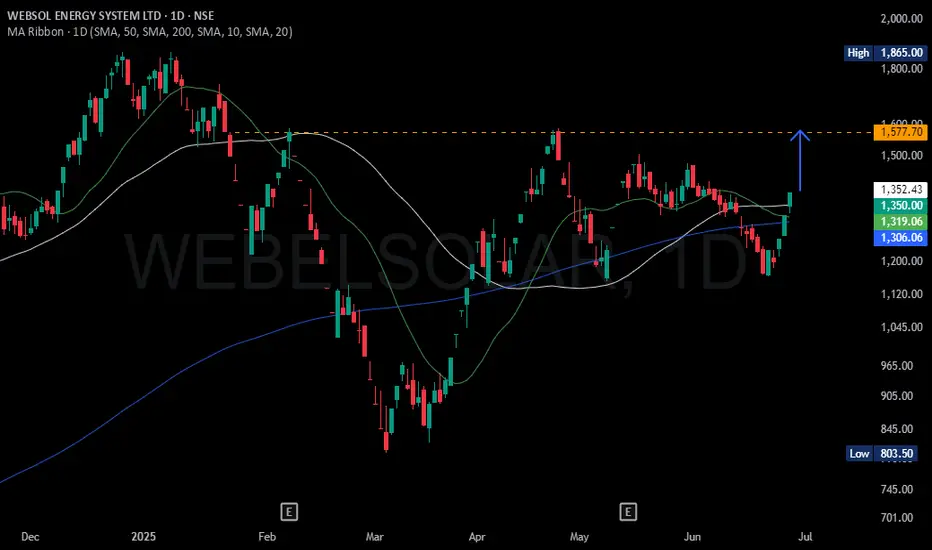
WEBELSOLAR : Heading towards BrakOutWebel Solar, nearing to previous high potential 13% up side from current level and there after break out
CADJPY Bearish Breakout!
HI,Traders !
#CADJPY made a bearish
Breakout of the rising support
Which is a resistance now and
The breakout is confirmed
So we are bearish biased
And we will be expecting
A further bearish move down !
Comment and subscribe to help us grow !

#DYM/USDT#DYM
The price is moving within a descending channel on the 1-hour frame and is expected to break and continue upward.
We have a trend to stabilize above the 100 moving average once again.
We have a downtrend on the RSI indicator, which supports the upward move by breaking it upward.
We have a support area at the lower limit of the channel at 0.2232, acting as strong support from which the price can rebound.
Entry price: 0.2316
First target: 0.2384
Second target: 0.2461
Third target: 0.2532

GOLD 4H Gold has compleated a bullish leading diagonal pattern and started the correction to the downside.
Wave A has formed, now wave B is forming before wave C begins.
A potential Head and Shoulders pattern is forming, which would align with the formation of wave C.
I anticpate a correction down to the 61.8 Fib.

#DOGS/USDT#DOGS
The price is moving within a descending channel on the 1-hour frame and is expected to break and continue upward.
We have a trend to stabilize above the 100 moving average once again.
We have a downtrend on the RSI indicator that supports the upward move with a breakout.
We have a support area at the lower limit of the channel at 0.0001230, acting as strong support from which the price can rebound.
Entry price: 0.0001261
First target: 0.0001286
Second target: 0.0001314
Third target: 0.0001352

EURUSD Will Keep Growing!
HI,Traders !
#EURUSD is trading in an
Uptrend along the rising
Support and the pair will
Soon retest the support
From where we will be
Expecting a bullish rebound
And a bullish continuation !
Comment and subscribe to help us grow !

XAUUSD Possible Move 26.05.2025Gold is currently respecting an ascending channel, showing consistent higher highs and higher lows. Price is now testing the upper boundary of this channel and approaching a key supply zone (3353–3357), which previously triggered a strong sell-off.
Key Zones:
🔼 Sell Zone: 3353–3357 (confluence of supply + channel resistance)
🔽 Buy Zone: 3325–3329 (demand zone + channel support)
✅ Trade Ideas:
📍Buy Setup
Entry: 3325–3329
SL: Below 3310
TP: 3350–3355
📍Sell Setup
Entry: 3353–3357
SL: Above 3367
TP: 3330–3325
🔔 Important Note:
⚠️ Today's U.S. Jobless Claims data is critical. Expect volatility and possible breakout/fakeout scenarios around the time of release. Trade only on confirmation.
