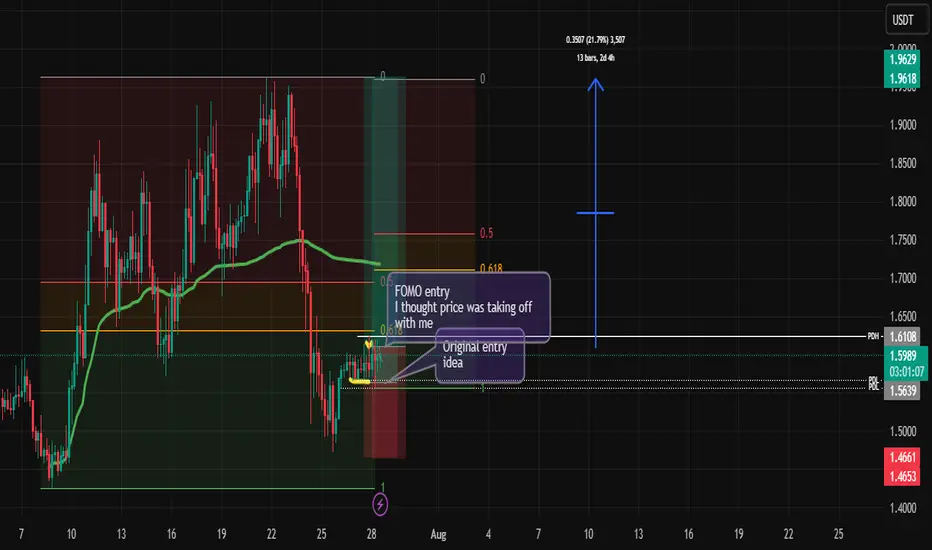
Virtual FOMO and a 20%%????
Like all the others, I am looking for a pump on virtual to grow that spot.
If look closely, I fomo in.
Let's see what happens in by the end of the week.
Wave Analysis
Solana (SOL) Revs Up Again — Fresh Breakout Above $200 in Sight?After months of consolidation, Solana (SOL) is once again showing signs of bullish momentum, trading near $176 and rapidly approaching a potential breakout level of $200. Investors and analysts alike are paying close attention, as on-chain activity and ecosystem development provide a compelling case for a renewed upward trajectory.
With growing demand for high-throughput blockchain infrastructure and new institutional integrations, Solana is positioning itself as more than just an Ethereum alternative—it’s emerging as a core infrastructure layer for high-performance Web3 applications.
Institutional Momentum Gathers Pace
In the last three weeks, several high-profile announcements have bolstered confidence in the Solana ecosystem. Fidelity Digital Assets revealed it is piloting tokenized bond products on Solana’s network, citing its fast settlement time and composability.
Meanwhile, Visa expanded its USDC settlement pilot on Solana across five countries, reinforcing the blockchain’s real-world financial use cases.
“Solana is no longer just retail-driven,” said Karla Nunez, digital asset strategist at ApexBridge. “Institutions are beginning to build directly on it—and that changes the dynamic.”
Ecosystem Growth and Developer Activity
The number of active developers on Solana has surged 38% quarter-over-quarter, according to Electric Capital’s Developer Report. Projects in DeFi, gaming, and NFTs continue to attract users, helped by extremely low transaction costs and sub-second finality.
Notably, the Solana Foundation recently launched a $100 million grant fund for AI-integrated crypto applications, which could catalyze the next wave of user adoption.
Technical Indicators Support Breakout Narrative
SOL has outperformed major altcoins this month, rising 21% in July. The token is now trading above its 50-day and 100-day moving averages, and momentum indicators suggest a potential breakout above the key psychological barrier at $200.
A confirmed break would likely open the door to $240–$260, with minimal historical resistance in that zone.
Macro Factors Provide Tailwind
The broader crypto market is recovering as inflation metrics cool and expectations for central bank easing rise. Solana, with its high beta to market movements, often leads altcoin rallies during bullish pivots.
Furthermore, the recent dip in Ethereum gas prices has had limited impact on Solana’s user base, suggesting its appeal is increasingly based on performance, not cost arbitrage.
Conclusion
While risks remain—from network outages to broader market volatility—Solana’s resurgence appears fundamentally supported. With institutional interest rising, technical signals aligning, and ecosystem momentum building, a clean break above $200 could mark the beginning of a new cycle for SOL.
For investors seeking exposure to high-speed smart contract platforms with real-world traction, Solana may be nearing another defining moment.

BTCUSDT Range-Bound Market: Short-Term Bearish MoveBTCUSDT
has failed to break through the descending resistance near 120,000 and is now forming a lower high within the broader resistance zone. The price action follows an impulsive leg up and is currently tracing a potential reversal pattern under key structural resistance. As long as the market remains capped below 120,000, continuation toward 117,500 is likely. The downward bias is supported by weakening momentum after the bull trap and resistance rejection.
📉 Key Levels
Sell trigger: Breakdown below 119,000
Sell zone: 119,400 – 120,000
Target: 117,500
Invalidation: Break and close above 120,500

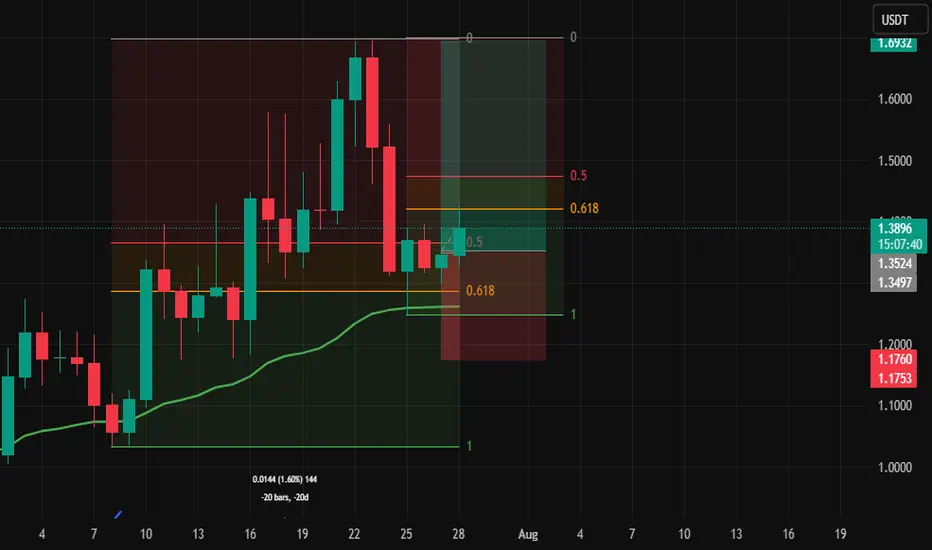
FaRTCOIN 20%+ ??I got an entry on Fart. It traded below the last 20day DR and it could trade through external liquidity.
I wanna use this opportunity to grow a 1/4 of my spot with this week's price action.
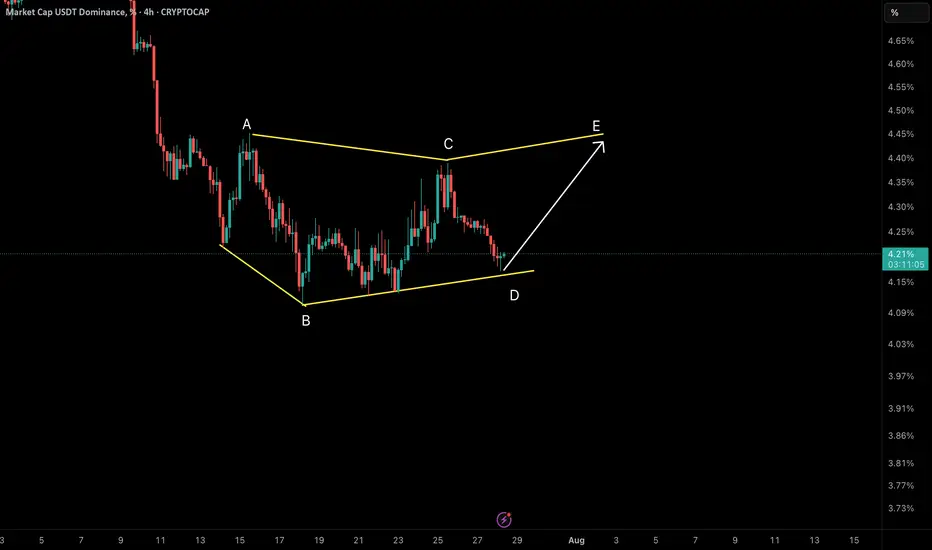
NeoWave Analysis – USDT Dominance (4H Timeframe)We are currently observing a Symmetrical Diametric correction pattern unfolding in the USDT Dominance chart. The wave structure labeled A–B–C–D–E shows clear evidence of this complex formation.
✅ Reasons for Diametric Labeling:
• Wave A and B initiated the pattern with a sharp drop (A), followed by wave B extending lower than A’s starting point – an early sign of a non-classical corrective structure.
• Waves C and D developed with alternating strength and duration, reflecting the expanding and contracting rhythm typical of diametric formations.
• Time and Price Alternation between segments is clearly visible, especially the extended duration between waves B and D compared to the earlier legs.
• The current price action is sitting right at the D wave bottom, which acts as a key structural support zone.
🔄 What’s Next?
• From this support, we expect wave E to initiate. In symmetrical diametrics, wave E typically reaches or slightly exceeds the top of wave C.
• A break below the D wave low doesn’t immediately invalidate the diametric scenario but may call for a re-evaluation toward an Expanded or Terminal Diametric.
• Confirmation of wave E may come with a bullish BOS (Break of Structure) on lower timeframes.
📌 Conclusion: We are likely at the early stage of wave E. If this interpretation holds, a bullish move should develop soon.
📡 Analysis by CryptoPilot – navigating the market with precision.
#CryptoPilot #USDT.D #Elliot #NeoWave #MarketStructure #TrendChannel #BOS #Altcoins #CryptoTrading
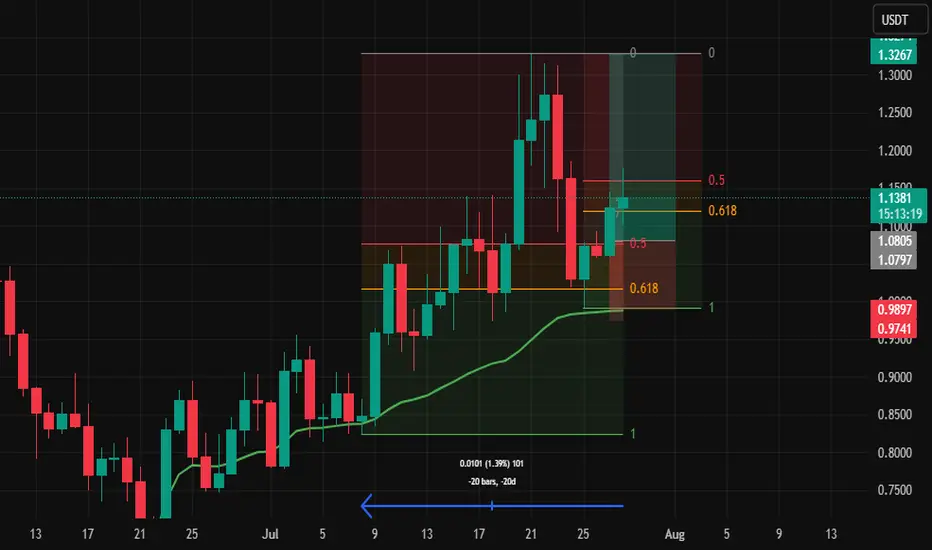
Wif 10-20% up this week?I am looking to grow my spot with a 10-20% move on wif this week if it takes the external liquidity.
I took a position on yesterday when it traded at the equilibrium of the 2 day range
Elliott waveAccording to the bearish structure, the ABC wave is completed, there are 5 more bearish waves.
Sell 3334, stoplos 3344, tp 3310

EURUSD - Break of support?In this moment we have a potential distribution of volume with a potential break of dinamic support we can have a deep rebound until area 1.14

15-minute timeframe for XAU/USDKey Elements and Observations:
Price Action:
The price initially shows a downtrend, breaking below a previous low, indicated by "BMS" (likely "Break in Market Structure" or "Break of Market Structure").
Following the break, the price consolidates and then shows a strong upward movement, breaking above a resistance level, again marked by "BMS." This suggests a potential shift in momentum from bearish to bullish.
Order Blocks (OB):
5 Min OB (Blue Box, Top Left): There's a "5 Min OB" marked at a higher price level earlier in the chart. This represents a bearish order block, where significant selling pressure was previously observed.
15 Min OB (Teal Box, Bottom Right): A "15 Min OB" is identified at a lower price level (around 3326.00 - 3330.00). This is likely a bullish order block, indicating an area where institutions or large players placed buy orders, leading to a bounce in price.
Break in Market Structure (BMS):
Two "BMS" labels are visible:
The first BMS (red dashed line below 3330.00) indicates a break of a support level during the downtrend.
The second BMS (red dashed line above 3330.00) indicates a break of a resistance level during the subsequent uptrend, confirming a potential shift in market bias to bullish.
Entry, Stop Loss, and Take Profit (Trade Setup):
Entry (Green Line): The suggested entry point for a long (buy) position is at approximately 3339.50. This entry aligns with a retest of a previous resistance level that has now turned into support, or potentially the lower boundary of a small bullish order block or fair value gap.
Stop Loss (Red Line/Red Box): The stop loss is set at 3335.50. This is placed below a recent low or significant support level, specifically within a red-shaded area that likely represents a "Supply/Demand" zone or an area where the trade would be invalidated.
Take Profit (Green Line/Green Box): The take profit target is 3354.00, resulting in a "Profit" of 3354.00. This target is placed at a significant resistance level or an area where price might reverse. The white shaded box above the entry, extending to the take profit, highlights the potential profit zone.
Risk-Reward Ratio: While not explicitly calculated, the visual representation suggests a favorable risk-reward, with the potential profit (green box) appearing larger than the potential loss (red box).
Pivot Point (P):
A "P (3345.227)" is marked on the chart, likely indicating a pivot point, which can act as a dynamic support or resistance level. The current price is trading above this pivot point, further supporting a bullish bias.
"BMS: 61.36%" (Bottom Right):
This percentage likely refers to a "Break in Market Structure" metric or a specific trading indicator that quantifies the strength or probability of the market structure shift. 61.36% suggests a reasonably strong confirmation.
Implied Trading Strategy:
The chart depicts a bullish reversal strategy, likely based on "Smart Money Concepts" or "ICT" (Inner Circle Trader) principles. The strategy involves:
Identifying a shift in market structure: Price breaking highs after breaking lows, signaling a change from bearish to bullish.
Utilizing Order Blocks: Using the 15 Min OB as a foundational support level and potentially looking for entry confirmations around it.
Waiting for a Retest/Pullback: The entry around 3339.50 suggests waiting for a pullback after the initial bullish impulse. This could be a retest of a broken resistance level, a fair value gap (FVG), or a small bullish order block within the larger 15 Min OB.
Placing Stop Loss Strategically: Below a significant low or invalidation point.
Targeting Previous Highs/Resistance: Setting the take profit at a logical resistance level where previous selling pressure was observed.

EURJPY → Retest support before growthFX:EURJPY has been correcting since the opening of the European session. The movement was triggered by yesterday's news related to the trade deal between the US and Europe...
EURJPY is reacting to news related to the deal between the US and Europe. A correction is forming amid the fall of the euro, but against the backdrop of the dollar's growth, the currency pair has a chance to rise if the bulls keep the price in the buying zone relative to the support level of 173.08.
The dollar is rising, and against this backdrop, the Japanese yen is falling. Bulls have every chance of holding their ground above the previously broken resistance. If the market confirms support, we will have chances for growth.
Resistance levels: 173.87
Support levels: 173.082, 172.47
The currency pair may form a liquidity trap relative to the previously broken consolidation resistance. A false breakdown of support and price consolidation in the buying zone (above 173.1) could trigger further growth.
Best regards, R. Linda!

Gold (XAU/USD) Daily Trading Plan - 28th July 2025🔺 Technical Analysis
Gold opened the Asian session this week with a slight retracement, testing the 0.382 Fibonacci Retracement level before bouncing back strongly to last week's closing price around 3339. This move further solidifies the price action from a technical perspective.
Notably, gold has broken through a minor resistance on the M15 timeframe, invalidating the bearish structure and forming a full-bodied H1 candle. This sets the stage for a potential corrective uptrend to unfold.
On the Daily timeframe, the initial session's decline retested the bullish trendline and bounced back within the boundaries of the flag pattern. It's likely that this week, the price will continue towards the end of this pattern, providing a clearer confirmation of the medium-term trend.
🔺 Key Macroeconomic News
This week promises to be volatile with several crucial economic announcements, particularly as it marks both the end of the month and the start of a new one. Two key events that traders should pay close attention to are:
FOMC Interest Rate Decision: Always a focal point for the market, with significant impact on safe-haven assets like gold.
Non-Farm Payroll (NFP) Report: Vital US labour market data, capable of triggering substantial movements in both the USD and gold.
Therefore, be prepared for potential market shocks and exercise careful risk management.
📈 Trading Strategy & Considerations
Given the technical setup and upcoming macroeconomic events, consider the following:
Potential Corrective Uptrend: The invalidated bearish structure on M15 and the strong H1 candle suggest a short-term bullish bias for a corrective move.
Daily Flag Pattern: Monitor price action as it approaches the end of the flag pattern on the Daily timeframe for medium-term trend confirmation.
High Volatility Ahead: Exercise extreme caution around the FOMC and NFP announcements. These events can lead to significant and rapid price swings.
Risk Management: Prioritise strict risk management. Consider reducing position sizes or employing wider stop-losses during high-impact news events.
Disclaimer: This analysis is for informational purposes only and does not constitute financial advice. Trading involves significant risk, and you should only trade with capital you can afford to lose.

BTCUSD sell "I had posted it before as well, but it got hiddenAnalyzing market structure and liquidity using Price Action and Smart Money Concepts. Focused on key supply/demand zones and institutional order flow

Daily outlook 7-28-25Daily outlook 7-28-25 - in this outlook i will tel my friend what i am gonna trade for today.

USD PESO- Support, Fib and other reasons LONGHello fellow traders!
Good news! good NEWS GOOOOOOD News for USA! here is the idea- support holding hence going for the 19.10-19.11 level of resistance Aldo the drop of the price seen well on a weekly/monthly chart hit the 0.5 fibs normally being reaction level and with a new trades and America is great again - my position, but please don't copy only if you made your own mind- this is just an idea not a trading advise! And when trading- have a s/l that won't blow your account, good luck!

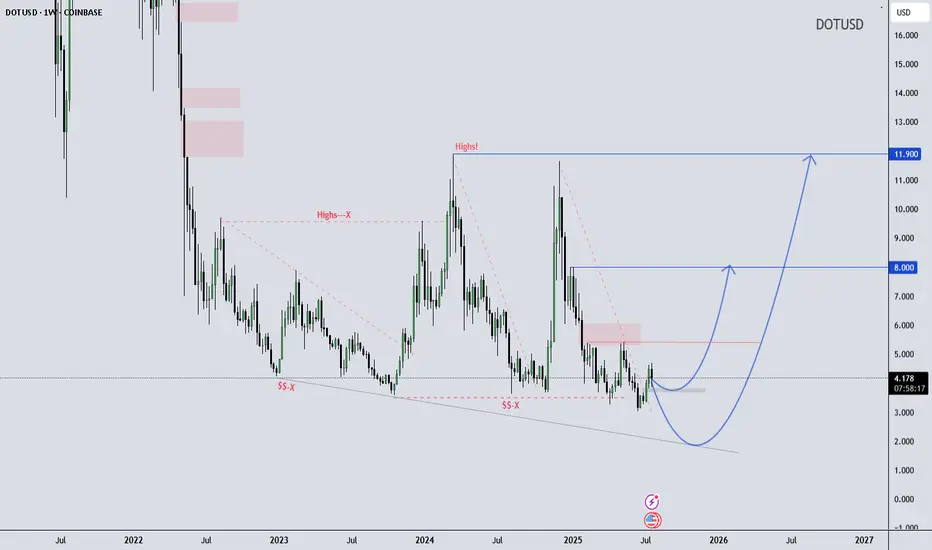
DOT/USD Weekly Structure - - Reversal Possibility Developing DOT/USD Weekly Outlook – Educational Perspective
Polkadot (DOT) is trading near the lower boundary of a long-term falling wedge structure, showing early signs of stabilization around the $4.20 support zone. Price has respected this level multiple times, potentially forming a rounded bottom, which often suggests shifting momentum.
If the structure holds, it may continue developing a macro reversal pattern. This kind of formation is typically monitored by swing traders looking for high risk-reward setups in longer timeframes.
Key Technical Levels to Watch:
$8.00 – Mid-range structural resistance
$11.90 – Historical supply / macro pivot zone
This chart is shared for educational purposes only to support market structure learning. Always follow your own analysis and risk management plan.
Wave Trader Pro
Learn & Earn
Bitcoin Cash cup and handle 2000% trade!!It could be bitcoin cash is making a cup and handle pattern. If it plays out it should stay above 0.5 fib and target the 2 fib. Crazy 2000%
