AUD-USD Local Short! Sell!
Hello,Traders!
AUD-JPY is making a bullish
Rebound and the pair is
Making a retest of the key
Horizontal resistance of 0.6497
From where we will be
Expecting a local bearish correction
Sell!
Comment and subscribe to help us grow!
Check out other forecasts below too!
Disclosure: I am part of Trade Nation's Influencer program and receive a monthly fee for using their TradingView charts in my analysis.
Wave Analysis

GOLD - Its Breakout? Short now??#GOLD.. perfect move as per our analysis, and now market just break hit current supporting area that was actually 3328
so keep close it and if market stay below that then we can expect a further drop towards our next supporting areas.
good luck
trade wisely
Cocoa Bull Run over?There’s something brewing in the charts here, and it’s not a hot cup of cocoa. We had a clear rejection at the 0.382 Fibonacci and potentially the start of a C leg in a corrective pattern.
This is lower high after the bull flag breakout pattern. If we lose support here we could break the neckline and confirm the head and shoulders pattern, which is very bearish.
There’s a lot of moving parts to consider here. If you follow my trades you will know I already anticipated this as I am long a stock that behaves in an inverse manner to cocoa.
Not financial advice, do what’s best for you

GBP/CAD Clarity in Motion! Levels Are Locked In Hey everyone 👋
📌 BUY LIMIT ORDER / GBP/CAD Key Levels
🟢 Entry: 1,83873
🎯 Target 1: 1,84104
🎯 Target 2: 1,84372
🎯 Target 3: 1,85040
🔴 Stop: 1,83316
📈 Risk/Reward Ratio: 2.18
I double-checked the levels and put together a clean, focused analysis just for you. Every single like seriously boosts my motivation to keep sharing 📈 Your support means the world to me!
Huge thanks to everyone who likes and backs this work 💙 Our goals are crystal clear, our strategy is solid. Let’s keep moving forward with confidence and smart execution!

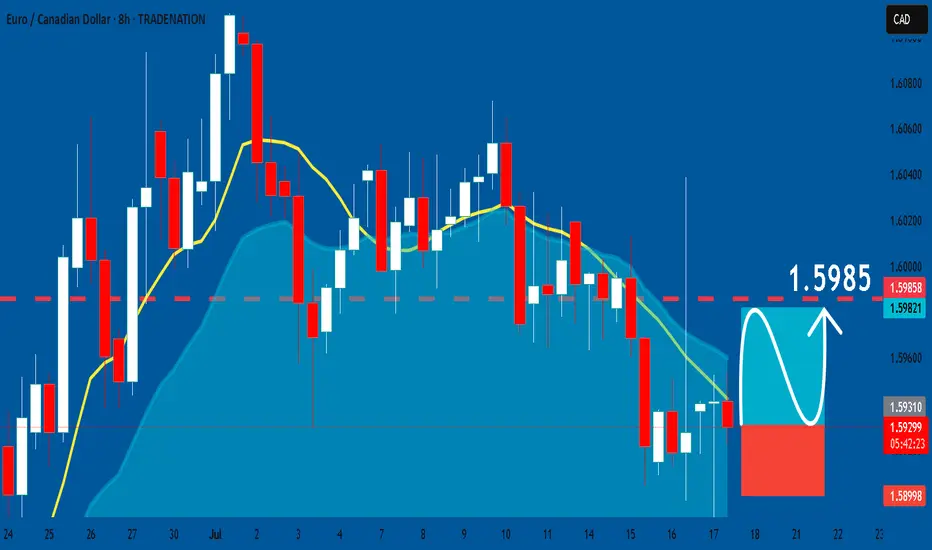
EURCAD: Long Signal with Entry/SL/TP
EURCAD
- Classic bullish pattern
- Our team expects retracement
SUGGESTED TRADE:
Swing Trade
Buy EURCAD
Entry - 1.5929
Stop - 1.5899
Take - 1.5985
Our Risk - 1%
Start protection of your profits from lower levels
Disclosure: I am part of Trade Nation's Influencer program and receive a monthly fee for using their TradingView charts in my analysis.
❤️ Please, support our work with like & comment! ❤️
#PEOPLE/USDT Breakout in Action ! #PEOPLE
The price is moving within a descending channel on the 1-hour frame, adhering well to it, and is on its way to breaking it strongly upwards and retesting it.
We have a bounce from the lower boundary of the descending channel. This support is at 0.01980.
We have a downtrend on the RSI indicator that is about to break and retest, supporting the upward move.
There is a key support area in green at 0.02000, which represents a strong basis for the upward move.
Don't forget one simple thing: ease and capital.
When you reach the first target, save some money and then change your stop-loss order to an entry order.
For inquiries, please leave a comment.
We have a trend of stability above the Moving Average 100.
Entry price: 0.02056
First target: 0.02111
Second target: 0.02190
Third target: 0.02265
Don't forget one simple thing: ease and capital.
When you reach the first target, save some money and then change your stop-loss order to an entry order.
For inquiries, please leave a comment.
Thank you.

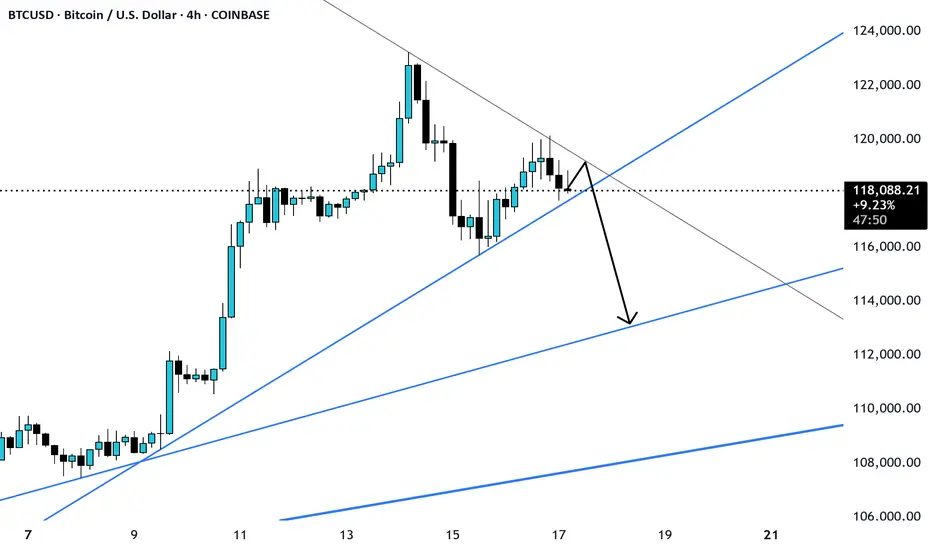
BTCUSD Time to Short BTC was rejected form the recent resistance area and is likely to go down to around 140000. Wait for breakdown of the support
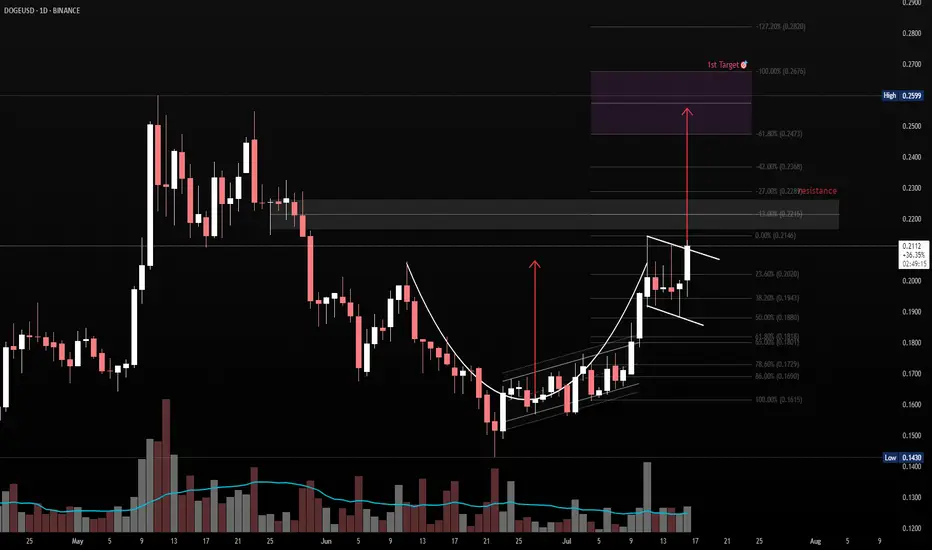
Cup & Handle Breakout Watch – DOGE/USDTPattern: Cup & Handle
Timeframe: 1D
Cup Range: $0.168 → $0.212
Handle: Forming as a descending bull flag
Breakout Level: ~$0.2125
Measured Target: ~$0.256
Confluence:
Clean rounded base (cup)
Tight flag pullback (handle)
Volume decrease during handle = healthy
Prior resistance aligns with projected target zone
Bias: Bullish (on breakout with volume confirmation)
📌 Watching for breakout above handle resistance with rising volume to confirm entry. Measured move aligns with historical supply zone.
After break out from 0.216~0.226
Target Zone: 0.24~0.26
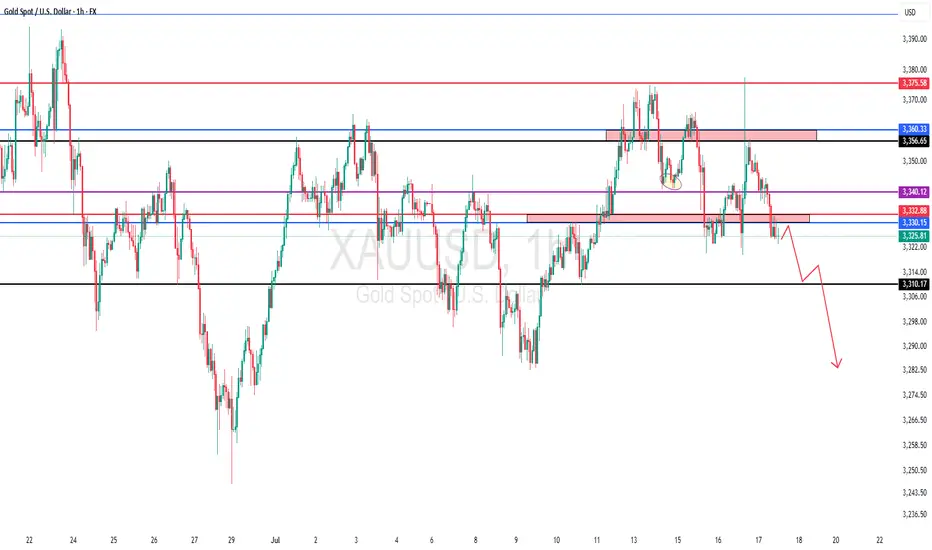
XAUUSD critical area, both sides are possiblecorrection waves are always complicated and messy often changes direction too often, goes up and down in a wide range either triangle, wedge or some sort of zigzag, internal waves usually goes as abc, wxy, wxyxz type of correction waves and it may seem like ended many times in the subwaves. so often confused with many other ideas. i believe correction continues yet criticals levles to watch 3307-3419 brake side will determen the future of gold.
my 3250 target already achieved but i expect another one, shor term targets 3250-3205 mid term targets 3119-3070-3050
daily candle body above 3420 invalidates short ideas.

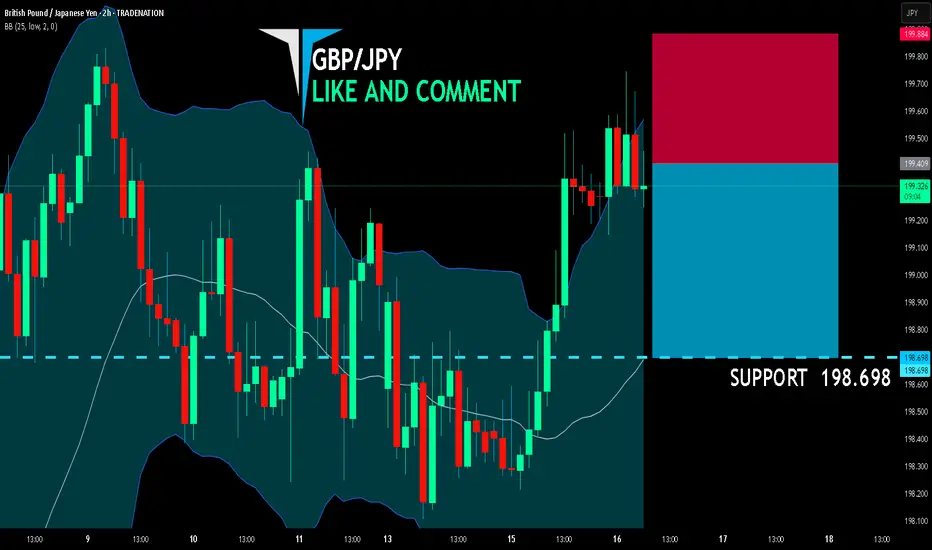
GBP/JPY BEARISH BIAS RIGHT NOW| SHORT
GBP/JPY SIGNAL
Trade Direction: short
Entry Level: 199.409
Target Level: 198.698
Stop Loss: 199.884
RISK PROFILE
Risk level: medium
Suggested risk: 1%
Timeframe: 2h
Disclosure: I am part of Trade Nation's Influencer program and receive a monthly fee for using their TradingView charts in my analysis.
✅LIKE AND COMMENT MY IDEAS✅
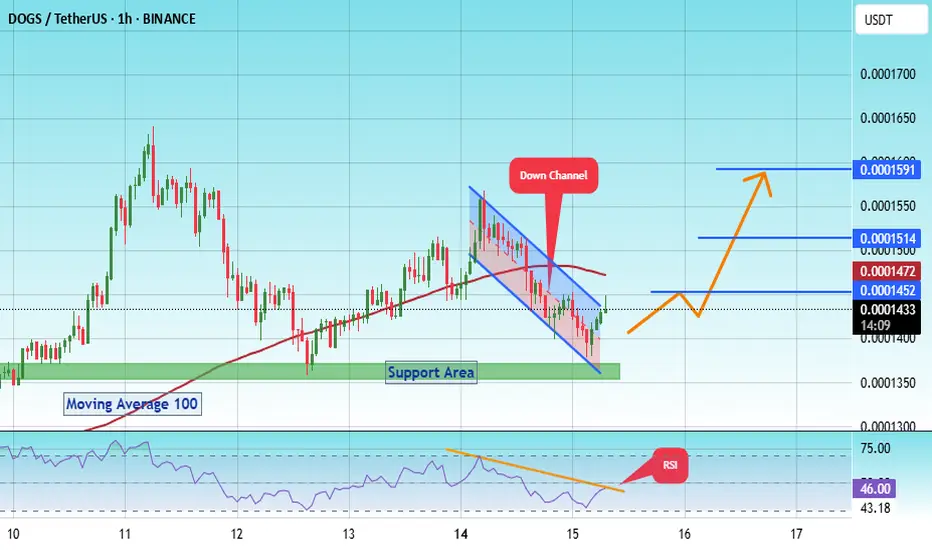
#DOGS/USDT – Launchpad or Breakdown?#DOGS
The price is moving within a descending channel on the 1-hour frame, adhering well to it, and is on its way to breaking it strongly upwards and retesting it.
We have a bounce from the lower boundary of the descending channel. This support is at 0.0001385.
We have a downtrend on the RSI indicator that is about to break and retest, supporting the upward trend.
There is a key support area in green at 0.0001362, which represents a strong basis for the upward trend.
Don't forget one simple thing: ease and capital.
When you reach the first target, save some money and then change your stop-loss order to an entry order.
For inquiries, please leave a comment.
We have a trend of stability above the Moving Average 100.
Entry price: 0.0001430
First target: 0.0001452
Second target: 0.0001514
Third target: 0.0001590
Don't forget one simple thing: ease and capital.
When you reach the first target, save some money and then change your stop-loss order to an entry order.
For inquiries, please leave a comment.
Thank you.
End of correction and trend continuation towards 1.195?EURUSD is in an important support area, retesting the bottom line of the wedge. I'm loking foward for any sign of reversal from here.

USDCHF long term bullish playHello,
The USDCHF is back to where it last traded in mid 2011. This reflects a significant weakening of the U.S. dollar against the Swiss franc, erasing over a decade of gains. It suggests growing investor demand for safe-haven assets like the franc — possibly driven by concerns around U.S. interest rate policy, inflation trends, or broader global uncertainty. The last time the dollar was this weak against the franc was more than 13 years ago.
While a weaker dollar is seen as good for the United States, we see a long term buy opportunity for this pair from the current level based on technical analysis. The pair is now trading at the bottom of the range.
Next week will be an important time for this pair as we wait for the inflation data. This will be key in guiding what the FED might do during the next meeting towards the end of the month.

ETHUSD Is Going Up! Buy!
Please, check our technical outlook for ETHUSD.
Time Frame: 12h
Current Trend: Bullish
Sentiment: Oversold (based on 7-period RSI)
Forecast: Bullish
The market is approaching a key horizontal level 3,011.53.
Considering the today's price action, probabilities will be high to see a movement to 3,240.64.
P.S
The term oversold refers to a condition where an asset has traded lower in price and has the potential for a price bounce.
Overbought refers to market scenarios where the instrument is traded considerably higher than its fair value. Overvaluation is caused by market sentiments when there is positive news.
Disclosure: I am part of Trade Nation's Influencer program and receive a monthly fee for using their TradingView charts in my analysis.
Like and subscribe and comment my ideas if you enjoy them!

NZD/USD SELLERS WILL DOMINATE THE MARKET|SHORT
NZD/USD SIGNAL
Trade Direction: short
Entry Level: 0.607
Target Level: 0.592
Stop Loss: 0.617
RISK PROFILE
Risk level: medium
Suggested risk: 1%
Timeframe: 1D
Disclosure: I am part of Trade Nation's Influencer program and receive a monthly fee for using their TradingView charts in my analysis.
✅LIKE AND COMMENT MY IDEAS✅

AUD/CHF BEST PLACE TO SELL FROM|SHORT
AUD/CHF SIGNAL
Trade Direction: short
Entry Level: 0.524
Target Level: 0.520
Stop Loss: 0.526
RISK PROFILE
Risk level: medium
Suggested risk: 1%
Timeframe: 3h
Disclosure: I am part of Trade Nation's Influencer program and receive a monthly fee for using their TradingView charts in my analysis.
✅LIKE AND COMMENT MY IDEAS✅

Ethereum Primed for Breakout as Institutional Interest SurgesBlackRock's aggressive ETH accumulation—$276M in February, $98M just this week—signals institutional conviction as Ethereum approaches a breakout towards $3,000. With real-world asset (RWA) tokenization exploding to $21B+ (Ethereum commanding 59% market share) and stablecoin volume hitting record $717B monthly highs, ETH is positioned as the backbone of traditional finance's blockchain migration.
The convergence of institutional buying, technical breakout signals, and Ethereum's dominance in the fastest-growing crypto sectors creates a perfect storm for the next major price surge 🚀
intel.arkm.com

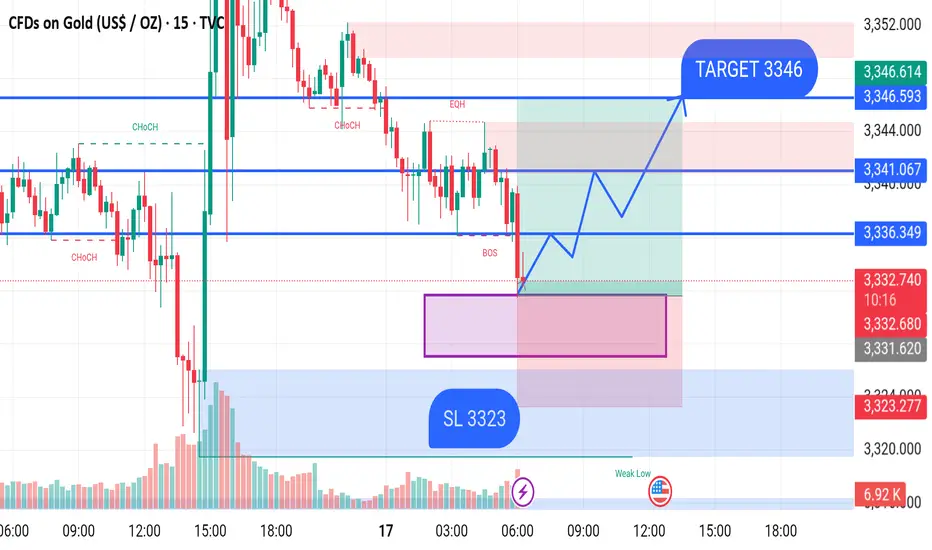
GOLD BUY M15 Gold (XAU/USD) 15-Minute Chart Analysis – July 17, 2025
Price is currently trading around the 3,333.71 level after a Break of Structure (BOS) to the downside. The market has entered a demand zone (highlighted in pink), suggesting potential bullish momentum if the zone holds.
A possible bullish scenario is illustrated on the chart:
Price is expected to retest the demand zone between 3,331 – 3,324.
From this zone, a bullish reversal is anticipated with higher highs and higher lows.
If the bullish move plays out, the first resistance level lies around 3,336 – 3,341.
The final target is set at 3,346, marked as the Take Profit (TP) level.
Key Levels:
Entry Zone (Demand Zone): 3,331 – 3,324
Stop Loss (SL): 3,323
Target (TP): 3,346
Intermediate Resistance Levels: 3,336 and 3,341
renderwithme | The unbreakable bond of Chainlink TechnicalBelow is a technical analysis of Chainlink (LINK/USD) based on the provided real-time financial data and general market insights. Please note that cryptocurrency markets are highly volatile, and this analysis is for informational purposes only, not financial advice. Always conduct your own research before making investment decisions.
# Current Price and Market Overview
Current Price: $16.70 USD at the time of posting
24-Hour Trading Volume: Not specified in the provided data, but recent sources indicate significant trading activity, with volumes around $422.74M to $672.42M.
52-Week Range: $3.25 (low) to $10.90 (high)
Previous Day Close: $16.67
chart for your reference

MSFT longThis is a After a strong pullback and a clear rejection at key support levels, the EUR/USD pair is showing signs of a potential reversal. Technical indicators suggest oversold conditions, making this an attractive entry for bullish traders.
🎯 Entry: Around 1.15873
🛑 Stop Loss: Below 1.19700
💰 Take Profit: 1.0750 – 1.14385
Always trade with proper risk management and confirm with your own analysis!good trade

FLOKI Isn’t Missing the Party🚀 CRYPTO:FLOKIUSD Price has broken above the May peak, confirming a bullish continuation. With momentum building, price is now eyeing the next upside target near $0.00018.
#elliottwave #memecoins #altseason

MARA Is Waking Up And Looks Promising For The Crypto MarketMARA Is Waking Up And Looks Promising For The Crypto Market, as it can send the price even higher this year from a technical and Elliott wave perspective.
Marathon Digital Holdings with ticker MARA nicely and sharply recovered away from the strong support after a completed projected higher degree abc correction in wave B/2. So, similar as Crypto market, even MARA can be forming a bullish setup with waves »i« and »ii« that can soon extend the rally within wave »iii« of a five-wave bullish cycle within higher degree wave C or 3, especially if breaks above 21 first bullish evidence level. It could be easily supportive for the Crypto market if we consider a positive correlation.

$ETH Bullish Set up Ethereum just started bull move .Five wave move could take it to all time high of 17k .....
