Waves

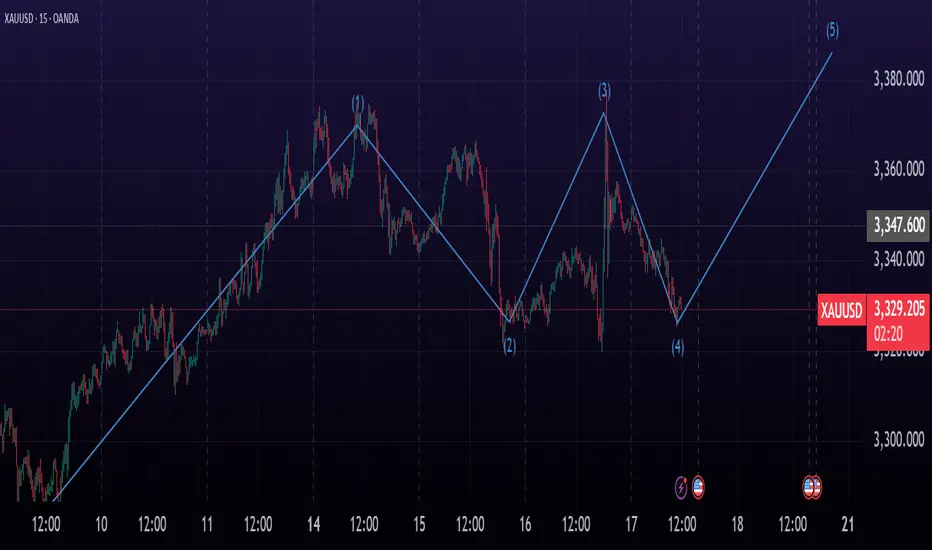
Gold (XAU/USD) - Elliott Wave Suggests Wave 5 Upside Starting!📊 Current Wave Count:
Wave 1 (Complete): Rally from to .
Wave 2 (Corrective): Pullback to (held 50%/61.8% Fib).
Wave 3 (Extended): Strong impulse to .
Wave 4 (Corrective): ABC pattern ending near (e.g., 38.2% Fib of Wave 3).
🎯 Wave 5 Projection:
Target: Typical 0.618–1.0 extension of Wave 1-3 → $ .
Invalidation: Break below Wave 4 low ($ ).
📈 Why Now?
Wave 4 completed as a shallow correction (flat/triangle).
MACD/RSI shows bullish divergence on lower timeframes.
Fundamental drivers (e.g., Fed dovishness, inflation) align.
⚡ Trading Plan:
Entry: Near current pullback (~$ ).
Stop Loss: Below Wave 4 low.
Take Profit: Scale out at 0.618 and 1.0 extensions.
WAVES ON WAY TO $2waves have a high chance to enter a new break to 2 usd, since the last data.
When there is more confirmation, the updates will be below.

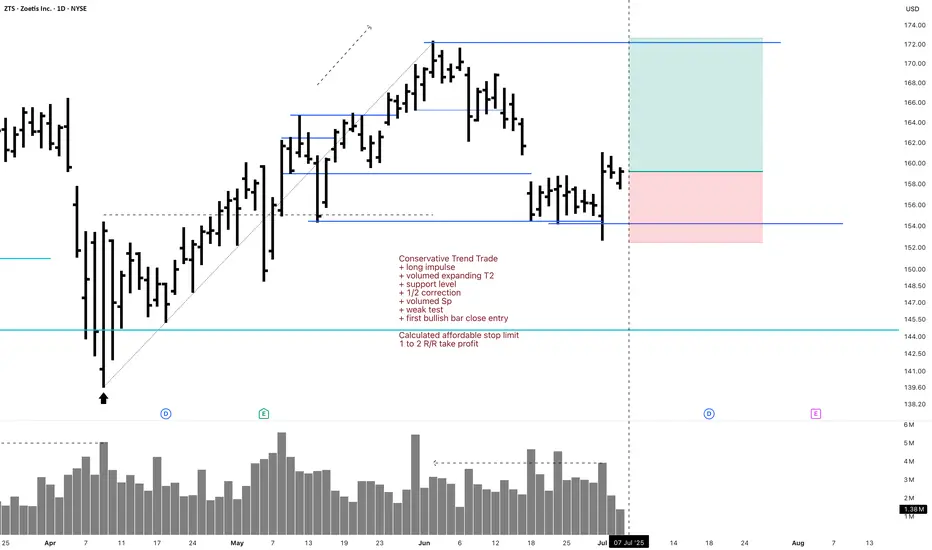
ZTS Investment 1D Long Conservative Trend TradeConservative Trend Trade
+ long impulse
+ volumed expanding T2
+ support level
+ 1/2 correction
+ volumed Sp
+ weak test
+ first bullish bar close entry
Calculated affordable stop limit
1 to 2 R/R take profit
Monthly trend
"+ long impulse
+ ICE level
+ support level
+ 1/2 correction
+ volumed 2Sp
+ weak test?"
Yearly trend
"+ long impulse
- correction"
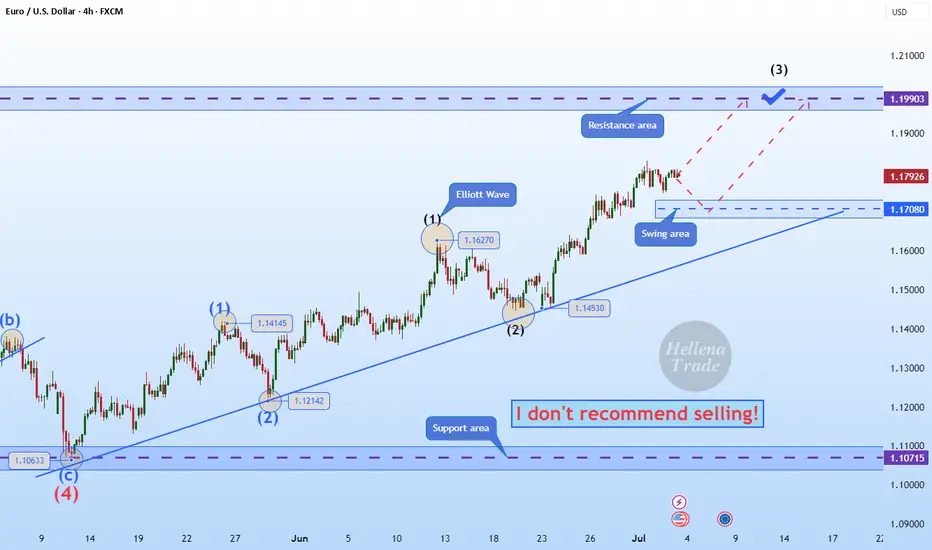
Hellena | EUR/USD (4H): LONG to the resistance area 1.20000.Colleagues, I believe that the upward impulse is not over yet. Wave “3” of the higher order and wave “3” of the lower order are just completing their movement, and I think that at the moment it is worth looking at the resistance area of 1.20000.
This is a very attractive psychological level where wave “3” could complete its upward movement.
Manage your capital correctly and competently! Only enter trades based on reliable patterns!
ZTS 1D Investment Conservative Trend TradeConservative Trend Trade
+ long impulse
+ volumed expanding T2
+ support level
+ 1/2 correction
+ volumed Sp
+ weak test
+ first bullish bar close entry
Calculated affordable stop limit
1 to 2 R/R take profit
Monthly Trend
"+ long impulse
+ T2 level
+ support level"
Yearly Trend
"+ long impulse
- correction"

GBPJPY ForecastLooking long up to 200.00 levels then seeking bearish PA to test the June lows. This is only validated on bearish PA on H4 or Daily.

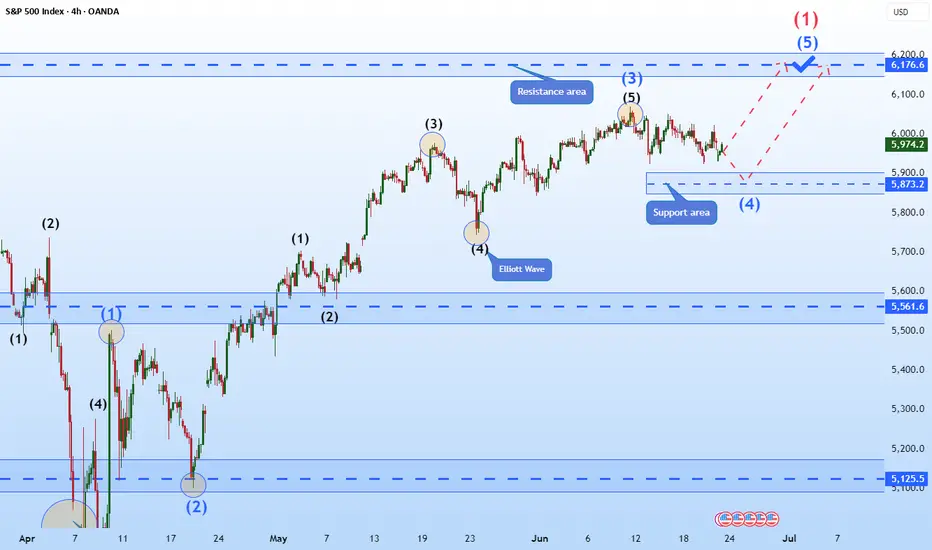
Hellena | SPX500 (4H): LONG resistance area of 6176 (Wave 1).Colleagues, the previous forecast remains essentially unchanged, and the target is still 6176, but I think the forecast can be updated because the price has been flat for quite some time.
I still expect the upward movement to continue in the large wave “1” and in the medium-order wave “5”.
A small correction to the support area of 5873 is possible.
Manage your capital correctly and competently! Only enter trades based on reliable patterns!
F 5M Long Daytrade Aggressive CounterTrend TradeAggressive CounterTrend Trade
- long impulse
- unvolumed T1
+ resistance level
+ biggest volume 2Sp-
+ weak test
+ first bullish bar below close entry
Calculated affordable stop market
T2 5M take profit
1H CounterTrend
"- long impulse
- unvolumed T1
+ resistance level"
1D CounterTrend
"- long impulse
- unvolumed T1
+ resistance level"
1M CounterTrend
"+ short impulse
- exhaustion volume
+ T2 level
+ resistance level
- unvolumed interaction bar
- reaction bar looks to close bullish in 6 days"
1Y CounterTrend
"+ long impulse
+ volumed T2 level
+ volumed 2Sp+
+ 1/2 correction
+ weak test"

F Investment 1D Conservative CounterTrend TradeConservative CounterTrend Trade
+ long impulse
- before 1/2 correction
+ expanding T2
+ support level
+ biggest volume 2Sp-
+ weak test
+ first bullish bar close entry
Calculated affordable stop limit
1 to 2 R/R take profit
Monthly CounterTrend
"- short impulse
+ 1/2 correction
- unvolumed T2
- resistance level
+ unvolumed interaction bar"
Yearly Trend
"+ long impulse
+ volumed T2 level
+ volumed 2Sp+
+ 1/2 correction
+ weak test"

Dollar In Fifth Wave-Reversal In Trend May Not Be Far Away.The Fed will announce its latest policy decision later, and expectations are that Powell will keep rates on hold, especially after last week's slightly higher inflation print and still solid US jobs data. We can see some stabilization in the US dollar ahead of this event, but we have to keep an eye on geopolitical tensions in the Middle East, which coudl also play a key role in driving safe haven flows.
Meanwhile, the stock market continues to trade sideways, and I don't expect any major breakouts or strong moves ahead of the Fed. Also, tomorrow is a holiday in the US, so that could contribute to slower market conditions into the end of the week, unless, of course, the situation in the Middle East gets worse.
Looking at the DXY waves structure, I see athree-wave move from the most recent lows, so the fourth wave I highlighted a few days ago could now be approaching completion near this week’s key resistance around the 99 level. That’s definitely a level to watch for a potential fresh, but possibly final sell-off toward new lows around 97, maybe even 96.
That’s where the DXY could stabilize, as ending diagonal pattern signals that we are likely in the late stages of wave five, meaning this bearish cycle could soon come to an end.

Aggressive Trend Trade 1HAggressive Trend Trade 1H
- short trend
+ volumed T1
+ support level
+ biggest volume 2Sp+
Daily Trend
+ long impulse
+ T2 level
+ support level
+ 1/2 correction"
Monthly CounterTrend
"- short balance
+ expanding ICE
+ support level
+ unsuccessful biggest volume manipulation"
Yearly Trend
"+ long impulse
+ 1/2 correction
- below exhaustion volume?
- below SOS"
Will add more when 5M, 1H or 1D will show entry point

PLUG 1D Investment Long Aggressive Trend TradeAggressive Trend Trade
- short impulse
+ volumed TE / T1 level
+ support level
+ biggest volume 2Sp-
+ weak test
+ first buying bar close level
Calculated affordable stop limit
1 to 2 R/R take profit
Monthly Trend
"+ long impulse
+ support level
+ T2 level
+ biggest volume reaction bar
= below 1/2 correction"
Yearly CounterTrend
- short impulse

PLUG 1H Long Swing Conservative Trend TradeConservative Trend Trade
+ long impulse
+ 1/2 correction
+ volume zone
- strong approach
+ ICE level
+ support level
+ volumed Sp
Calculated affordable stop limit
1 to 2 R/R take profit
Daily Trend
"- short impulse
+ volumed TE / T1 level
+ support level
+ biggest volume 2Sp-
+ weak test"
Monthly Trend
"+ long impulse
+ support level
+ T2 level
+ biggest volume reaction bar
= below 1/2 correction"
Yearly CounterTrend
- short impulse
Will add more after successful test on 1H and / or after test completes on 1D.

Hellena | GOLD (4H): LONG to resistance area of 3439.37.Colleagues, Last time, I suggested that the five-wave movement was not yet complete. It seems that this is indeed the case.
Wave "5" of the higher degree is unfolding, and I expect the price to reach the resistance area around 3439.37, which marks the top of wave "X".
Within the smaller five-wave structure, I believe wave "3" is currently in progress.
A correction toward the 3248.38 area is possible.
Manage your capital correctly and competently! Only enter trades based on reliable patterns!

HSBC (HSBC) – $54 Risk Zone if ABC Correction Is Triggered HSBCHSBC is currently trading within a rising wedge, but a potential short-term drop of approximately 5% could trigger a full ABC correction pattern. This scenario is not confirmed yet, as the chart remains structurally bullish.
However, should the price reverse and break below the rising channel, it would likely mark the start of wave C, completing an A-B-C corrective sequence. This development could lead the price toward the $54 support zone, which aligns with a previous demand area.
While there is no immediate breakdown or weakness, traders should remain alert. A simple -5% drop might be all it takes to activate the next phase of correction.
Pattern: Potential ABC correction
Trigger: 5% decline from current levels
Target: $54
Bias: Neutral – watch for reaction if price softens

WAVESUSDT - Upward Target LevelsListed a few bull targets once this breakout of the falling wedge pattern occurs
Hopefully these levels are reached and the previous ATH is eclipsed
Falling wedge is a bullish pattern, lets see where it goes
Weekly chart

Hellena | Oil (4H): SHORT to support area of 54.00.Friends, what do we see after the recent downward movement? Most likely we see a continuation of the downward movement in a combined correction.
The hardest thing about compound corrections is to understand where the wave ends and begins.
I believe that the price is now in the middle wave “C” and will continue the downward movement to the target of 53.991.
Wave “B” is likely to reach the 60.00 area, but I do not recommend long positions. Work with pending limit orders.
Manage your capital correctly and competently! Only enter trades based on reliable patterns!

WAVES Falling WedgeA falling wedge pattern during the bear market
This is a bullish pattern suggesting a breakout once completed
Very cheap right now for WAVES
Chart pattern analyses on this Daily timeframe

SP500 Entanglement of Macro Price ActionFib interconnectedness of 2 complete macro cycles
Linear coverage of the market derived from the structure:
Dot com bubble cycle ⌒ Low (march '94) ➡️ Peak '00 ➡️ Crisis bottom
Housing cycle ⌒ Low '02 ➡️ Peak '07 ➡️ Low March '09

Gold Drop to 3256Hello traders! The impulse wave is down, there is a correction, and another impulse wave has started. I expect it to reach 3256.

NEAR/USDT is Nearing The Daily TrendHey Traders, in today's trading session we are monitoring NEAR/USDT for a selling opportunity around 2.55 zone, NEAR/USDT is trading in a downtrend and currently is in a correction phase in which it is approaching the trend at 2.55 support and resistance area.
Trade safe, Joe.

OGKB 5M Investment Aggressive CounterTrend TradeAggressive CounterTrend Trade
- short impulse
+ biggest volume T1 level
+ biggest volume 2Sp-
+ weak test
+ first bullish bar close entry
Calculated affordable stop limit
1/2 yearly level take profit at 0.459
1H Counter Trend
"- short impulse
+ biggest volume TE / T1 level
+ support level
+ volumed 2Sp-"
1D Trend
"+ long impulse
+ JOC level
+ support level
+ 1/2 correction
+ volumed manipulation"
1M Trend
"+ long impulse (in 1d 4h)
+ neutral zone"
1Y CounterTrend
"""- short impulse
+ 2Sp-
+ perforated support level"""
