ETH - While the masses are BULLISH, Elliott tells you to SHORTTTHey guys,
Been a long time isn't it?
I'm back for new analysis.
Don't worry, the bull rally isn't over, we are just shorting hard in order to have a 50% of bullish variation just after.
I will upload my Elliott Wave long term vision for the different chart that I analyse: SP:SPX ; NYMEX:CL1! ; COINBASE:BTCUSD ; COINBASE:ETHUSD ; FOREXCOM:XAUUSD
I will explain how I count my waves and I found my objectives
FOLLOW ME TO NOT MISS ANY OF MY FUTURE PLANS
*
*
BTW, I am selling a PDF , regrouping all the knowledge I have found on Elliott Waves , from the greatest analysts books, into a clear, simple and explicative way,
Contact me in private, or in comment if you don't have enough reputation point if you are interested
*
*
Don't hesitate to comment and check my other idea
Waves

Next down move may start soonThe rise from 88 have been all corrective and can be marked an X wave.
Currently price is taking resistance at 20 Weekly SMA and upper end of the downward sloping channel.
One more up leg is not ruled out which may break the channel line temporarily.
We expect the next leg down to below levels may start post completion of the upmove
- 77 - 38.20% retracement of whole rise from 2020 lows
- 66 - 50% retracement levels.
Lets see how this develops.

waves is bullishHi, dear traders. how are you ? Today we have a viewpoint to BUY/LONG the WAVES symbol.
For risk management, please don't forget stop loss and capital management
When we reach the first target, save some profit and then change the stop to entry
Comment if you have any questions
Thank You

Crude Oil- News-driven. Financial Wave.Oil rose sharply after news of production cuts. While "news-driven" price reactions are often volatile, we are inclined to continue rising for Crude Oil. Our priority scenario is to continue rising from the low of 64 into the 86 range. Support is around 78.85-77.10.

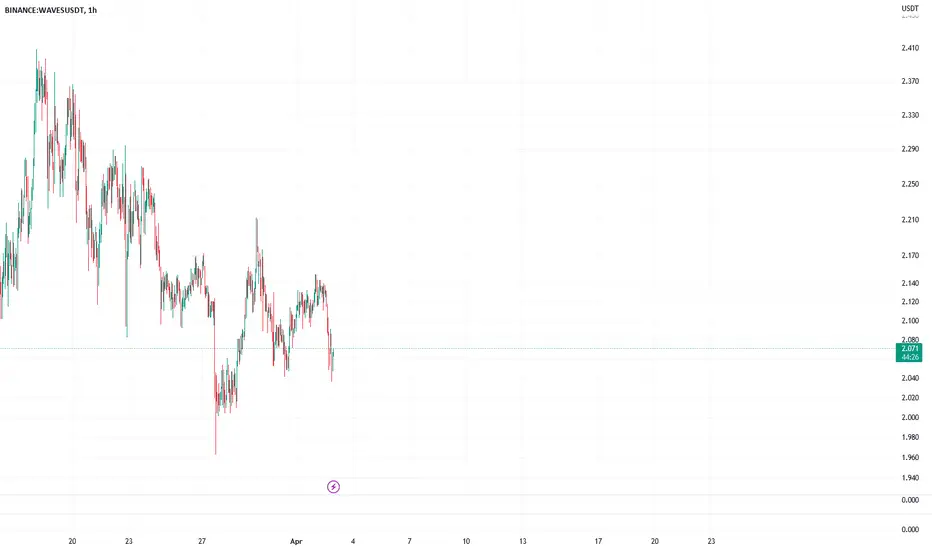
WAVESUSDT at range low, likely to aim for range high at 2.162The price is trading between daily support and weekly resistance. For past few days, it has built another narrow daily range between this daily support and weekly resistance. Currently the price is at low of this range and likely to aim for the range high at 2.162.
Updated Dow Count Looking at 2 scenarios but leaning towards crash wave 3 of 3 being at bat or warming up and getting ready to step up to the plate. There’s an alternate count should the confluence of red lines fail to cap this rally and a horizontal white line in the sand indicted which if exceeded would force a change of view to this is a larger bear rally in play. We’re close to the markets showing us which way this will go.
Previous count invalidated, but if the current count holds true, it’s forecasting a 3 of a 3 wave in an extension. Meaning a crash isn’t far off now.

BTC Short term BuyHello traders
I think Bitcoin is heading towards 29,300, hitting the weekly order block

HBAR could be starting a monster wave 3Simple wave analysis shows $HBAR could be in the throes of a monster wave 3. Taking us back to the breakout that has never been tested and maybe a final 5th wave to a large wick fish towards .22. Good luck to all especially if you bought the lows.....:)

AUDUSD EWTAnalysis based on Elliot wave theory. price move within a downward channel. the projection is to sell the 5 wave of Elliot wave count.

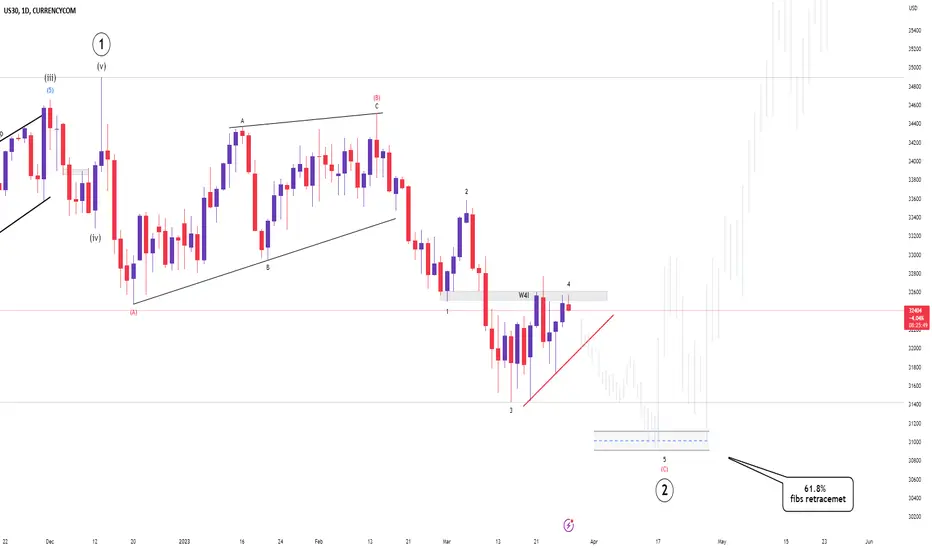
US30 ELLIOT BREAKDOWN (FINAL DROP) Wave previously ended as a the continuation of the whole bullish movement and contains 5 impulse waves (12345 waves). Current, we just see the market about to complete the second wave which conatins three waves with 3-3-5 formation as it sub waves.
lets see how everything play out.
NZDUSD ELLIOT WAVE BREAKDOWN (FINAL POSSIBLE DROP)NZDUSD is currently at the finish of wave 2 which happens to contain a complex correction (WXY) based on Elliot wave principle as you can see from the picture above. Wave C which should contain 5 subwaves ending the overall wave 2 is about to be played out. Let see how it plays out...
Trade Idea:
- Watch for a break of the red trendline for confirmation
- Enter with stops below price
- Targets: 190 pips
Goodluck and as always, trade safe!

OP/USDT Trading IdeaHello, traders
We expect the price to reach the gap as a first target, and there are other targets that the price may reach

Bitcoin is heading to 26k +50%hello traders
Inflation results were very positive and fell at a reasonable rate, at the same time US bonds began to suffer.
The markets are expected to recover slightly, specifically the crypto market
This is consistent with the technical analysis of Bitcoin. We have wave A and wave B is about to end. The price has reached a strong buying area, so we expect that wave C will start from this area.


NDX nasdaq 100In 1 scenario, wave 4 correction could be over. In scenario 2, we can expect the rise of the B wave and then the decline of the C wave.

Double Top: Target reached.Hello Trades,
Am sorry for not sharing this idea earlier before the breakout, but I was waiting for anyone to share it but I found no one shared it !
You still can count it as an educational idea.
-
if you zoom out on your 1h Chart, You will see a double top pattern formed and already broken, thats why waves got about 20% down in the past few days.
-
Educational:
The double top is one of the most popular patterns in trading. It's a reliable reversal pattern that can be used to enter a bearish position after a bullish trend. It consists of 2 tops at nearly the same level with a valley in between, which creates the neckline. The second top does not break the level of the first top, so the price retested this level and tried to make a higher high, but failed. Price breaking the neckline and closing below it would complete the pattern.
Conservative traders look for additional confirmation and aggressive traders may enter a bearish position from the second top. The target can be estimated by measuring the height of the pattern and projecting this downwards from the neckline. Common stop levels are just above the neckline, halfway between the neckline and the tops or above the tops. The double bottom is the bullish version of this pattern that can form after a downtrend.
-
Thumb up for updates
Follow for calls on different coins
-Remember: am not a financial advisor, whatever I publish you have to do what you see on your chart and what you agree with.

[UPDATE] Wyckoff on WAVESHello Traders,
This is a quick update on waves for the targets !
I hope you made some profits from this idea <3
Thumb up for more on WAVES
Follow for more on ALTCOINs.
Have a nice day !!
-
Educational :
The distribution schematic has similar phases to the accumulation schematic, but with many of the same events along the way happening in the opposite direction.
Phase A - Arriving with the Markup Phase of the cycle is the Preliminary Supply (PSY), which demonstrates the first opportunity to sell for strong profit is nearing. The Buying Climax ( BC ) where the Composite Operator and bears first sell-off, creating a new resistance line. Price drops until a new Automatic Reaction (AR) occurs, bouncing the price up again to a Secondary Test (ST).
Phase B - Similar to Phase B of the Accumulation Schematic, in that, this is now where the Composite Operator will sell off its investments and realize profits from the previous schematic phases. Again, bear traps and bull traps may occur between the trading range. An Upthrust (UT) may also occur, briefly surpassing the BC , and setting a new resistance line.
Phase C - Just as with the Accumulation Schematic, this phase may or may not occur. An Upthrust After Distribution (UTAD) could find the market a new high. Whether or not this happens, Phase D eventually takes place.
Phase D - This is the last point for investors to sell at higher prices before the price begins to capitulate. Usually, a Last Point of Supply (LPSY) is found within the trading range, then a buy/sell reaction occurs, and another LPSY is located at or below the support line, triggering Phase E.
Phase E - The downward capitulation begins with a clear drop under the trading range as investors sell off, diminishing demands and tanking the price.
------

Wave 5 of 5 Gold?If this wave count remains valid expect nothing less than a vertical blow off top type move. In commodities wave 5 can be the strongest wave. The higher could be interrupted by wild corrections to the downside. Keep in mind this is a long term chart so the move isn’t necessarily imminent.
Not investing advice and do your own due diligence.

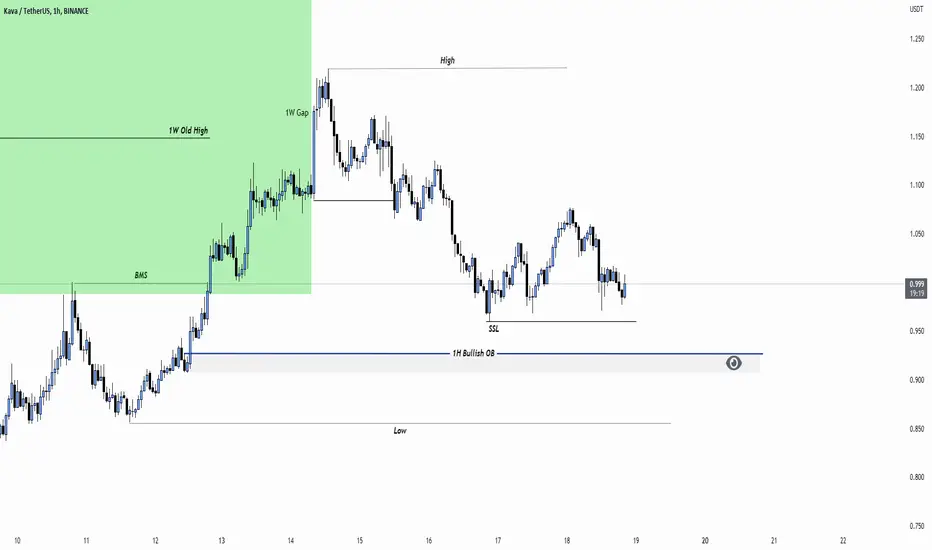
Kava/Usdt Trading IdeaHello, traders
I monitor the kava cryptocurrency for a short-term buying opportunity. If I get confirmation from the order block, I execute my trade

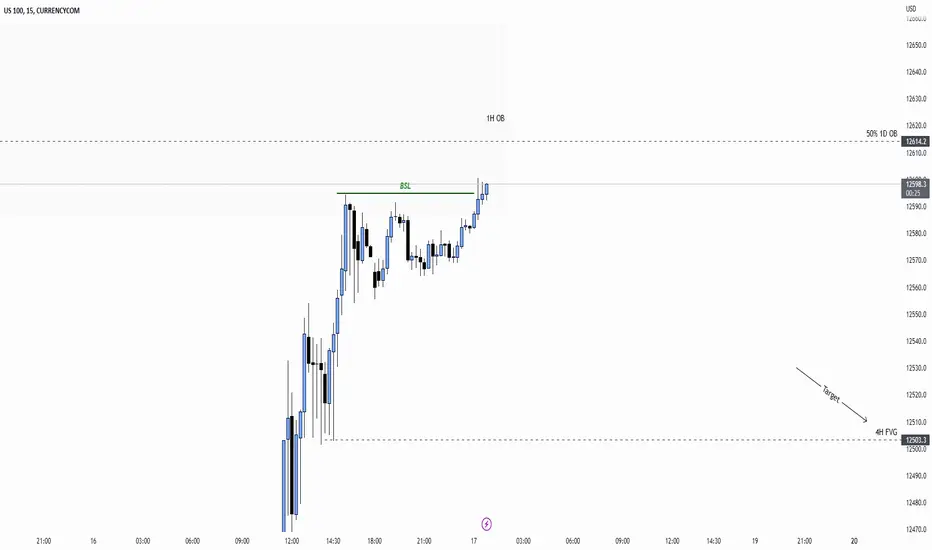
US100 Trading Idea Hello, traders
In today's session I am watching the US100 for a short Term sell opportunity if I get confirmation that the trade is executed
GBP USD SELL (POUND STERLING - US DOLLAR)Hi there.
Price is forming a continuation pattern to the downside.
Watch strong price action at the current levels for sell.

BANK OF AMERICA CORPORATION SELLHi there.
Price is moving impulsively to the downside.
Wait for the price to form a continuation pattern and watch strong price action for sell.
