ALRS 1D Long Investment Aggressive CounterTrend TradeAggressive CounterTrend Trade
- short impulse
+ volumed T1
+ support level
+ biggest volume Sp
+ weak test
+ first bullish bar close entry
Calculated affordable stop limit
Take profit
1/3 - 1 to 2 R/R
1/3 - 1D T2 / 1M T2
1/3 - 1/2 of 1Y
Calculated affordable stop limit
Take profit
1/3 - 1 to 2 R/R
1/3 - 1D T2 / 1M T2
1/3 - 1/2 of 1Y
Monthly CounterTrend
"- short impulse
+ volumed TE / T1
+ support level
+ volumed Sp
+ test"
Yearly Trend
"+ long impulse
+ 1/2 correction
+ T2 level
+ support level
+ manipulation"
Waves

Update to Dow Jones Industrials Time At Mode Back in 2015 I had published a chart with annual data for the Dow Jones Industrials. I will provide a link at the bottom.
The research for this patterning is something I did myself by hand using pencil and paper back in the 1980's. These patterns show up in all time frames.
There is plenty of room to enhance the research on this technique and a group of us gather in the chat rooms here at TradingView to discuss new trades that set up and point out when trades expire.
Notice how these two grey boxes (which are both 50% drops in price) that expand wider in time from the 1960's to the 1980's and the 2000-2010's had a multi-year trend, followed by a monster crash (1987 was 40% and 2000 was 37%) and then just two+ years later there was a secondary bear market of 20% in 1990 and 22% in 2022. Keep in mind this is just for the DJ:DJI and not the Nasdaq Composite or S&P500 which were greater corrections.
The 11-year time frame of the 1999-2011 pattern allows for an 11-year rally from 2012 (which was year 1 of the 11-year rally) shows that time expired. As you can see from the 1943-1962 trend, a smaller 5-year mode formed at the end of the 20 year trend and then the market peaked in 1972-1973 when time expired for the second, smaller mode.
I had to reconstruct this chart after the data for the previous chart changed symbol. See the link below to see the original.
I look forward to your additional research onto this pattern and its implications to the idea that we are in a similar period to 1993-1994 with rally years of 1996, 1997, 1998, 1999 and 2000 ahead of us.
All the best,
Tim
October 19, 2024 3:31PM EST

Hellena | EUR/USD (4H): LONG to the resistance area 1.11613.Colleagues, the price is in the correction of wave “2”. I believe that the upward five-wave impulse is not yet complete. In any case, I think that the price will still reach the maximum of wave “1” at 1.11613.
The question is how far will the correction of wave “2” go or is it over? There is no way to know for sure, so I don't recommend selling. I think we should stick to long positions.
Manage your capital correctly and competently! Only enter trades based on reliable patterns!

Elliott Wave Update – Clean Count DevelopmentBINANCE:SOLUSDT
We are currently tracking a developing (B) wave as part of a larger corrective structure.
The move up from the local low unfolds as a classic 5-wave impulse (yellow), where wave 3 is completed, wave 4 is forming as an A-B-C flat correction, and wave 5 is still expected to follow, completing wave (C) of (A).
After that, we anticipate a drop into wave (B) of the corrective sequence before a potential final push into the green target zone to complete wave (C) of (B).
Once this entire correction is done, the expectation remains for a larger 5-wave decline to complete the macro structure.
Wave count stays valid as long as internal rules of Elliott Wave Theory are respected.

Hellena | GOLD (4H): LONG to resistance lvl 3100 (wave B).Colleagues, at this point I have redrawn the waves a bit and realized that the upward movement is not over yet, but a rather large correction is possible within waves “ABC” and if wave ‘A’ is finished or almost finished, I expect wave “B”. I believe that the price will reach the level of 3100. After that a reversal and continuation of a small downward movement is possible.
But for now I would look at long positions.
Manage your capital correctly and competently! Only enter trades based on reliable patterns!

Hellena | EUR/USD (4H): LONG to the resistance area 1.09484.Dear colleagues, the upward impulse of the five-wave movement is not over yet, and at the moment we see the end of the correction of wave “4”.
I believe that the price can still slightly update the low and reach the area of 1.07232 , but the priority is the upward movement in wave “5”, so I expect the price to reach the resistance area of 1.09484.
Manage your capital correctly and competently! Only enter trades based on reliable patterns!

Hellena | GOLD (4H): LONG to resistance area 3100.Wave “3” is still continuing its progression. This means that the five-wave impulse is not over yet and we expect the upward movement to continue.
Of course I would like to see wave “4” as a corrective wave in the area of 3024 level, then I expect an upward movement to the area of 3100 level. This level is also considered to be quite strong, from which there could be a correction.
Manage your capital correctly and competently! Only enter trades based on reliable patterns!

Hellena | Oil (4H): SHORT to the area of 65.268.Colleagues, I believe that the downward movement is not over yet, and now the price is in a complex combined correction. The second correction also consists of “ABC” waves.
In an ideal scenario, the price completes wave “C” in the 70.000 area and starts the downward movement to the support area of 65.268.
In general, the plan has not changed since the last forecast, but the bulls still have strength, so we should take the upward movement as an opportunity to profitably go short.
Manage your capital correctly and competently! Only enter trades based on reliable patterns!

F 5M Daytrade Long Aggressive Trend TradeAggressive Trend Trade
- short impulse
+ volumed TE / T1 level
+ support level
+ long volume distribution approach
+ biggest volume 2Sp+
- no test
Calculated affordable stop limit
1 to 2 R/R take profit before 5M T2
Hour Trend
"- long impulse
- volumed T2
+ support level
+ 1/2 correction
+ biggest volume manipulation"
Day Trend
"+ long impulse
+ 1/2 correction
- neutral zone
- context direction short"
Month CounterTrend
"- short impulse
+ 1/2 correction
- unvolumed T1
+ support level
+ long volume distribution
+ biggest volume manipulation"
Year Trend
"+ long impulse
+ volumed T2 level
+ volumed 2Sp+
+ 1/2 correction
+ weak test"

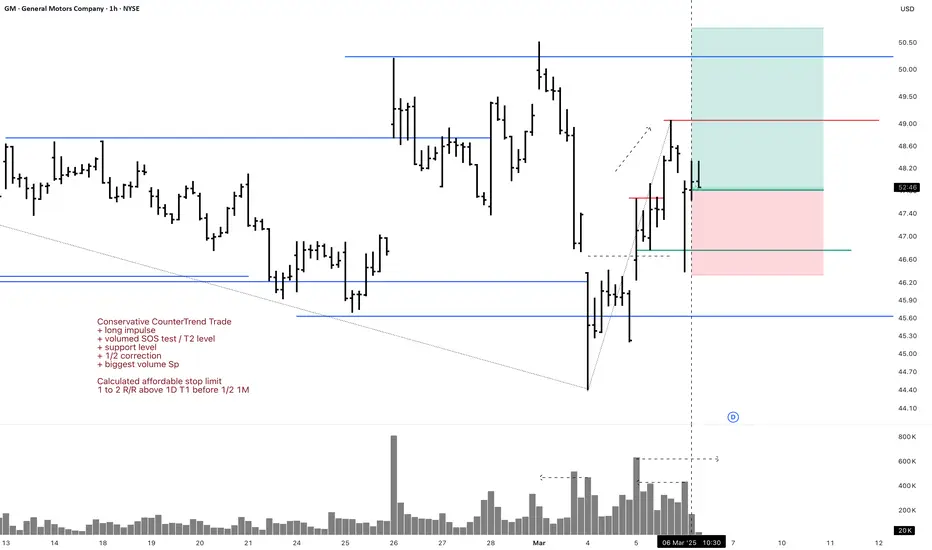
GM 1H Long Swing Conservative CounterTrend TradeConservative CounterTrend Trade
+ long impulse
+ volumed SOS test / T2 level
+ support level
+ 1/2 correction
+ biggest volume Sp
Calculated affordable stop limit
1 to 2 R/R above 1D T1 before 1/2 1M
Daily CounterTrend
"- short balance
- unvolumed expanding T1
+ volumed 2Sp+
+ test"
Monthly Trend
"+ long impulse
- below 1/2 correction
+ SOS test level?"
Yearly Trend
"+ long balance
- neutral zone"
Will add more if 5M corrects to 1/2 or 1H doest weak test and resumes buying
Wave 5 startedIt has a broken above a small base pattern with bullish momentum signals. Wave 5 seems to have started.

GM 5M Long Conservative Trend TradeConservative Trend Trade
+ long impulse
+ SOS level
+ support level
+ 1/2 correction
+ Sp
Calculated affordable stop limir
1 to 2 R/R take profit
1H Trend
"+ long impulse
+ volumed SOS test / T2 level
+ support level
+ 1/2 correction
+ biggest volume Sp
+ weak test
+ first buying bar closed"
1D CounterTrend
"- short balance
- unvolumed expanding T1
+ volumed 2Sp+
+ test"
1M Trend
"+ long impulse
- below 1/2 correction
+ SOS test level?"
1Y Trend
"+ long balance
- neutral zone"

Hellena | GOLD (4H): LONG to 161.8% Fibo lvl area at 3038.Dear colleagues, I believe that the upward movement is not over yet. The bulls have gained strength and the upward five-wave movement is not over yet!
I expect that the wave “3” of senior and middle order is not yet complete. Possible correction to the area of 2955.837, then I expect an upward movement to the area of 161.8% Fibonacci extension 3038.730.
As usual - the upward movement is in priority, so I do not recommend short positions, but I recommend long limit pending orders.
Manage your capital correctly and competently! Only enter trades based on reliable patterns!

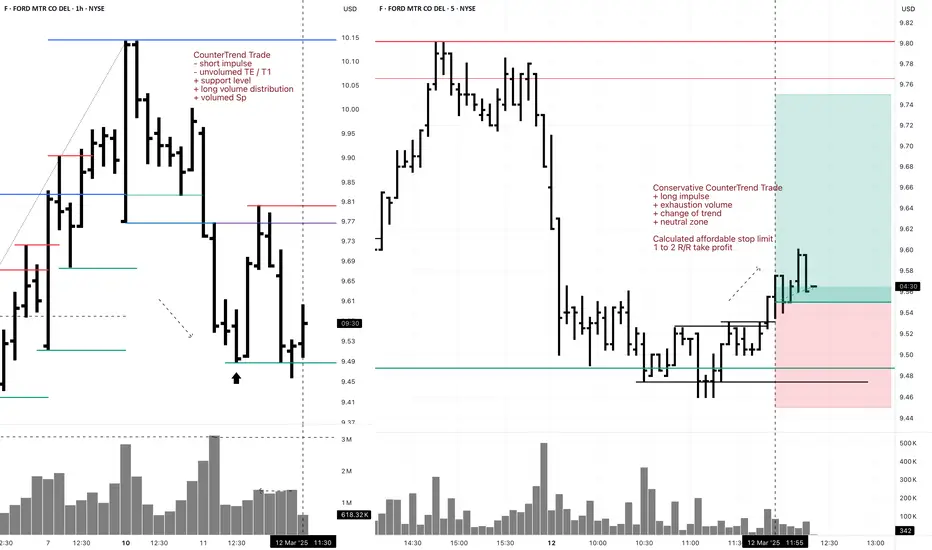
F 5M DayTrade Long Conservative CounterTrend TradeConservative CounterTrend Trade
+ long impulse
+ exhaustion volume
+ change of trend
+ neutral zone
Calculated affordable stop limit
1 to 2 R/R take profit
1H CounterTrend
"- short impulse
- unvolumed TE / T1
+ support level
+ long volume distribution
+ volumed Sp"
1D CounterTrend
"+ long impulse
- biggest volume on correction
- below SOS test level
- below support level
+ 1/2 correction"
1M Trend
"- short impulse
+ 1/2 correction
- unvolumed T1
+ support level
+ reverse volume approach
+ volumed manipulation"
1Y Trend
"+ long impulse
+ volumed T2 level
+ volumed 2Sp+
+ weak test"
F 5M Daytrade Conservative CounterTrend TradeConservative CounterTrend Trade
+ long impulse
+ T1 level
+ support level
+ 1/2 correction
+ volumed 2Sp-
Calculated affordable stop limit
1 to 2 R/R take profit
1H Countertrend
"- short impulse
- unvolumed TE / T1
+ support level
+ long volume distribution
+ volumed Sp
+ test"
1D Trend
"+ long impulse
- biggest volume on correction
- below SOS test level
- below support level
+ 1/2 correction"
1M CounterTrend
"- short impulse
+ 1/2 correction
- unvolumed T1
+ support level
+ reverse volume approach
+ volumed manipulation"
1Y Trend
"+ long impulse
+ volumed T2 level
+ volumed 2Sp+
+ weak test"

USD/CAD: Textbook Waves—ABC Correction Next?Discover the Power of Elliott Waves with This USD/CAD Setup!
Hey traders! If you’re looking for a clean, textbook Elliott Wave example to sharpen your analysis skills, you’re in the right place. Let’s break it down together—and who knows, this could be the edge your trading needs!
Elliott Wave Breakdown
Wave 1: Kicked things off with a strong move higher, marking the start of the current trend.
Wave 2 (Flat): A sideways, flat correction—think of it like the market catching its breath. It moved in three waves (A-B-C), holding up price and hinting at the strength to come.
Wave 3: The rocket ship! Wave 3 is typically the powerhouse, and USD/CAD delivered. Traders who caught this move likely enjoyed a nice ride.
Wave 4 (Zigzag): True to Elliott Wave theory, we saw alternation. After the flat Wave 2, Wave 4 gave us a sharp A-B-C zigzag down. Quick, clean, and offering a second chance for those who missed Wave 3.
Wave 5: The final push completed the 5-wave impulse, potentially wrapping up the current trend.
What’s Next? An ABC Correction!
This is where it gets exciting. After completing a 5-wave pattern, markets often retrace in an A-B-C correction. This could be your chance to plan the next move. Will it pull back to the 38.2%, 50%, or even 61.8% retracement? Smart traders are already watching these levels!
Why This Matters for You
Understanding wave structures like this can give you a huge advantage. It’s not about predicting the future—it’s about stacking probabilities in your favor. And when a textbook pattern like this shows up, it’s an opportunity worth watching.
Actionable Tips for Traders
Be ready for the ABC correction—this could be your ideal entry for the next impulse move.
Use tools like RSI, MACD, or trendline breaks for extra confirmation.
Manage risk wisely. No setup is guaranteed, but the odds are on your side when you follow the waves!
Stick around for more insights like this. If you find this breakdown helpful, give it a thumbs up and follow me for more real-time analyses and trading tips!
Good luck and happy trading!

PFE 1H Long Swing Conservative Trend TradeConservative Trend Trade
+ long impulse
+ SOS level
+ support level
+ 1/2 correction
+ biggest volumed Sp
Calculated affordable stop limit
1 to 2 R/R take profit before 1/2 of the Month
Expandable to 1/2 of the Year
Daily Trend:
"+ long impulse
+ neutral zone
+ close to 1/2 correction"
Monthly CounterTrend
"- short balance
+ unvolumed expanding ICE
+ volumed 2Sp-
+ weak test"
Yearly Trend
"+ long impulse
+ 1/2 correction
+ exhaustion volume?"
Will add more if corrects to 1/2 of 1H wave.

MRK 5M Long Investment Aggressive CounterTrend TradeAggressive CounterTrend Trade
- short impulse
+ exhaustion volume
+ volumed T1
+ volumed 2Sp-
+ weak test
+ first bullish bar closed entry
Calculated affordable stop limit
1/2 1M take profit
Hourly CounterTrend
"- short impulse
+ 1D SOS level"
Daily Trend
"+ long impulse
+ SOS level
- before 1/2 correction"
Monthly CounterTrend
"- short impulse
+ 1/2 correction
+ exhaustion volume?"
Yearly Trend
"+ long impulse
+ 1/2 correction
+ exhaustion volume?"

F 5M Long Conservative Trend DayTrade Conservative Trend Trade
+ long impulse
+ SOS level
+ 1/2 correction
+ support level
+ biggest volume 2Sp+
Calculated affordable stop limit
1D T2 take profit
1H Trend
"+ long impulse
- before 1/2 correction
+ SOS test level"
1D Trend
"- short impulse
+ exhaustion volume
+ volumed TE / T1 level
+ biggest volume 2Sp+
+ test"
1M CounterTrend
"- short impulse
+ 1/2 correction
- unvolumed T1
+ support level
+ reverse volume approach
+ volumed manipulation"
1Y Trend
"+ long impulse
+ volumed T2 level
+ volumed 2Sp+
+ weak test"

Hellena | GOLD (4H): LONG to resistance area 2955 (Wave 3).Dear Colleagues, after Trump's statements and the general political situation, the price went sharply into a downward movement, but this does not mean that I give up the upward movement.
At the moment I think that wave “2” is completing the correction and soon we will see the long-awaited upward movement.
I think that the price can still update the minimum of wave “2” in the area of 2833, then (or immediately) will start an upward movement in wave “3” at least to the area of the maximum of 2955 of wave “1”.
Manage your capital correctly and competently! Only enter trades based on reliable patterns!

Hellena | EUR/USD (4H): LONG to the area of 1.08878 (Wave C).Well, colleagues, it happens, wave “3” continued its rapid development. Wave “3” is usually the longest and it happens that it becomes too long on the news background, which we saw.
At the moment, I assume that the correction in wave “4” will still take place in the area of 1.06966, to then complete wave “5” at least in the area of 1.08878.
But there is another option - wave “3” is still not over. This happens often in wave analysis, so use limit orders.
Manage your capital correctly and competently! Only enter trades based on reliable patterns!

Potential upside for EUR/JPYHello traders
The impulse wave for EUR/JPY is rising and there is an expanding pattern. I expect another impulse wave to rise.

Hellena | EUR/USD (4H): LONG resistance area 1.04630 (Wave 5).Dear colleagues, I decided that I will make a new forecast, as the previous forecast was put to breakeven and the price updated the low of 1.04016.
At the moment I have redrawn the waves a bit and I still believe that the upward movement will continue, as the five-wave impulse is not over.
I believe that the price may slightly update the minimum of wave “4”, then I expect the price to reach at least the area of 1.04630.
Manage your capital correctly and competently! Only enter trades based on reliable patterns!
