Today GBP/JPY target is really 188.400? Let's check the analysis📣 Hello Mates!
We can see GBP/JPY is currently running sideways with no clear direction. However, our prediction is that GBP/JPY will go for a sell and reach our targets of 188.980 and 188.400.
We have strong resistance levels at 190.100 and 191.350, along with strong support at 188.900 and 188.400. Although 188.960 is also a strong support level, we believe GBP/JPY will reach our targets of 188.980 and 188.400.
🔑 Remember, money management is crucial. Before employing our analysis, please conduct your own research and refrain from investing more than 2% of your portfolio.
📈 Our Resistance Levels are spotted at:
- 190.100
- 191.350
📉 And our Support Levels are set at:
- 188.960
- 188.400
Stay tuned for further updates and trade smartly! 📊
Wavesanalysis

What is GOLD next target: 2190 or 2112? Check today's analysis📣 Hello Mates!
We can see that our gold buy target has been completed, and now gold is overbought.
Our prediction is that gold will sell from the $2159.00 or $2169.00 area. After that, our sell targets are $2132.00 and $2112.00
🔑 Remember, money management is crucial. Before employing our analysis, please conduct your own research and refrain from investing more than 2% of your portfolio.
📈 Our Resistance Levels are spotted at:
- 2160
- 2170
📉 And our Support Levels are set at:
- 2135
- 2110
Stay tuned for further updates and trade smartly! 📊

ARM: Pull-back before next leg-upI fundamentally bullish on this company and think it might be a potential true-market leader in next market up-trend (if we see one in coming years).
Structurally speaking, I may see full first impulsive structure completed with today's burst into the top border resistance zone for the final wave (c.v of 1).
If this structure will prove to be correct, classical support area for potential correction: 61-55 area.
If price follows through to the upside and closes above todays highs, then next resistance level is: 75-81 zone. Moving above 81 will be a sign to re-consider suggested price structure.
Thank you for your attention!

waves longhello Traders, here is the full analysis for this pair, let me know in the comment section below if you have any questions, the entry will be taken only if all rules of the strategies will be satisfied. I suggest you keep this pair on your watchlist and see if the rules of your strategy are satisfied. Please also refer to the Important Risk Notice linked below.

💹 U.S. DOLLAR INDEX next week prevision 💹In the dollar we can see that it has to continue its downward trend at least until it reaches areas between 99,700 and 98,490 minimum to end with the 5 of the Elliot wave since it has not reached 100% of the fibonachi extension of the last reverse wave. It is making a brief correction before going down again to break SL's and go down again as we observe a strong accumulation in the area where it closed last week. As soon as it has touched the 100%-127% zone, the bullish trend will continue since it has to go to areas of 108,200 minimum. In summary go short options in the short term and when you have touched the 100 level great opportunities to go long.

💹 TSLA next week prevision 💹Bearish beginning of the week looking for 100% of movement 3 of the Elliot wave. It can go down to the 231.16 area at least. Afterwards it can have a slight rise looking for movement 4 to 238.85 minimum to continue falling to 225.51 or more. In general bearish trend during this week with few options to go long.

$WAVES breakout!BINANCE:WAVESUSDT : waves has finally broken out from weekly MA50.
If history repeats itself, we can expect to see a big rally from now up to $30-35 range.

WAVESUSDT 100% PotentialBINANCE:WAVESUSDT Technical analysis update
WAVESUSDT has been trading within a range for the past 400 days. Once the price breaks out of resistance, we can expect a significant move. Currently, the price is trading above both the 100 and 200 EMA, which is a bullish signal.
Buy zone : Below $2.31
Stop loss : $2.05
Resistance 1 : $2.55
Resistance 2 : $3.35
Resistance 3 : $4.80
Regards
Hexa

important analysis for this week in gbpusdMY important analysis for this week in gbpusd, look carefully at the areas and save that analysis for later and leave me your opinion, thank you for your support

TSLA: Some more room to the downside in the near-termTesla has been a true market leader during up-cycles of 2013, 2019 and COVID 2020 market melt-up. It is a rare quality for a company to be able to re-invent itself (even more so several times) and be among next generation of multibaggers.
This analysis highlights several technical scenarios of price development, providing key short and mid-term areas of support and resistance that needs to be held and broken to shift odds into favour of a particular path. I don't personally plan to trade this stock until price will be able to consolidate, providing a low-risk entry point.
I can count 2023 move from Jan into Jul as an initial wave (1) in a form of a three wave A-B-C diagonal. Since Jul, price is in its final wave of correction - C - with an ideal support area at 197-174-153 zone as the end of larger wave (2) correction, or only the first wave A as per alternative yellow count.
Having a closer look on wave C of (2): I cannot consider this correction to be over, until price is bellow 242 (the 0.618% c.i-c.ii). Until price stays bellow this area, I am expecting at least one more wave (c.v) deeper into ideal support zone. The move above 242, will force me to consider the correction of (2)/A to be over and re-analyse next resistance areas to the upside.
A few words on macro-degree structure. I consider a macro-upside potential to 700+, because the move from May 2019 lows, still looks unfinished as the five wave impulsive structure, having only 4 waves in place. The macro-move and wave structure looks quite orderly with price nicely following key resistance and support areas*.
If price moves bellow 153-128 support areas for wave (2), I will need to consider much bearish short and mid-term count being in place.
Important notice: Elliot waves and fibonacci retracements are a very subjective form of analysis and I don't personally trade out of them. I use them only for the purpose of gauging structural potential of any assets, that allows me to put more confidence when low-risk trading set-up emerges. Author's personal multi-years trading experience convinced him that analysis and opinion doesn't pay, only price pays and that one shall not ever argue with price.

WAVES/USDT bullish horizons? 👀 🚀 WAVES Today Analysis💎Paradisers, turn your focus to WAVESUSDT! We've observed it positioning itself within a demand zone, hinting at a potential bullish ascent.
💎 A few days ago, WAVES broke free from its descending trendline, charting an upward trajectory. After facing rejection from an overhead resistance, it's now revisiting the trendline, which currently serves as a support. Given its current stance in the demand zone, we're confident that a resistance retest might be on the horizon.
💎 However, should the demand zone be compromised, anticipate a bullish continuation from the 1.447 support level. A breach below this could trigger a more pronounced downward shift.
💎 Remember to employ prudent trading strategies and use proper stop-loss measures! Stay alert to market movements and look forward to more insights!

WAVES/USDTNot a financial advice, please do your own research
1D timeframe
Buy zones - 1.50$ - 1.54$
Stop loss - 1.48$(if we start making lower lows/change of trend)
Targets:
- 1.67$
- 1.85$

US30 BULLISH ELLIOT BREAKDOWNLooking back from Wednesday 15 of March, 2023, the wave 3 kicked off after wave 2 has completed its 3 waves movement. Wave 3 which carries 5 sub-waves along side submerged. Sub-waves 1, 2 and 3 are done, going for the fourth wave which carries 3 waves (ABC waves). However, from 4H timeframe, we can see a Zig-zag correction occurring which goes with 5-3-5 formation. Wave 4 is almost done, from there we can witness the last wave of 5. let's see what the lunch from NASDAQ:AAPL will bring about on the 15th of September.
Stay tuned for updates from this breakdown.
WAVE 1 = 5 WAVES
WAVE 2 = 3 WAVES
WAVE 3 = 5 WAVES
WAVE 4 = 3 WAVES
WAVE 5 = 5 WAVES
WAVE A = 5 WAVES
WAVE B = 3 WAVES
WAVE C = 5 WAVES

WAVES showing a very impressive investment opportunityHi Everyone;
today we have one of the best risk to reward Investment opportunity
it is more than 2370 times the risk and the chart is look very promising.
I expect breaking the previous bear market key point will clear the way to the final target

NZDJPY LAST WAVE DROPNZDJPY has been bearish since early July but started the trend with a possible leading diagonal which comprises of 5 waves and 3 sub-waves to it. Considering the diagram above, we are done with the waves 1, 2, 3, and 4 going for the completion of the last wave (wave 5). Wave A and B are done and price also going for wave C after which we can witness a big correction.
For now, lets see ow it plays out with a target of 410 pips from breakout.
WAVE 1 = 5 WAVES
WAVE 2 = 3 WAVES
WAVE 3 = 5 WAVES
WAVE 4 = 3 WAVES
WAVE 5 = 5 WAVES

WAVES showing a very impressive investment opportunity Hi Everyone;
today we have one of the best risk to reward Investment opportunity
it is more than 1990 times the risk and the chart is look very promising.
I expect breaking the previous bear market key point will clear the way to the final target

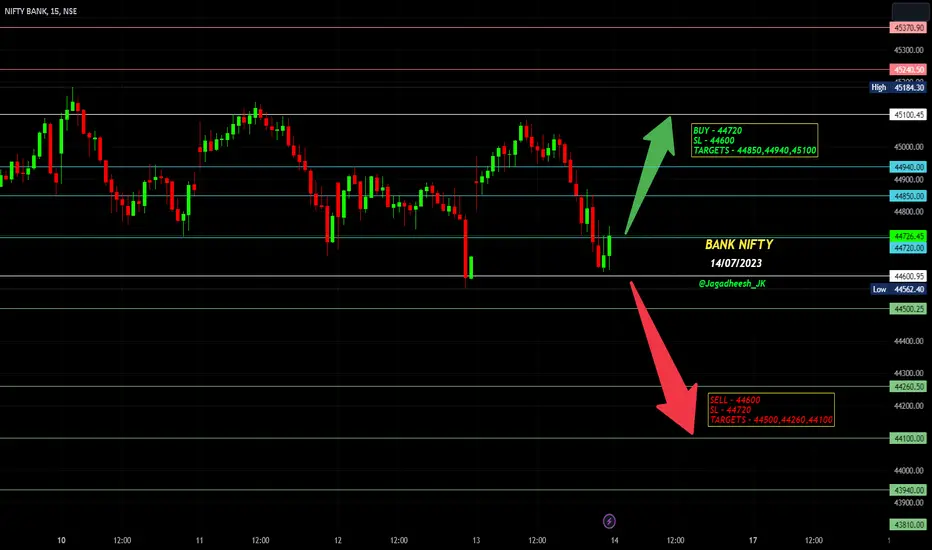
BANK NIFTY ANALYSIS FOR 14/07/2023BUY ABOVE - 44720
SL - 44600
TARGETS - 44850,44940,45100
SELL BELOW - 44600
SL - 44720
TARGETS - 44500,44260,44100
Still I'm Suffering with some Health Issues guys... I'm not well 💉🩸
Disclaimer - All information on this page is for educational purposes only,
we are not SEBI Registered, Please consult a SEBI registered financial advisor for your financial matters before investing And taking any decision. We are not responsible for any profit/loss you made.
I'm not well guys 🫀💉🩸So I'm not sure about Updating the market moment in the live market.... If possible I'll update at that time
If you like my levels then keep this levels into your Charts & Follow the levels Strictly
HAPPY TRADING GUYS
ETHUSD Waves Analysis Bearish
Impulse wave up that finished on 11th November 2021. Followed by an ABC correction.
Where wave (A) finished and we now either in correction (B) or we started the wave C of the correction.
So even though we can count this minor abc correction in wave (B). it does not mean it is finished. Waves B can take the form of complex corrections wxy.
So how do we know if wave (B) intermediate it is finished if it crosses the paralel channel make it official wave (C).
Supporting indicators
RSI -turning down below 50
MACD - Turning below centre line
Targets going forward
1. Target nr 1 $1400 region if it bounces back correction might not be over yet wave (B)
2. Target nr 2 $874 end of wave 5 of (A)
3. Target nr 3 price target $ 458 -480 region based on symmetrical channel and a few Fibonacci Ratios.

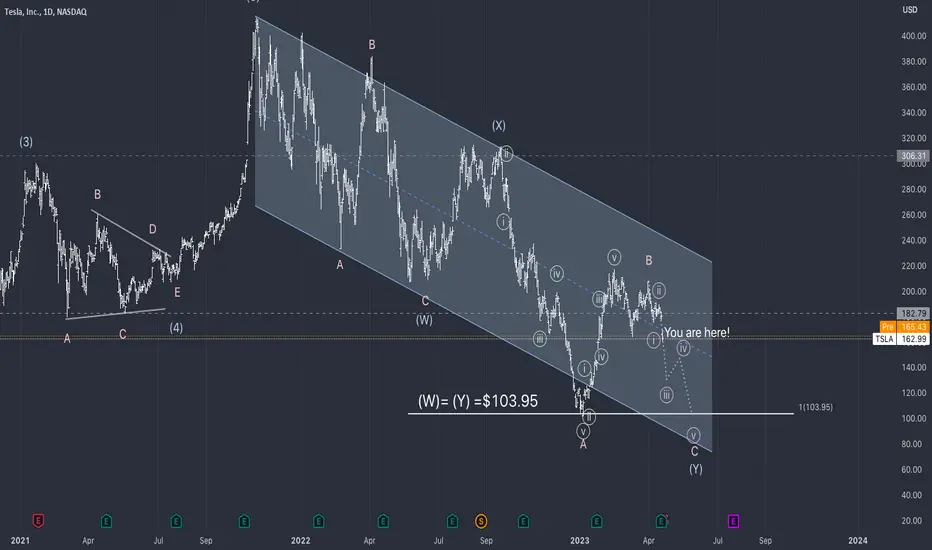
TSLA going to January Lows
TSLA - Elliott Wave Analysis
There maybe more dramatic Waves out there for Tesla. But for me I had this count since April last year so I am gonna stick with it.
I see a WXY correction. And we are now in minute wave iii of minor wave C of intermediate wave (Y).
Foron this WXY pattern the most common Fibonacci ratio is equality between W= Y. In our case equality is around 103.95
We also have natural graph support around 103 from the previous low in January our wave A of (Y).
What are your thoughts on TSLA ?
Legal Disclaimer: The information presented in this analysis is solely for informational and educational purpose and does not serve as financial advice.
EURX SELL PROJECTION (LAST DROP)The market is currently in a complex correction which carries or bears three wave structure (WXY waves). As we see, wave X is about to be completed on only if the red line gets broken below. The last wave which is the wave Y is set to carry three sub waves with the 5-3-5 formation of its sub waves.
COMPLEX CORRECTION - WXY
WAVE W - 5 WAVES
WAVE X - 3 WAVES OR TRAINGLE
WAVE Y - 3 WAVES

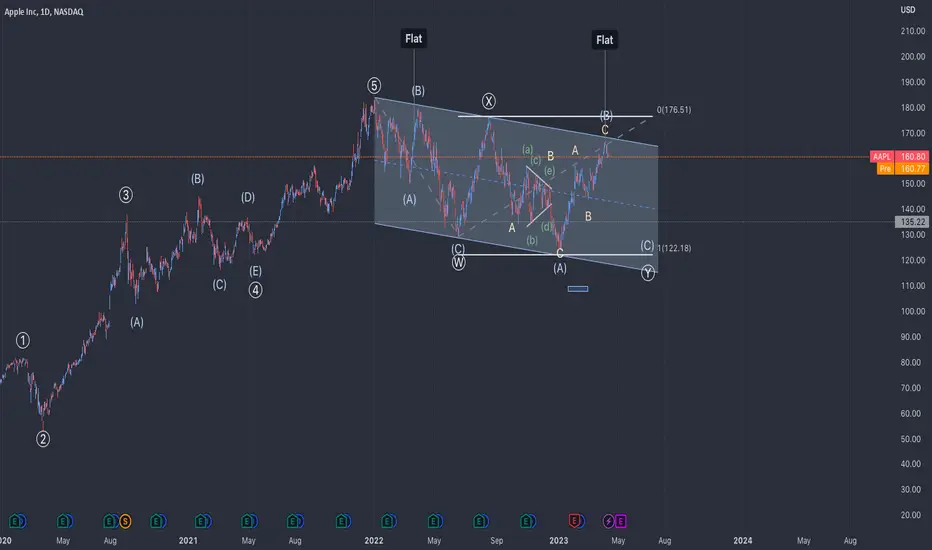
AAPL last leg of correction - DownAAPL -Elliott Waves Analysis
We are in a double flat complex correction WXY. with Wave (C) of primary Wave Y still to unfold. If this is correct Wave (C) of Y will unfold in an impulse wave down (5 minor waves down)
Fibonacci:
Waves W = Wave y = 122
What do you think?
Legal Disclaimer: The information presented in this analysis is solely for informational purposes and does not serve as financial advice.
BUY WAVES/BTC to go to the moonNothing to say about waves in bitcoin pair, the chart says it all. Currently all the way down to support , high potential to the upside, buy and hold for a amazing ride.

Waves 2023catching the vibe is thought to be a thing of the past but it seems not, catch this wave to the moon around 2025. bullish divergence looks frothty
