EUR Longs to 1.12700FOMC today is going to be the catalyst for this move today. We could get some spike down first though, so be careful on this. But overall the structure is tell me that his move is going to happen!
Wavetheory

@Scalper618 on instaHi Traders hope everyone is well, Just thought id share my own thoughts on GBPUSD. I really like the REPLAY TOOL tradingview has i practice all the time (These are my own thoughts trade at own risk)

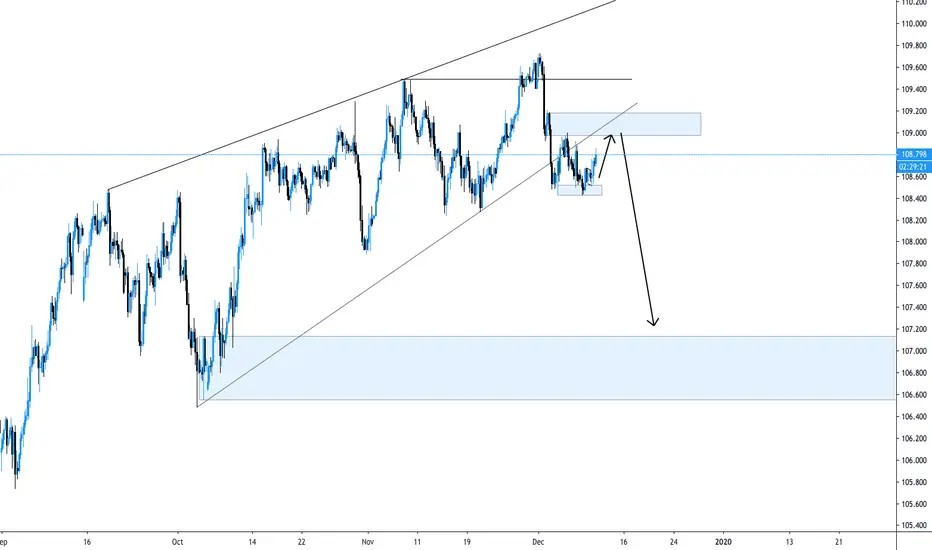
USDJPY Short ForecastLooking like UJ is coming down in the near future. Waiting on price to move up to the 109 level to see how it reacts. If we see some manipulation around here, we could be seeing some excellent shorts upcoming
NZDUSD: Early Asia Session Sees Triangle BreakoutHi Traders,
Price respected key resistance at 0.6436 during the Friday session, thereby forming a barrier triangle. The Asian session has now given us the breakout we've been waiting for. We can keep buying every pullback until we reach the target at 0.65542.
Have a good one!

COPPER - RF Copper looks interesting for some bearish action this week then after one leg down we could start looking for buy setup (purple)

USDCAD OutlookHey guys/gals!
So we caught UCAD from the very low and it's been evolving as anticipated. Hope you all got in. Now we're almost finished the daily structure - I still think there are a couple weeks left before the downside, but definitely a good time to set alerts up at the 1.3400 level so you don't miss this short.

USOIL Short ForecastOil is looking excellent for shorts for the upcoming week. I'll post when I get an entry confirmation, but follow your entry strategy & ride this thing down to around $48.


USDCHF: Wave alternation key in understanding current correctionIn wave analysis, the guideline of alternation warns to always expect a difference in the next expression of a similar wave. Although alternation does not say precisely what is going to happen, it gives valuable notice of what not to expect and is therefore useful to keep in mind when assessing future probabilities. So we can expect anyone on the corrections that Elliot identified. Even a triangle is possible. I would advise not taking a long position until price reaches an area suitable enough to start selling.

no more longs on AUDUSD until inevitable correction.we've achieved a 3 wave uptrend that began from the first of October. now we are yet once again in an overbought position and any new longs should be taken with precaution if not avoided altogether. I believe for this upcoming week we will see a dip in AUDUSD or probably a new downtrend.

Divergence on the Dow: Indication for end of diagonal sequenceWe're currently seeing an ending diagonal on the Dow, and this is the same pattern we're seeing on the Nasdaq and S&P 500. In wave analysis, it is an unwritten rule that we must see divergence between waves 3 and 5 in an ending diagonal sequence. I'm looking for price to make one more up before we begin the downtrend.

Expecting a retracement and then a rally.I am expecting to see a reversal and a retracement on GBPCHF as indicated in blue on the chart above. I will be trading the retracement and will then be looking for a reversal confirmation in order to complete wave 4 to the upside on the weekly time frame.
Happy trading!
Linton White
JP Markets
South Africa

A Fly - B Retrace - C Fly for AU? AUDUSD
If price follow this ABC pattern, and if B leg already ended, then price going to fly. Conservative target: Retest of A.
Invalid if the structure broke lower.
Entry:
Buy limit @ the right shoulder @ 0.6780
SL @ 0.6750
TP @ 0.6900
TAYOR

Is Crypto Waiting for VanEck Bitcoin ETF Before Take-Off? (EW)Follow my twitter: @Intuit_Trading
Neely-Elliott Wave is suggesting that BTCUSD is in wave-E of a contracting triangle with reverse alternation or wave-B of a new advance, and will remain in a neutral environment for the next 6 weeks. The EW time target aligns perfectly with the potential October 18th approval of the VanEck BTC ETF. This ETF in particular has a very high chance of approval because of one big reason - precedent. VanEck has brought to market many original complex financial exchange traded products - they're the good ol' boys.
On a more fundamental basis, the VanEck ETF is the first one that is based on an OTC exchange index, rather than a retail exchange index. There is a lot of precedent for regulated OTC indexes, whereas there is absolutely no precedent for a retail crypto exchange index, which is the main reason why every previous ETF has been rejected. The SEC can't "prevent manipulation" (ie, manipulate the market themselves) on retail crypto exchanges, they can however do so on regulated OTC exchanges that compose the VanEck index. There is also precedent for ETFs composed of significantly more volatile assets than BTC. I think that by switching to an OTC index instead of a retail index, VanEck will have successfully courted the SEC into allowing this ETF to pass. However, until it's official the market will remain neutral. Also after the BTC ETF is approved, it will set a precedent and we will soon see ETFs for every other major crypto being released on the retail market.
Neely River Theory suggests that the best way to play this market environment is to buy bull call option spreads, long DEC19 10000 calls and short DEC19 11000 calls. This bullish vertical spread strategy allows for safer profits to be generated while the market remains range bound with a slight upward bias. Roll into new calls if trade value goes up 60% or price goes above 12000, and exit if value goes down 20-30%. (Warning: Experimental)

GBPAUDGBPAUD Continue it's bullish move as it moves out of the triangle.
The distance traveled by each subsequent wave reduces in length.
This has the effect of contracting the range of the wave, hence the name!
A low risk trade can be placed at the end of wave 'e' with the idea of catching the market as it turns back into the trend.


AUDCAD buy set up... Wave Analysis... Anticipating a break of the 4h trend to complete the 4h 123 correction. (Anticipating the 2nd impulse up of this correction ).


Daily view on USDCAD... Wave analysisShort-mid term view on USDCAD.
Anticipating a daily impulse up to complete the 123 correction. Could reach the .618 fib level.
Forecasting a bigger move to the downside to complete the bigger running flat structure.

XAGUSD, short term sell... Wave analysisHere is my view on XAG...
I forecast we could see more downisde incoming to retest the lower levels... We could see some more downside to simply complete the 1,2,3 correction, before going to break the last daily high ! It also broke the lower timeframe upside trend... But also, be aware that it could make a 1,2,3,4,5 correction before the sort term drop.
Short term sell... LONG Term : VERY BULLISH
Let me know what you think ! I am just a beginner so EVERY insight and chart shared is appreciated, Thank you !!!


