Hellena | EUR/USD (4H): LONG to the resistance area 1.11613.Colleagues, the price is in the correction of wave “2”. I believe that the upward five-wave impulse is not yet complete. In any case, I think that the price will still reach the maximum of wave “1” at 1.11613.
The question is how far will the correction of wave “2” go or is it over? There is no way to know for sure, so I don't recommend selling. I think we should stick to long positions.
Manage your capital correctly and competently! Only enter trades based on reliable patterns!
Wavetheory

US yeilds in a corrective rebound In analysis from a few weeks back, we talked about bearish USD and presented a bearish outlook. Since then dollar fall nicely and one of the reason are also lower US yields.
Looking at US yeilds I see bearish impulsive price action down from 4.8%, which could keep the US dollar in a downtrend. What we’ve seen so far is a strong rebound from 3.8%, as shown on the updated 4-hour chart. This rebound suggests that yields are stepping into a correction now, which could unfold as an A-B-C structure. So, it looks like we could see a bit more upside in the near term before US yields turn back to the downside. At the same time, this could mean the US dollar may find some support soon or remain in consolidation a bit longer.
GH

Hellena | GOLD (4H): LONG to resistance lvl 3100 (wave B).Colleagues, at this point I have redrawn the waves a bit and realized that the upward movement is not over yet, but a rather large correction is possible within waves “ABC” and if wave ‘A’ is finished or almost finished, I expect wave “B”. I believe that the price will reach the level of 3100. After that a reversal and continuation of a small downward movement is possible.
But for now I would look at long positions.
Manage your capital correctly and competently! Only enter trades based on reliable patterns!

Bitcoin Long Term Projection ModelAn evolving projection on BITCOIN. Using time and experience in the market as well as Elliot Wave methods this is my projection of the market.

Crypto Market at Critical Crossroads: Is History Repeating?Maybe an altcoin season seems too luxurious for us investors right now.
The TOTAL market cap is currently at a critical point, showing price action similar to past cycles.
Previously, we had COVID as our black swan event - could today's equivalent be a trade war?
We're probably approaching the final wave before the market truly enters a downtrend. It's crucial now to stay alert and prepare carefully.
Everything the US is currently doing—including tariffs—serves one goal: shrinking their huge federal debt load, absorbing wealth from other global economies, and keeping gold prices in check. This gives the FED more room to reduce interest rates and reignite growth.
Eventually, global markets always rebalance. Governments typically respond by printing more money to ease the pain, and historically, that's positive news for BINANCE:BTCUSD
Cheap money policies always return; it's just a matter of when.
Your job now is straightforward:
- Be patient
- Stay flexible
- Maintain solid cash reserves
Remain calm, stay sharp, and be ready for opportunities.
#BTC #FED #TotalMarketCap #CryptoTrading #TechnicalAnalysis #CryptoVeteran #TheCryptoFire

Hellena | GOLD (4H): SHORT to 38.2% Fibo lvl 3050.Dear colleagues, the price has been in an upward movement for quite a long time and I believe .that it is time for a correction in the “2” wave.
I think it is possible that there may be a small update of the maximum of the top of wave “1” to 3176.771, then I expect a correction to the area of 38.2% Fibonacci level 3050.
As usual there are 2 possible entry options:
1) Market entry
2) Entry by pending limit orders, if the price updates the maximum.
Manage your capital correctly and competently! Only enter trades based on reliable patterns!

Hellena | Oil (4H): SHORT to support area 65.268.We need to talk about one important nuance. Many people ask “Hellena, you say you can't buy oil, but it's going up. Well, it is, yes. But all my data and wave markings suggest that the price will soon start a downward movement. There are major changes in geopolitics and I am not in a position to stop them. I just set a stoploss and wait for the trade that will bring me profit.
Now coming to the forecast, I think that the downward movement will start soon, but before it, the price may rise quite high, maybe even to the area of 74.000.
But the main direction is the support area of 65.268.
There are 2 possible ways to enter the trade:
1) Entry at market price.
2) Limit pending sell orders if the price starts an upward movement to the area of 74.484.
Manage your capital correctly and competently! Only enter trades based on reliable patterns!

Hellena | EUR/USD (4H): LONG to the resistance area 1.09484.Dear colleagues, the upward impulse of the five-wave movement is not over yet, and at the moment we see the end of the correction of wave “4”.
I believe that the price can still slightly update the low and reach the area of 1.07232 , but the priority is the upward movement in wave “5”, so I expect the price to reach the resistance area of 1.09484.
Manage your capital correctly and competently! Only enter trades based on reliable patterns!

Hellena | SPX500 (4H): LONG to resistance area of 5788.8.Dear colleagues, I am still counting on an upward movement. It seems that the sellers have not lost their strength yet and I see that an update of the low in the area of 5445 is possible. Then I expect a resumption of the upward movement with a target to reach the 5788.8 area.
As usual there are 2 possible entry options:
1) Market entry
2) Entry by pending limit orders if the price starts a small downward movement.
Manage your capital correctly and competently! Only enter trades based on reliable patterns!

Hellena | GOLD (4H): LONG to resistance area 3100.Wave “3” is still continuing its progression. This means that the five-wave impulse is not over yet and we expect the upward movement to continue.
Of course I would like to see wave “4” as a corrective wave in the area of 3024 level, then I expect an upward movement to the area of 3100 level. This level is also considered to be quite strong, from which there could be a correction.
Manage your capital correctly and competently! Only enter trades based on reliable patterns!

DODGE - Short - This is how to read the short using Lesson 15Lesson 15 Methodology:
1. Fib 61.8 (sellers might come in on this level)
2. Highest up volume wave after a while (probable sellers inside)
3. Anchor AWVAP at the beginning of the up volume wave. Wait for price to cross downward and then pull back.
4. Highest down volume wave after a long time (sellers)
5. Price respects AVWAP acting as resistance
6. Enter Short on one more confirmation of weakness - Plutus Short signal PS
...and down we go!!!
Enjoy!

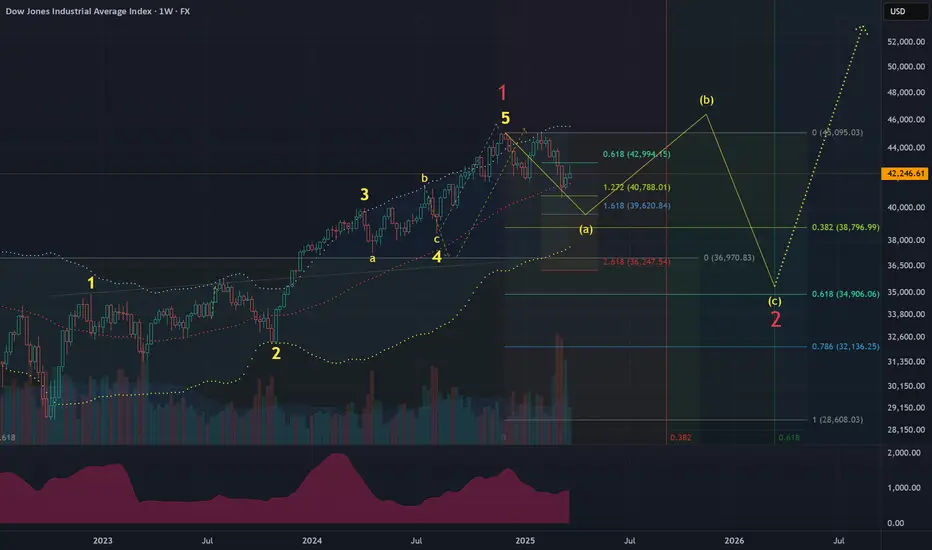
DJI US stock market forecast 2025-2026Assumption:
oct-22 — nov-24 (1-2-3-4-5) wave is over.
correction (a)-(b)-(c) is expected.
likely structure is a 3 wave regular flat.
Time:
the correction is expected to last until at least sep-25.
Price:
it's too early to predict final price for wave (c).
anticipated range is 35000-39000.
wave (a) shall reach 39600.
Long term waves:
Major uptrend lasts 25 years.
Major correcting downtrend lasts 9 years.
Next major downtrend is expected to start in 2033-2034.
Hellena | GOLD (4H): LONG to resistance area 3075.Colleagues, I believe that price will reach the 3075 area, completing an upward five-wave impulse. Earlier I talked about the level of 3100 and I believe that it will be reached too, just a little later and after a correction.
In any case, within the wave “3” of the senior order, gold is waiting for an upward movement, because the big impulse is not completed yet.
Manage your capital correctly and competently! Only enter trades based on reliable patterns!

Hellena | SPX500 (4H): LONG to resistance area of 5830.Colleagues, the previous forecast is not canceled, but I decided to update it a bit in the form of a new forecast. I have set the target a little closer, so that I don't have to wait too long.
I believe that the price will continue its upward movement and will reach the area of 5830. It is quite possible that the price will correct to the area of 5597, completing the wave “2” of small order.
Manage your capital correctly and competently! Only enter trades based on reliable patterns!

Hellena | Oil (4H): SHORT to the area of 65.268.Colleagues, I believe that the downward movement is not over yet, and now the price is in a complex combined correction. The second correction also consists of “ABC” waves.
In an ideal scenario, the price completes wave “C” in the 70.000 area and starts the downward movement to the support area of 65.268.
In general, the plan has not changed since the last forecast, but the bulls still have strength, so we should take the upward movement as an opportunity to profitably go short.
Manage your capital correctly and competently! Only enter trades based on reliable patterns!

Hellena | EUR/USD (4H): SHORT to the support area at 1.07279.Dear colleagues, price is still in an uptrend, but wave “5” is often unpredictable, so I do not recommend buying.
I will look out for short positions. I believe that the price can renew the high and reach the area of 1.10000 or even a little higher, but I will place pending limit orders to sell.
Or the price will immediately start a downward movement.
The target is the support area at 1.07279.
Manage your capital correctly and competently! Only enter trades based on reliable patterns!

Hellena | GOLD (4H): LONG to 161.8% Fibo lvl area at 3038.Dear colleagues, I believe that the upward movement is not over yet. The bulls have gained strength and the upward five-wave movement is not over yet!
I expect that the wave “3” of senior and middle order is not yet complete. Possible correction to the area of 2955.837, then I expect an upward movement to the area of 161.8% Fibonacci extension 3038.730.
As usual - the upward movement is in priority, so I do not recommend short positions, but I recommend long limit pending orders.
Manage your capital correctly and competently! Only enter trades based on reliable patterns!

Hellena | Oil (4H): SHORT to the area of 64.00 (Wave C).Colleagues, at the moment we see a situation where it is difficult to determine the end of the movement. Wave “C” is not completed and I believe that we should expect the continuation of the downward movement. I do not set distant targets, so I expect the price to reach the area of 64.00.
A correction to the area of 67.884 shift is possible.
Manage your capital correctly and competently! Only enter trades based on reliable patterns!

Hellena | GOLD (4H): LONG to resistance area at 2955 (Wave 3).As in the last forecast - I insist that the five-wave movement is not over yet. Therefore, I believe that the price will reach at least the resistance area at 2955.837.
The correction wave “2” is either already completed or will be completed soon.
Manage your capital correctly and competently! Only enter trades based on reliable patterns!

Hellena | EUR/USD (4H): LONG to the area of 1.08878.Colleagues, I'm going to make a new forecast that will be a little different from the last one. In the past, the price quickly reached the target, but I still expect a correction in wave “4” to the 1.06966 area to open profitable long positions. The target will still be the same 1.8978 area.
Manage your capital correctly and competently! Only enter trades based on reliable patterns!

Hellena | GOLD (4H): LONG to resistance area 2955 (Wave 3).Dear Colleagues, after Trump's statements and the general political situation, the price went sharply into a downward movement, but this does not mean that I give up the upward movement.
At the moment I think that wave “2” is completing the correction and soon we will see the long-awaited upward movement.
I think that the price can still update the minimum of wave “2” in the area of 2833, then (or immediately) will start an upward movement in wave “3” at least to the area of the maximum of 2955 of wave “1”.
Manage your capital correctly and competently! Only enter trades based on reliable patterns!

Hellena | EUR/USD (4H): LONG to the area of 1.08878 (Wave C).Well, colleagues, it happens, wave “3” continued its rapid development. Wave “3” is usually the longest and it happens that it becomes too long on the news background, which we saw.
At the moment, I assume that the correction in wave “4” will still take place in the area of 1.06966, to then complete wave “5” at least in the area of 1.08878.
But there is another option - wave “3” is still not over. This happens often in wave analysis, so use limit orders.
Manage your capital correctly and competently! Only enter trades based on reliable patterns!

Hellena | EUR/USD (4H): SHORT support area of 1.05351.Dear Colleagues, according to the primary idea wave “C” is completing and soon I expect the beginning of the downward movement. This is a big Combined correction, so I think it is worth being especially careful with the end of waves - it can be difficult to understand where the wave will end.
In this case, I assume that wave “C” will end in the area of 1.07000 level, ending the five-wave impulse, then I expect a downward movement to the support area of 1.05351.
Manage your capital correctly and competently! Only enter trades based on reliable patterns!
