DXY MY VIEW 60 MIN TIME FRAMEThe Structure looks good to us, waiting for this instrument to correct and then give us these opportunities as shown on this instrument (Price Chart).
Note: Its my view only and its for educational purpose only. Only who has got knowledge about this strategy, will understand what to be done on this setup. its purely based on my technical analysis only (strategies). we don't focus on the short term moves, we look for only for Bullish or Bearish Impulsive moves on the setups after a good price action is formed as per the strategy. we never get into corrective moves. because it will test our patience and also it will be a bullish or a bearish trap. and try trade the big moves.
we do not get into bullish or bearish traps. We anticipate and get into only big bullish or bearish moves (Impulsive Moves). Just ride the Bullish or Bearish Impulsive Move. Learn & Know the Complete Market Cycle.
Buy Low and Sell High Concept. Buy at Cheaper Price and Sell at Expensive Price.
Keep it simple, keep it Unique.
please keep your comments useful & respectful.
Thanks for your support....
Tradelikemee Academy
Wavetrading

NDTV - DAILY TIME FRAMEThe Structure looks good to us, waiting for this instrument to correct and then give us these opportunities as shown on this instrument (Price Chart).
Note: Its my view only and its for educational purpose only. Only who has got knowledge about this strategy, will understand what to be done on this setup. its purely based on my technical analysis only (strategies). we don't focus on the short term moves, we look for only for Bullish or Bearish Impulsive moves on the setups after a good price action is formed as per the strategy. we never get into corrective moves. because it will test our patience and also it will be a bullish or a bearish trap. and try trade the big moves.
we do not get into bullish or bearish traps. We anticipate and get into only big bullish or bearish moves (Impulsive Moves). Just ride the Bullish or Bearish Impulsive Move. Learn & Know the Complete Market Cycle.
Buy Low and Sell High Concept. Buy at Cheaper Price and Sell at Expensive Price.
Keep it simple, keep it Unique.
please keep your comments useful & respectful.
Thanks for your support....
Tradelikemee Academy

KALYAN CAPITAL 240 MINS TIME FRAME BULLISH SETUPThe Structure looks good to us, waiting for this instrument to correct and then give us these opportunities as shown on this instrument (Price Chart).
Note: Its my view only and its for educational purpose only. Only who has got knowledge about this strategy, will understand what to be done on this setup. its purely based on my technical analysis only (strategies). we don't focus on the short term moves, we look for only for Bullish or Bearish Impulsive moves on the setups after a good price action is formed as per the strategy. we never get into corrective moves. because it will test our patience and also it will be a bullish or a bearish trap. and try trade the big moves.
we do not get into bullish or bearish traps. We anticipate and get into only big bullish or bearish moves (Impulsive Moves). Just ride the Bullish or Bearish Impulsive Move. Learn & Know the Complete Market Cycle.
Buy Low and Sell High Concept. Buy at Cheaper Price and Sell at Expensive Price.
Keep it simple, keep it Unique.
please keep your comments useful & respectful.
Thanks for your support....
Tradelikemee Academy

KPR MILL LTD - 240 MINS LTD The Structure looks good to us, waiting for this instrument to correct and then give us these opportunities as shown on this instrument (Price Chart).
Note: Its my view only and its for educational purpose only. Only who has got knowledge about this strategy, will understand what to be done on this setup. its purely based on my technical analysis only (strategies). we don't focus on the short term moves, we look for only for Bullish or Bearish Impulsive moves on the setups after a good price action is formed as per the strategy. we never get into corrective moves. because it will test our patience and also it will be a bullish or a bearish trap. and try trade the big moves.
we do not get into bullish or bearish traps. We anticipate and get into only big bullish or bearish moves (Impulsive Moves). Just ride the Bullish or Bearish Impulsive Move. Learn & Know the Complete Market Cycle.
Buy Low and Sell High Concept. Buy at Cheaper Price and Sell at Expensive Price.
Keep it simple, keep it Unique.
please keep your comments useful & respectful.
Thanks for your support....
Tradelikemee Academy

GBPCHF - 240 MINS TIME FRAME The Structure looks good to us, waiting for this instrument to correct and then give us these opportunities as shown on this instrument (Price Chart).
Note: Its my view only and its for educational purpose only. Only who has got knowledge about this strategy, will understand what to be done on this setup. its purely based on my technical analysis only (strategies). we don't focus on the short term moves, we look for only for Bullish or Bearish Impulsive moves on the setups after a good price action is formed as per the strategy. we never get into corrective moves. because it will test our patience and also it will be a bullish or a bearish trap. and try trade the big moves.
we do not get into bullish or bearish traps. We anticipate and get into only big bullish or bearish moves (Impulsive Moves). Just ride the Bullish or Bearish Impulsive Move. Learn & Know the Complete Market Cycle.
Buy Low and Sell High Concept. Buy at Cheaper Price and Sell at Expensive Price.
Keep it simple, keep it Unique.
please keep your comments useful & respectful.
Thanks for your support....
Tradelikemee Academy

USDCAD 30 MINS TIME FRAMEThe Structure looks good to us, waiting for this instrument to correct and then give us these opportunities as shown on this instrument (Price Chart).
Note: Its my view only and its for educational purpose only. Only who has got knowledge about this strategy, will understand what to be done on this setup. its purely based on my technical analysis only (strategies). we don't focus on the short term moves, we look for only for Bullish or Bearish Impulsive moves on the setups after a good price action is formed as per the strategy. we never get into corrective moves. because it will test our patience and also it will be a bullish or a bearish trap. and try trade the big moves.
we do not get into bullish or bearish traps. We anticipate and get into only big bullish or bearish moves (Impulsive Moves). Just ride the Bullish or Bearish Impulsive Move. Learn & Know the Complete Market Cycle.
Buy Low and Sell High Concept. Buy at Cheaper Price and Sell at Expensive Price.
Keep it simple, keep it Unique.
please keep your comments useful & respectful.
Thanks for your support....
Tradelikemee Academy

CADCHF 240 MINS TIME FRAMEThe Structure looks good to us, waiting for this instrument to correct and then give us these opportunities as shown on this instrument (Price Chart).
Note: Its my view only and its for educational purpose only. Only who has got knowledge about this strategy, will understand what to be done on this setup. its purely based on my technical analysis only (strategies). we don't focus on the short term moves, we look for only for Bullish or Bearish Impulsive moves on the setups after a good price action is formed as per the strategy. we never get into corrective moves. because it will test our patience and also it will be a bullish or a bearish trap. and try trade the big moves.
we do not get into bullish or bearish traps. We anticipate and get into only big bullish or bearish moves (Impulsive Moves). Just ride the Bullish or Bearish Impulsive Move. Learn & Know the Complete Market Cycle.
Buy Low and Sell High Concept. Buy at Cheaper Price and Sell at Expensive Price.
Keep it simple, keep it Unique.
please keep your comments useful & respectful.
Thanks for your support....
Tradelikemee Academy

USDCAD WEEKLY TIME FRAME The Structure looks good to us, waiting for this instrument to correct and then give us these opportunities as shown on this instrument (Price Chart).
Note: Its my view only and its for educational purpose only. Only who has got knowledge about this strategy, will understand what to be done on this setup. its purely based on my technical analysis only (strategies). we don't focus on the short term moves, we look for only for Bullish or Bearish Impulsive moves on the setups after a good price action is formed as per the strategy. we never get into corrective moves. because it will test our patience and also it will be a bullish or a bearish trap. and try trade the big moves.
we do not get into bullish or bearish traps. We anticipate and get into only big bullish or bearish moves (Impulsive Moves). Just ride the Bullish or Bearish Impulsive Move. Learn & Know the Complete Market Cycle.
Buy Low and Sell High Concept. Buy at Cheaper Price and Sell at Expensive Price.
Keep it simple, keep it Unique.
please keep your comments useful & respectful.
Thanks for your support....
Tradelikemee Academy

MRF - 240 MINS CHART TIMEFRAMEThe Structure looks good to us, waiting for this instrument to correct and then give us these opportunities as shown on this instrument (Price Chart).
Note: Its my view only and its for educational purpose only. Only who has got knowledge about this strategy, will understand what to be done on this setup. its purely based on my technical analysis only (strategies). we don't focus on the short term moves, we look for only for Bullish or Bearish Impulsive moves on the setups after a good price action is formed as per the strategy. we never get into corrective moves. because it will test our patience and also it will be a bullish or a bearish trap. and try trade the big moves.
we do not get into bullish or bearish traps. We anticipate and get into only big bullish or bearish moves (Impulsive Moves). Just ride the Bullish or Bearish Impulsive Move. Learn & Know the Complete Market Cycle.
Buy Low and Sell High Concept. Buy at Cheaper Price and Sell at Expensive Price.
Keep it simple, keep it Unique.
please keep your comments useful & respectful.
Thanks for your support....
Tradelikemee Academy

RASHTRIYA CHEMICALS DAILY TIME FRAMEThe Structure looks good to us, waiting for this instrument to correct and then give us these opportunities as shown on this instrument (Price Chart).
Note: Its my view only and its for educational purpose only. Only who has got knowledge about this strategy, will understand what to be done on this setup. its purely based on my technical analysis only (strategies). we don't focus on the short term moves, we look for only for Bullish or Bearish Impulsive moves on the setups after a good price action is formed as per the strategy. we never get into corrective moves. because it will test our patience and also it will be a bullish or a bearish trap. and try trade the big moves.
we do not get into bullish or bearish traps. We anticipate and get into only big bullish or bearish moves (Impulsive Moves). Just ride the Bullish or Bearish Impulsive Move. Learn & Know the Complete Market Cycle.
Buy Low and Sell High Concept. Buy at Cheaper Price and Sell at Expensive Price.
Keep it simple, keep it Unique.
please keep your comments useful & respectful.
Thanks for your support....
Tradelikemee Academy

NZDCAD - Watch For ReversalNZDCAD is currently In wave B correction and approaching the 50 fibonacci alongside the channel support. We are expecting a bounce off the channel and then break of the red trendline for confirmation.
Trade Idea:
- Watch for bounce off fibonacci/channel
- Confirmation on break of red trendline
- Stops go below the lows after the breakout occurs
- Targets: 0.86 (380pips), 0.88 (580pips), Hold small position for swing
Goodluck and as always, trade safe!

NZDUSD - Watch For The Next Drop!NZDUSD is currently in major wave 2, which appears to be a WXY wave. Wave W was a Flat correction and Wave X was a simple ABC correction. We are now in wave Y and expecting a 535 zigzag.
We are currently seeing the first 5 wave move lower and expecting a 3 wave pullback before seeing another 5 wave move lower.
Trade Idea:
- Watch for a 3 wave pullback (correction)
- Enter on break of the correction
- Price shouldn't go above the invalidation level = stoploss placement
- Targets: 0.61 (250pips), 0.596 (350pips)
See below for our last 2 NZDUSD analysis which played out really well!
Goodluck and as always, trade safe!

NzdUsd moving up on Retracement!What I see!
Looking for Impulse Up.
NzdUsd will start to move up soon on Retracement. Make sure you have your own rules on RR and follow them. This is just a trading idea to help you/ give better knowledge. If you have any question ask me in comments.
Learn & Earn!

NEAR READY TO PUMPConsidering the wave of candles and the market situation, I expect a temporary return to the top.

BITCOIN SWING LONGOn the monthly time frame, the DTD is current bullish. Currently, we are at the last bullish impulse wave which is wave 5 which contains five waves (12345 waves). With a breakout and a retracement as a confirmation, I can actually, comfortably look for buys targeting 120000.00 price level as 161.8% fibs target also.

XAUUSD GOLD Elliott Wave AnlysisThe Gold Commodity has been moving in the Impulse pattern in the weekly timeframe.Now he gold is in the Wave 4 Double three pattern W-X-Y which will complete around 1670 and 1575 usd levels.After the end of his wave 4 correction the gold will move into a big wave 5 impulse target above 2200 usd as shown in the chart levels.

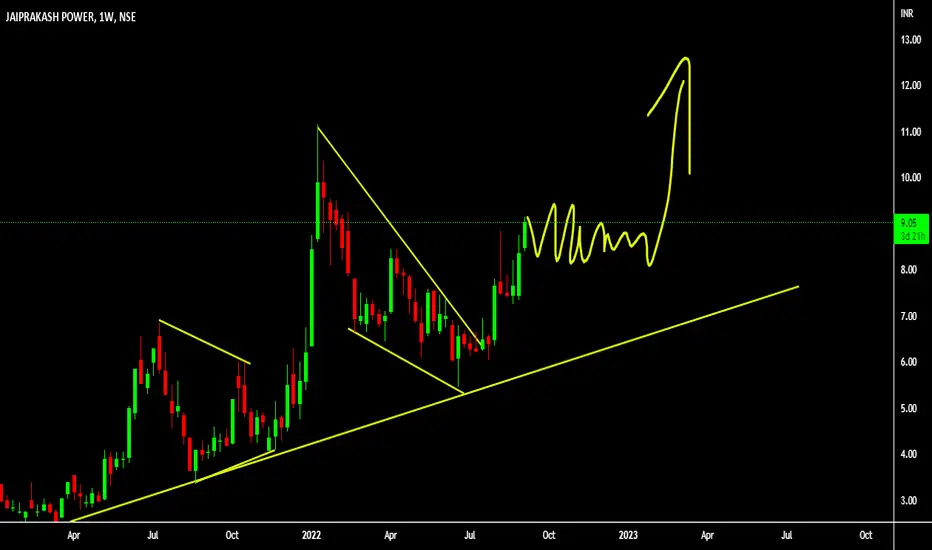
JP POWER WEEKLY TIME FRAMEThe Structure looks good to us, waiting for this instrument to correct and then give us these opportunities as shown on this instrument (Price Chart).
Note: its my view only and its for educational purpose only. only who has got knowledge about this strategy, will understand what to be done on this setup. its purely based on my technical analysis only (strategies). we don't focus on the short term moves, we look for only for Bullish or Bearish Impulsive moves on the setups after a good price action is formed as per the strategy. we never get into corrective moves. because it will test our patience and also it will be a bullish or a bearish trap. and try trade the big moves.
we do not get into bullish or bearish traps. we anticipate and get into only big bullish or bearish moves (Impulsive moves).
Just ride the bullish or bearish impulsive move. Learn & Know the Complete Market Cycle.
buy low and sell high concept. buy at cheaper price and sell at expensive price.
Keep it simple, keep it Unique.
please keep your comments useful & respectful.
Thanks for your support....
USDJPY ELLIOT PRICE ACTION BREAKDOWNFrom my own perspective, it portrays to me like we're in a correction phase. I mean, a general rectangular correction wave looking at the bigger picture on a monthly timeframe. Currently, we are in primary wave of wave C in micro wave of wave 4 and wave 3 got completed making a 78.6% retracement from the all time high. Moreover, wave 4 just go started which contains 3 waves i.e. ABC wave correction after making or attaining a 50.0% fibs level, expect price to push up to the overall time high. Then, from there we can look for selling opportunities to the down side.
lets watch and see how the market plays out.
TIPS:
WAVE A = 3 WAVES
WAVE B = 3 WAVES
WAVE C = 5 WAVES

NZDJPY - Plan For The Year ✨Our last NZDJPY analysis was invalidated and did not get triggered for entry. Since then, we went back to the drawing board and realised that we're still within Wave 5. Wave 5 is made up of 5 subwaves and we are currently on the 4th subwave, which is an ABC correction. We are now trading the C leg of this correction.
SHORT Trade Idea:
- Watch for rejection of fibonacci
- Enter on trendline break with stops above the recent highs
- Targets: 80 (550pips), 78.6 (700pips)
LONG Trade Idea:
- Watch for the ABC correction to complete above the wave 4 invalidation level (blue structure)
- Once bullish price action appears, enter with stops below the lows
- Targets: 85 (700pips), 87.3 (900pips) 89 (1050pips)
See below for lower timeframe analysis.
Break of orange trendline = risk entry
Break of red trendline = safe entry
Gooduck and as always, trade safe!

AUDJPY BREAKDOWN Price is at subminuette wave 4 which carries 3 waves as a corrective wave of wave 5 as the whole impulse wave. Do know that price is still at wave C as a correction phase and at wave 5 as the impulse phase.
Tips
Motive wave = 5 waves (12345)
Corrective wave = 3 waves (ABC)

VET - MUST SEE.VET is in an ABC correction and Wave C turned into a complex Zigzag correction which is 5-3-5.
We are currently on the final 5th wave formation and seeing subwave 4. We are expecting one more drop for the final 5th subwave of the entire 5-3-5 zigzag correction.
As subwave 1 was extended, we can expect the 5th wave to be equal or shorter than the 3rd wave, which gives us a clear level to watch for price to stay above once the 5th subwave starts. This is because wave 3 cannot be the shortest.
Trade Idea:
- Once the final 5th subwave starts, measure the length of the third wave and use it as invalidation level for buys
- buy when bullish price action appears
- Targets: 0.17, 0.28, 0.35, 0.45
What do you guys think?
Goodluck and as always, trade safe!

What is your idea about wavesusdt in short-term?WAVES/USDT
Sell , SHORT
Lev: 3x_5x_7x
Entry price:11.29_12.10
targets for sell :
TP 1:11.19
TP 2: 11.11
TP 3: 11.03
TP 4 :10.93
Stop loss:12.25

AUDNZD - Dropping VERY Soon! Following on from our last post on AUDNZD, price pushed a bit higher and it appears we're in a descending channel and approaching the upper limits of the channel. We are anticipating NZD strength soon which would help push AUDNZD lower.
Trade Idea:
- Watch for rejection of the descending channel resistance and 78.6 fibonacci
- enter when there's rejection
- stops above the channel
- gradually take profits with final profit being the double bottom (500pips)
Goodluck and as always, trade safe!
