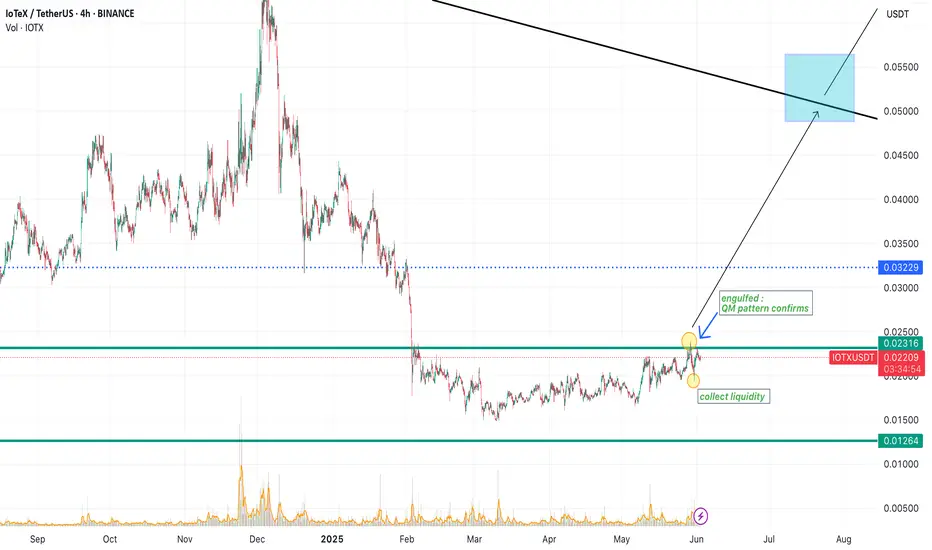
IOTXUSDT🚀 IoTeX (IOTX): A Hidden Gem for Short-Term Gains & Long-Term Growth?
Looking for a crypto project with real-world utility and strong upside potential? IoTeX (IOTX)—a decentralized platform powering the Internet of Things (IoT)—might be worth your attention.
Why IoTeX?
✔ Innovation Meets IoT: Combines blockchain + IoT for secure, privacy-focused machine-to-machine (M2M) ecosystems.
✔ Partnerships & Adoption: Backed by industry giants (like Samsung) and used in real-world applications (smart devices, DePIN).
✔ Price Potential: Volatility offers short-term trading opportunities, while long-term growth aligns with IoT’s explosive expansion (projected $2.4T market by 2029).
📌 Short-Term: Watch for bullish trends amid crypto market rebounds and project updates.
📌 Long-Term: HODL potential as IoT adoption grows and IoTeX cements its niche.
Web3
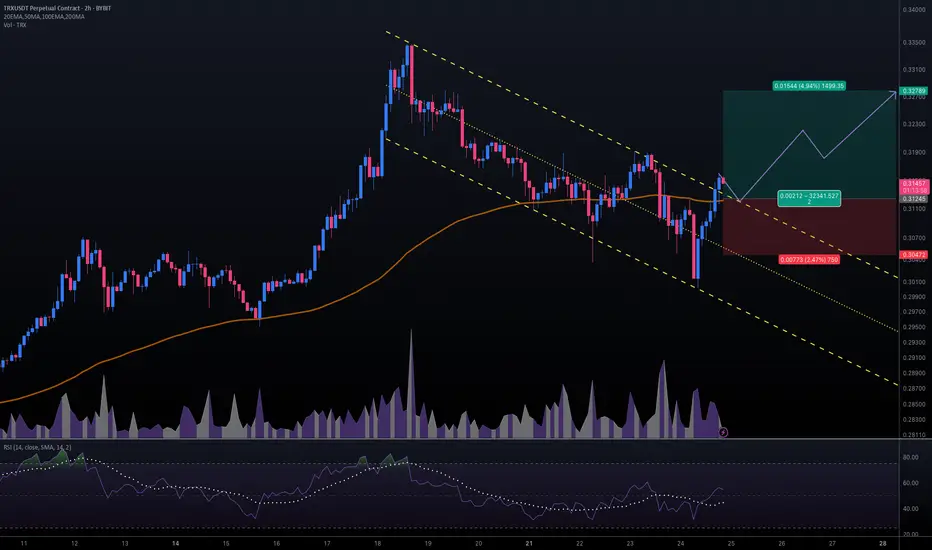
#TRXUSDT #2h (ByBit) Descending channel breakout and retestTron just regained 100EMA support and seems ready for bullish continuation after a pullback to it.
⚡️⚡️ #TRX/USDT ⚡️⚡️
Exchanges: ByBit USDT
Signal Type: Regular (Long)
Leverage: Isolated (16.0X)
Amount: 5.1%
Entry Targets:
1) 0.31245
Take-Profit Targets:
1) 0.32789
Stop Targets:
1) 0.30472
Published By: @Zblaba
CRYPTOCAP:TRX BYBIT:TRXUSDT.P #2h #TRON #DPoS #L1 #Web3 trondao.org tron.network
Risk/Reward= 1:2.0
Expected Profit= +79.1%
Possible Loss= -39.6%
REI/USDT CYCLE UPDATE $0,90 by 2025 - Price prediction📈 REI/USDT CYCLE UPDATE – $0.90 by 2025
REI could break above its old ATH, targeting $0.90 in the upcoming cycle. Why?
Upcoming
✅ Ultra-fast blockchain (⏱️ 1.5s block time)
✅ Gas-free or near-zero fees – perfect for DeFi, NFTs & gaming
✅ EVM-compatible – easy migration for Ethereum dApps
✅ Low market cap → high upside potential
✅ Clean tokenomics with staking + resource model
✅ Built for speed, scale & adoption
DATA
Data shows that there is a structural trend going on, where this coin can break soon.
If the altcoin market heats up, REI has the fundamentals & tech edge to explode past previous highs. 🚀
🧠 Watch this one closely.
#REINetwork #Crypto #Altseason #EVM #PricePrediction #Web3
This is not trading advice, but a view from a side of study.

GRT Short Term BullishOverall this crypto is very weak. Most alts are weak, with few exceptions. The Graph has actually been non-stop building even though the coin has bled out for 4+ years. I doubt the long-term trend is bullish, but on the short term, it looks like a standard head and shoulders pattern on the 1-hour. On the 4-hour we have a golden cross - although every other time frame is so bearish.
I started buying some on the left shoulder while it fell in the target zone; I loaded the trade fully on 40x leverage after the right shoulder completed and broker through the zone of resistance.
Looking to see a break of $0.13, which is the top of the head pattern. If we see blow off top in crypto, it should break through decisively over the next 30 days and we could see low .20s
Anything is possible but I may be out of this trade by the time you read this. Not Financial Advice. Probably completely random nonsense.

CLV Clover FinanceIf we do see a bank less world these interoperable plays could be trusts/less providers.
I do believe we will see the world financial system change dramatically in this lifetime and sooner than later.
I've decided today to toss $1,000 into CLV and if it hits that's cool and if it does not.... It does not.
I will roll half my position into LTC if this does giga pump.
THIS IS NOT FINANCIAL ADVICE!!!

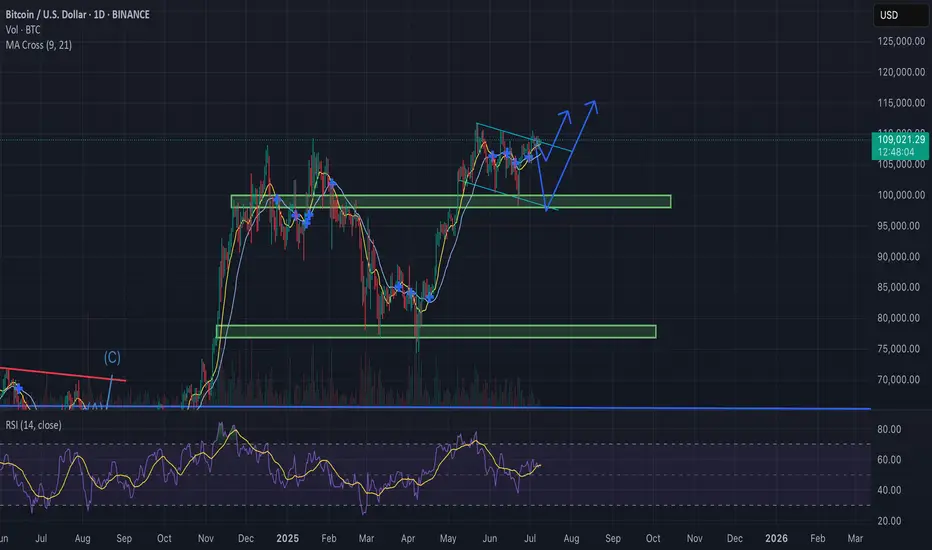
Bitcoin Update – Bullish Falling Wedge in Play?BTC/USD is currently trading near $108.8K, compressing within a falling wedge formation — historically a bullish continuation pattern, especially after a strong uptrend.
Why the Bias Remains Bullish:
Bullish MA Cross: Short-term MAs (9/21) are aligned for upside momentum.
Falling Wedge: Price compressing with lower highs and lows, coiling for a breakout.
RSI Strength: RSI (purple) remains elevated, supporting continued upside pressure.
Fundamental Catalysts:
Trump delays trade war announcements, reducing global uncertainty.
FOMC meeting in late July: Trump pushes for rate cuts, potentially bullish for risk assets like BTC.
If BTC breaks out above the wedge resistance with convincing volume:
Retest likely at ~$110K
Targets : $115K → $120K+
TradeCityPro | WLD Builds Pressure Inside Long-Term Range👋 Welcome to TradeCity Pro!
In this analysis, I want to review the WLD coin for you. It’s one of the Privacy and Identity coins with a market cap of $1.5 billion, ranked 55 on CoinMarketCap.
⏳ 4-Hour Timeframe
In the 4-hour timeframe, a ranging box has formed for this coin between the 0.855 and 0.969 zones, and it’s been fluctuating within this range for several weeks.
📊 Volume is gradually decreasing within this box, which could indicate that a move is approaching.
⚡️ For now, we can say the volume slightly favors buyers, as the green candles have more volume than the red ones. Additionally, the size and strength of the green candles are greater, which increases the likelihood of the box breaking upward.
📈 If the price moves up toward the 0.969 zone with increased volume, we can enter a long position upon breaking 0.969.
✔️ Alternatively, if the price is supported at the 0.855 bottom, we could also open a long position—but it’s riskier, and in my opinion, not worth it. It’s better to wait for the main trigger to activate.
🔽 For a short position, if the price forms a lower high below 0.969 and then moves toward 0.855, we can open a short if 0.855 breaks. The next support zone would be 0.795.
📝 Final Thoughts
This analysis reflects our opinions and is not financial advice.
Share your thoughts in the comments, and don’t forget to share this analysis with your friends! ❤️

#RLCUSDT #1D (Binance Futures) Descending wedge on supportiExec RLC just printed a dragonfly doji which may have marked the bottom on daily.
A morning star is drawing now, recovery towards 100EMA resistance seems around the corner.
⚡️⚡️ #RLC/USDT ⚡️⚡️
Exchanges: Binance Futures
Signal Type: Regular (Long)
Leverage: Isolated (4.0X)
Amount: 5.9%
Current Price:
0.9126
Entry Targets:
1) 0.9002
Take-Profit Targets:
1) 1.1854
Stop Targets:
1) 0.7859
Published By: @Zblaba
GETTEX:RLC BINANCE:RLCUSDT.P #DePIN #AI #iExec iex.ec
Risk/Reward= 1:2.5
Expected Profit= +126.7%
Possible Loss= -50.8%
Estimated Gaintime= 1 month

Hut 8 Corp (HUT) From Miner to Digital Infrastructure PowerhouseCompany Overview:
Hut 8 NASDAQ:HUT is transforming into a next-gen digital infrastructure leader, blending Bitcoin mining, AI compute, and cloud services for diversified, long-term growth.
Key Catalysts:
Major Operational Upgrades ⛏️
79% QoQ jump in deployed hashrate and 37% fleet efficiency gain in Q1 2025.
Positions HUT for cost-effective BTC production as crypto markets rebound.
Massive Bitcoin Reserves ₿
10,264 BTC on balance sheet (~$847M as of Mar 31, 2025).
Acts as a digital asset custodian + infrastructure operator, offering leveraged upside to BTC.
Diversification into Compute & AI Infrastructure 🧠
Q1 Digital Infrastructure + Compute revenue tops $21M.
Reduces mining dependency and captures tailwinds from AI and HPC demand.
Investment Outlook:
Bullish Case: We remain bullish on HUT above $15.00–$16.00.
Upside Target: $30.00–$32.00, driven by crypto exposure, AI-driven growth, and operational scaling.
⚙️ Hut 8 – Mining the Future of Digital Infrastructure.
#HUT #Bitcoin #CryptoMining #DigitalInfrastructure #AICompute #HPC #Web3 #BTCExposure

TradeCityPro | HNT: Testing Resistance in DePIN Uptrend Structur👋 Welcome to TradeCity Pro!
In this analysis, I’ll review the HNT coin. The Helium project is a U.S.-based Web3 and DePIN initiative.
✔️ This coin has a market cap of $9.26 million and is ranked 97th on CoinMarketCap.
⏳ 4-Hour Timeframe
On the 4-hour chart, HNT has an ascending trendline with a resistance zone near 4.372.
💥 If this resistance is broken, the main upward move may begin, and a breakout above this level confirms a bullish trend for HNT.
📈 So for a long position, you can enter on the breakout or a pullback to this zone. The next resistance level is 5.333.
🔽 For a bearish scenario, the ascending trendline must be broken first to signal a potential reversal. A break below 3.971 would be the first confirmation of that trendline break and can be used as a short trigger.
⚡️ The main short trigger would be a break of 3.642, which could push the price down toward 3.245.
🧩 The RSI oscillator is currently sitting on the 42.91 support; a breakdown here would confirm bearish momentum for a short setup.
📝 Final Thoughts
This analysis reflects our opinions and is not financial advice.
Share your thoughts in the comments, and don’t forget to share this analysis with your friends! ❤️

Reploy (RAI) – Web3 x AI Revenue-Earning Project with 61x UpsideReploy (RAI) is a rapidly emerging project at the intersection of Web3 and artificial intelligence, designed to streamline how developers build, deploy, and monetize AI agents across blockchains. Unlike many speculative tokens, Reploy stands out for one critical reason: it already earns real revenue.
According to Reploy.ai, the platform offers a no-code/low-code experience that allows anyone to launch custom AI agents and integrate them into DeFi protocols, gaming environments, and decentralized applications. Their architecture combines an on-chain identity layer with decentralized agent hosting, positioning RAI as core infrastructure for the next evolution of intelligent Web3 tools.
The project is still under the radar, trading well below $2, but the fundamentals support a much larger valuation. My 12–18 month price target is $105, which represents a 61x increase from today’s levels. This forecast is based on:
Early revenue traction from agent deployment and API integrations
Strong market tailwinds for decentralized AI applications
Platform stickiness due to unique agent monetization tools and developer incentives
Token utility driving recurring demand (staking, gas, and access control)
RAI isn’t just another AI narrative coin, it's building real infrastructure, already being used, and gaining traction. As adoption grows and more AI agents are hosted through the protocol, the value capture for RAI token holders could be exponential.
Price Target: $105
Current Price: ~$1.72 (as of May 2025)
Upside Potential: +6,000%

Why Ethereum Could 10x in the Next Few Years🚀
1. Ethereum ETF Approval
ETFs are approved in the U.S. (similar to the Bitcoin ETFs in early 2024), institutional money will flood in.
Grayscale, BlackRock, and others have already filed.
Ethereum’s price jumped significantly after similar events in the past.
2. Deflationary Supply (Post-EIP-1559)
Since EIP-1559, ETH has been burned with every transaction.
Combined with Proof-of-Stake (The Merge), ETH is now net deflationary during periods of high network activity.
3. Layer 2 Ecosystem Is Exploding
Rollups (Arbitrum, Optimism, Base, zkSync) are scaling Ethereum.
These L2s settle on Ethereum L1, driving fees and activity.
Vitalik’s "rollup-centric roadmap" is playing out — this benefits ETH long-term.
4. Real Yield from Staking
Ethereum now offers a real, sustainable yield from staking (~3–5%).
Institutions love yield. ETH becomes more like a productive asset, not just a speculative token.
5. Ethereum as the Base Layer of Web3
DeFi, NFTs, gaming, DAOs — Ethereum is still the dominant smart contract platform.
The most secure, battle-tested, and widely adopted chain.
Developers and enterprises continue to build on Ethereum over competitors.
6. Macro Tailwinds
As the U.S. moves toward looser monetary policy, risk assets (including crypto) historically benefit.
Crypto adoption is growing globally — from Latin America to Asia — and Ethereum is often the entry point.

TradeCityPro | FET: AI Token Eyes Breakout After Sharp Rebound👋 Welcome to TradeCity Pro!
In this analysis, I’m going to review the FET coin for you. This project is one of the top AI-related projects in the crypto category.
💫 With a market cap of $1.8 billion, it currently ranks 48th on CoinMarketCap.
📅 Weekly Timeframe
In the previous analysis, I mentioned that if the ascending trendline in this timeframe is broken, the price would make a higher high beyond 3.099, and with the activation of the trendline trigger, we could confirm a trend reversal in this timeframe.
✔️ As you can see, that scenario has played out. After breaking the trendline and the 0.382 Fibonacci level, the price dropped sharply down to the 0.786 level.
✨ The price reaction at this level was very quick, and after hitting this zone, it gained bullish momentum again with a bullish engulfing candle and has now reached the 0.797 area.
📈 If the 0.797 level breaks, the price could experience another sharp upward move. The next resistance levels are 1.095, 2.068, and 3.099 — with 1.095 overlapping with the 0.382 Fibonacci level.
📊 The main confirmation of trend reversal will be given by forming a higher high and higher low above the 0.797 level — confirming Dow Theory.
🔽 For a bearish continuation, the confirmation comes with a break of the 0.786 Fibonacci level. The main support levels are 0.185 and 0.058.
📅 Daily Timeframe
In the daily timeframe, we can better see the details of this bullish move. As observed, the price has had a sharp leg up from the 0.379 bottom to 0.791 without any real correction.
🧩 Given the strength of the 0.791 resistance, a correction is more likely here. If the price moves upward without correction, it’s usually not a good sign for trend sustainability. A healthy trend includes corrections.
🎲 However, if 0.791 breaks and RSI enters the Overbought zone, the price could continue rising toward the 1.128 resistance. While this might not be ideal for trend health, the risk-to-reward ratio makes opening a position worthwhile.
🛒 In my opinion, a correction followed by a new bullish wave would be a more ideal setup, increasing the chances of a breakout. Breaking this level could be a strong trigger for both spot buying and futures positions.
📉 For a bearish scenario, we need to wait for the price reaction to 0.791 and then enter after confirmation of trend reversal. Lower-level triggers would be the breaks of 0.567, 0.455, and 0.379.
📝 Final Thoughts
This analysis reflects our opinions and is not financial advice.
Share your thoughts in the comments, and don’t forget to share this analysis with your friends! ❤️

TradeCityPro | ICP: Breakout Watch in Web3 Veteran’s Price Range👋 Welcome to TradeCity Pro!
In this analysis, I’m going to review the ICP coin for you. The Internet Computer project is one of the older projects in the crypto space, focused on Web3 and gaming.
⚡️ The coin currently has a market cap of $2.65 billion, placing it at rank 36 on CoinMarketCap.
⏳ 4-Hour Timeframe
As you can see in the 4-hour timeframe, a range box has formed between the levels of 4.648 and 5.239, and the price has currently reached the top of the range.
✔️ During this upward leg from the bottom of the box, market volume has been increasing, which indicates that the probability of breaking through 5.239 is high.
🔍 If 5.239 is broken, we can enter a long position. The next resistance levels are at 5.558 and 6.313.
✨ There’s also a larger range box between 4.648 and 6.313, and as long as the price stays above 4.648, we can say that this broader range is valid and price is fluctuating within it.
📉 To open a short position, wait for the break of 4.648. The momentum in higher timeframes for this coin is bearish, so if this level breaks, the trend may continue downward with another leg to the downside.
📊 For that to happen, selling volume must increase, so that when 4.648 breaks, there is no volume divergence, ensuring a healthy continuation of the trend.
📝 Final Thoughts
This analysis reflects our opinions and is not financial advice.
Share your thoughts in the comments, and don’t forget to share this analysis with your friends! ❤️

TradeCityPro | WLD: Waiting for Reversal in Altman’s Web3 Coin👋 Welcome to TradeCity Pro!
In this analysis, I want to review the WLD coin for you. This project is one of the notable Web3 and Identity projects, founded by Sam Altman, who is also the CEO of OpenAI — and that adds a layer of trust to the project.
🔍 Currently, this coin has a market cap of $984 million, placing it at rank 64 on CoinMarketCap.
📅 Daily Time Frame
As you can see in the daily time frame, the price has dropped significantly since the previous analysis. After breaking below the 1.349 level, the main bearish leg began, and the price fell to the 0.603 area.
🧩 Currently, the price is in a correction phase, moving slowly upward on low volume, and has broken above the SMA25, now trading above this moving average.
🎲 Keep in mind: even though the price is above the SMA25, the slope of the moving average is still downward, which indicates that bearish momentum is still present in the market. However, since the price is now above the SMA, bearish strength is weakening.
📈 To confirm a bullish reversal for WLD, the key trigger right now is the breakout of the 0.947 level. If the price stabilizes above this level, we can say the trend has shifted to bullish.
✔️ A sooner confirmation of the trend change would be a positive slope on the SMA25 combined with increasing volume and green candles — this would be an early sign of a reversal.
🛒 For spot buying, the first trigger is the break of 0.947, and if the price holds above that, the bullish trend could begin.
🔽 The next resistance levels — which could act as targets or secondary buy triggers — are at 1.349 and 2.5776 respectively.
📊 If you already hold this coin and are looking to set a stop-loss, a break and confirmation below 0.603 would be a good level to activate your stop.
📝 Final Thoughts
This analysis reflects our opinions and is not financial advice.
Share your thoughts in the comments, and don’t forget to share this analysis with your friends! ❤️

TradeCityPro | EOS Retraces Gains: Key Levels to Watch Now👋 Welcome to TradeCity Pro!
In this analysis, I’m going to review the EOS coin for you. This is one of the American-based projects operating in the Web3 space, currently ranked 63 on CoinMarketCap with a market cap of $970 million.
⌛️ 4-Hour Timeframe
On the 4-hour timeframe, as you can see, the price formed a bullish move after breaking through the 0.5997 level, which continued up to the 0.8604 zone before entering a correction phase.
🔍 After being rejected from the 0.8604 top, the price experienced a significant decline and has now returned to the 0.5997 level, fully retracing all of its previous bullish waves.
📈 For a long position, you can enter on a breakout above 0.6338. If the price stabilizes above this zone, it could move upward toward the 0.8064 level.
🔽 For a short position, you can enter if 0.5997 is broken, and the next bearish leg could potentially extend to 0.5433.
📝 Final Thoughts
This analysis reflects our opinions and is not financial advice.
Share your thoughts in the comments, and don’t forget to share this analysis with your friends! ❤️

TradeCityPro | AR: Key Triggers in Web3 Storage Coin’s Downtrend👋 Welcome to TradeCity Pro!
In this analysis, I want to review the AR coin for you. This project is one of the Storage and Web3 platforms, and the coin of this project, with a market cap of $352 million, is ranked 124th on CoinMarketCap.
⏳ 4-Hour Time Frame
In the 4-hour time frame, as you can see, this coin is in a downtrend, and in its latest leg, after being rejected from the 7.70 top, it started to drop, and this decline continued down to the 4.78 zone.
✔️ Currently, the price has retraced to the 0.382 Fibonacci level and has created a range box between 4.78 and 5.65. A break of this box can determine the trend of this coin for the coming days or even weeks.
✨ The SMA99 indicator has so far acted well as a dynamic resistance, and within the current box, the price has already reacted to it once and is now again pulling back to this moving average.
💥 If the price is rejected from this indicator and forms a lower high than 5.65, the probability of breaking the 4.78 bottom increases significantly, and the price could move toward lower lows.
⚡️ The 4.78 support is actually a support range between 4.78 and 4.92, and to confirm a bearish move, the risky trigger is 4.92, and the main trigger is 4.78.
🔼 For a long position or spot buy, we should first wait for the SMA99 to break and for the 5.65 zone to activate. The break of this zone would be the first confirmation of a trend reversal, and the main confirmation would come after the price makes a higher low and higher high above the 5.65 zone.
🎲 The main resistance levels above this area are the 0.5, 0.618, and 0.786 Fibonacci levels. Another key resistance is the 7.70 zone.
📝 Final Thoughts
This analysis reflects our opinions and is not financial advice.
Share your thoughts in the comments, and don’t forget to share this analysis with your friends! ❤️

Trading opportunity for TELUSDTBased on technical factors there is a Buy position in :
📊 TELUSDT
🔵 Buy Now
🪫Stop loss 0.004400
🔋Target 0.006600
📏 R/R 2
💸RISK : 1%
We hope it is profitable for you ❤️
Please support our activity with your likes👍 and comments📝

Trading opportunity for TELUSDTBased on technical factors there is a Buy position in :
📊 TELUSDT
🔵 Buy Now
🪫Stop loss 0.004500
🔋Target 0.006200
📏 R/R 1,7
💸RISK : 1%
We hope it is profitable for you ❤️
Please support our activity with your likes👍 and comments📝

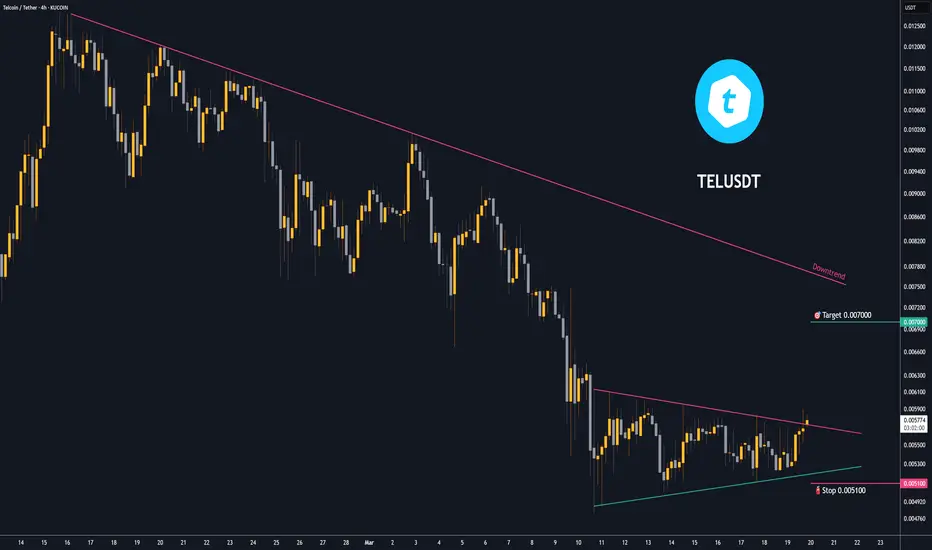
Trading opportunity for TELUSDTBased on technical factors there is a Buy position in :
📊 TELUSDT
🔵 Buy Now
🪫Stop loss 0.005100
🔋Target 0.007000
📏 R/R 2
💸RISK : 1%
We hope it is profitable for you ❤️
Please support our activity with your likes👍 and comments📝
Fundamental Analysis on MultiversX (EGLD | from $20 to $3,180?Fun experiment on crypto fundamental analysis —
I asked Grok 3 AI to evaluate MultiversX (EGLD) [ CRYPTOCAP:EGLD ].
It was a long conversation with interesting outputs.
MultiversX received an 8/10 score.
For Grok, it's a top pick for building apps and for mid to long-term investing.
I shared the complete results and logic in my account on 𝕏 ( vinibarbosabr ).
You can find it at highlights , if you want.
The conclusion is that, per Grok, CRYPTOCAP:EGLD could hit:
Medium term (1 to 5 years):
$10 billion to $30 billion market cap @ $318 to $955.
Long term (5 to 10 years):
$50 billion to $100 billion mcap @ $1,590 to $3,180.
Now, let's dive into the analysis!
In summary, Grok evaluated a list of objective and well-documented MultiversX attributes, giving it a score 8 out of 10. The AI said EGLD does not make a good short-term buy, due to poor price action at around $500 million of capitalization, while saying it is a top-pick for mid and long term fundamental investing eyeing a $100 billion market cap.
From a tech perspective, Grok 3 agrees MultiversX is one of the most advanced blockchains to date. When asked if it would have MultiversX among its AI top picks to build a project, the answer was yes.
First, Grok 3, one of the most advanced AI models to date, evaluated eight categories of blockchain fundamental analysis. MultiversX scored 7.875 on average, with the AI rounding it up to 8 out of 10 points.
Scalability got a 9/10 score, considering the fully implemented sharding technology, transactions per second (TPS) capacity, and performance. With 30,000 current TPS on mainnet, a 263,000 TPS achieved on a testnet, and a theoretical capacity superior to 1 million TPS thanks to its adaptive sharding—increasing with demand—MultiversX is one of the most scalable blockchain networks.
Decentralization got an 8/10 score, showing strong decentralization, but with room for improvements. The network has over 5,500 nodes, of which, 3,200 are active validators, losing only to Ethereum (ETH). Notably, MultiversX has a Nakamoto Coefficient of 9 for liveness, meaning nine entities have over 33% of all the nodes.
Speed and Finality got an 8/10 score, with sub-second finality in the roadmap for 2025, currently taking 6 seconds. The improvement, according to Grok AI, would put EGLD transactions among the fastest layer-one (L1) blockchains.
Security got an 8/10 score, with its proof of stake architecture, ESDT tokens being native assets, and onchain 2FA. Yet, the model warns against possible stake accumulation above the 51% threshold as a potential risk for the future. Which is the same risk for all blockchain networks’ security.
Cost and Accessibility got a 9/10 score, due to approximately $0.002 cost per transaction, below the industry’s average. MultiversX tech stack also offers developers the possibility to offer gasless (no fees) transactions to the end user. Still in accessibility, the chain has one of the lowest hardware requirements for its capacity in the space, which also contributes to decentralization.
Developer Experience (DevX) got a 9/10 score, with a top-down focus on development and a grassroots “build” culture. MultiversX offers familiar tools like Rust framework and WebAssembly, flexibility in programming languages, and a strong open source ethos. Comprehensive documentation and an active community further support developers, making it attractive for building applications and smart contracts.
Ecosystem and Adoption got a 7/10 score, as a small ecosystem’s size and adoption relative to larger blockchains could limit its current reach and utility. Still, the ecosystem is growing, together with implementations and partnerships, having big names associated with EGLD.
Economic Model (Tokenomics) got an 8/10 score, considering a capped EGLD supply, with full distribution by 2030. Moreover, Grok AI mentions a 30% network fees going to the developer of the used smart contract, incentivizing builders.
All things considered, we asked Grok 3 AI what would be the ideal market cap for EGLD, MultiversX base token. Notably, Grok was considering a $565 million capitalization, ranked 95 in CoinMarketCap, trading around $20 per token.
Based on fundamental analysis, a comparison with other leading blockchains at higher ranks, would put MultiversX among them, Grok said. This, however, looking at the mid and long term, as the market would need time to adjust accordingly.
For the medium term (one to five years), the AI predicts EGLD could reach a market cap between $10 to $30 billion, positioning the cryptocurrency next to Cardano (ADA), Polkadot (DOT), and Avalanche (AVAX).
For the long term (five to ten years), Grok is even more bullish, siding MultiversX with Solana (SOL) and Ethereum. In this case, EGLD could reach between $50 to $100 billion market cap.
In conclusion, Grok AI agrees that MultiversX is one of “the most technically advanced blockchain today.” It has achieved a remarkable fundamental analysis score and offers an interesting investment opportunity for mid and long-term investors.
Furthermore, it features among one of the AI’s top picks of decentralized infrastructures to build applications and smart contracts.
Nevertheless, investing is risky and fundamental analyses can often be complex and highly nuanced. Investors and builders should do proper research and due diligence before making important decisions. The short-term for EGLD is also risky, as mentioned by Grok in the analysis.

(TOTAL) total crypto mcap "candles on record [history"worst red candles on record in the past four years and various progresses of positive growth measured from lowest in between points.

TradeCityPro | Deep Search: In-Depth Of LINK🔹What is Chainlink?!
🔹Chainlink is a decentralized oracle network that enables smart contracts to securely interact with real-world data, external APIs, and off-chain computations. Founded in 2017, Chainlink solves the "oracle problem" by providing tamper-proof, trust-minimized data for blockchain applications.
🔹Chainlink has become a critical infrastructure in the DeFi (Decentralized Finance) ecosystem, enabling hybrid smart contracts that leverage off-chain data. With partnerships in traditional finance, gaming, insurance, and enterprise solutions, Chainlink is positioning itself as the primary gateway between blockchains and real-world data.
🔹Chainlink’s Core Technology & Products
▪️ A. Decentralized Oracle Networks (DONs):
Chainlink’s oracle networks retrieve, verify, and deliver off-chain data to on-chain smart contracts in a secure and decentralized manner. These oracles solve blockchain’s lack of external connectivity, making real-world data accessible in DeFi, insurance, gaming, and enterprise applications.
B. Cross-Chain Communication (CCIP):
Chainlink enables cross-chain data sharing between public and private blockchains, allowing seamless communication and transfer of value across multiple networks.
▪️ C. Data Feeds & Market Insights:
Price Oracles: Secure on-chain price feeds for assets like BTC, ETH, stablecoins, and commodities.
Proof of Reserve: Verifies asset collateralization in real-time, crucial for stablecoins and wrapped assets.
Data Streams: Provides high-frequency market data for next-gen DeFi protocols.
▪️ D. Compute Services:
- Functions: Connects smart contracts to any API, enabling custom Web3 applications.
- Automation: Automates smart contracts with event-based triggers.
- Verifiable Random Function (VRF): Ensures secure randomness in gaming, NFTs, and lotteries.
🔹Chainlink’s Economic Model & Tokenomics
A. LINK Token Utility
The LINK token is the native cryptocurrency of the Chainlink ecosystem, used for:
🔹Paying node operators for retrieving, verifying, and delivering data.
🔹Staking to provide economic security and ensure data integrity.
🔹Governance and ecosystem incentives.
B. Staking & Security Mechanism:
Chainlink introduced staking as part of its Chainlink Economics 2.0 model to enhance security:
🔹Node operators must stake LINK to provide data services.
🔹Validators get slashed for incorrect or malicious data submissions.
🔹Delegated staking allows non-technical users to stake LINK via trusted operators.
C. Token Distribution
🔹ICO Price (2017): $0.11
🔹Total Supply: 1 billion LINK
🔹Circulating Supply: ~450M LINK (45% of total)
🔹Token Allocation:
-35% for ecosystem development and node incentives.
-35% sold in ICO/public sales.
-30% retained by Chainlink Labs for network growth.
D. Market Performance & ROI
🔹All-Time High (ATH) Price: $52.88 (May 2021)
🔹ICO ROI: 484.11x (+48,311%)
🔹Private Sale ROI: 587.5x (+58,650%)
🔹Total Funds Raised: $32M (ICO: $3M, Private Sale: ASX:29M )
🔹Some of Investors: Hashed Fund, Framework Ventures and Fundamental Labs
——
🔹Chainlink’s Adoption & Use Cases
A. Financial Services & DeFi
Chainlink secures billions of dollars in DeFi protocols, including:
🔹Aave (lending and borrowing)
🔹Compound (decentralized finance)
🔹Synthetix (synthetic assets)
🔹Uniswap (decentralized exchanges)
B. Asset Tokenization & Enterprise Adoption
Chainlink enables tokenization of real-world assets (RWA), integrating blockchain technology into:
🔹Traditional banking and payments
🔹Supply chain transparency
🔹Enterprise solutions (e.g., SWIFT, Google Cloud, FedEx, AccuWeather)
C. Gaming & NFTs
🔹VRF ensures fairness in blockchain gaming and NFTs.
🔹Major NFT & metaverse projects rely on Chainlink for secure randomness.
D. Insurance & Climate Markets
🔹Weather-based smart contract automation for crop insurance.
🔹Secure insurance claim processing using verified external data.
🗺Chainlink (LINK) Roadmap
Chainlink is evolving rapidly to enhance scalability, decentralization, and utility across blockchain ecosystems. The Chainlink 2.0 upgrade and Economic Model 2.0 are set to play crucial roles in the network’s future. Here’s a breakdown of Chainlink’s roadmap and upcoming developments.
A. Next-Gen Oracle Solutions
Chainlink 2.0 expands Decentralized Oracle Networks (DONs), introducing:
🔹Off-Chain Reporting (OCR) for better efficiency.
🔹Hybrid computation models for privacy and scalability.
🔹Fair Sequencing Services (FSS) to prevent front-running in DeFi.
B. Staking Expansion
🔹Staking rewards expected to start at 5% APY, paid via fees + emissions from the Chainlink treasury.
🔹Full staking implementation in Chainlink Economics 2.0 to ensure sustainable network growth.
C. Cross-Chain Integration & Layer 2 Adoption
🔹Chainlink plans deeper integration with Layer 2 solutions like Arbitrum & Optimism.
🔹Further adoption into non-EVM blockchains like Solana, Polkadot, and Cosmos.
🏦 Strategic Partnerships & Institutional Adoption
Corporate & Enterprise Partnerships: Chainlink has secured high-profile collaborations with:
-Google Cloud: Integrated Chainlink oracles for Web3 data verification.
-SWIFT: Exploring cross-border transactions using Chainlink.
-AccuWeather & FedEx: Providing real-world data for blockchain use cases.
-Associated Press: Integrating trusted news data into smart contracts.
🔹Advisory Team & Leadership
-Sergey Nazarov (CEO): Blockchain visionary, co-founder of SmartContract.com.
-Steve Ellis (CTO): Co-founder & lead engineer behind Chainlink.
-Eric Schmidt (Ex-Google CEO): Joined as technical advisor.
🔧Security & Consensus Mechanism
-Ethereum-based ERC-20 token with Proof-of-Stake (PoS) consensus.
-Delegated Proof-of-Stake (DPoS) & Proof-of-Authority (PoA) used for oracle security.
-Multi-layered decentralization ensures resilience against data manipulation.
🔹Market Outlook & Future Predictions
Competitive Edge:
-Most adopted decentralized oracle network.
-$75B+ secured across 1,000+ projects.
-Expanding beyond crypto into traditional finance & enterprise applications.
Challenges & Risks
-Reliance on Ethereum scalability.
-High competition from newer oracle solutions (e.g., --Band Protocol, API3).
-Adoption rate depends on broader DeFi growth.
👛Some of the wallets that support Chainlink
MetaMask
Ledger Wallets (Nano S & Nano X)
Exodus Wallet
WalletConnect
Rabby Wallet
Trust Wallet
Atomic Wallet
Coin98 Wallet
Trezor Wallet
Argent Wallet
—
🔹Platform for staking LINK
Stake.link
Chainlink
Stake.com
—-
Platform for providing LINK
🔹Retro
🔹Biswap
🔹Kujiro
🔹Mdex
🔹Tomb
🔹Ramses
🔹Honeyswap
🔹Uniswap
🔹Pancakeswap
🔹LFJ
🔹Pangolin
🔹Balancer
🔹Revenue and Staking
▪️ Since the beginning of February, Chainlink's revenue experienced a sharp decline followed by a notable recovery, rising from -0.015 to 0.06 Ethereum. Meanwhile, staking activity in 2025 has remained relatively stable at approximately 279,000 Ethereum, showing no significant fluctuations. Additionally, the increase in network fees highlights growing user engagement and heightened activity within the ecosystem.
🔹On-Chain Analysis of LINK
▪️ In the $18.48 to $19 price range, a significant number of LINK tokens are in loss, which could act as a resistance level. However, there is currently no substantial volume of coins in profit to establish strong on-chain support.
▪️ On a positive note, network activity is showing signs of recovery, with a rise in active and new addresses, reflecting increased user engagement. Additionally, 48% of LINK tokens are held by whales, a considerably higher percentage compared to other cryptocurrencies. This distribution makes price manipulation by whales more difficult, contributing to market stability.
▪️ From a supply and demand perspective, the recent price drop has led to increased demand from whales (addresses holding 10M–100M LINK), while retail investors have been selling. This redistribution of tokens from smaller holders to large investors could be interpreted as a bullish signal for the medium term.
✅ Now that we have reviewed the project, let's move on to the technical analysis of this coin
📅 Weekly Timeframe
As observed, after the conclusion of the 2021 bull run, LINK entered a correction phase and dropped to a low of $5.85. Upon reaching this level, it formed a very clean Accumulation Zone with a floor at $5.85 and a ceiling at $9.77.
🔍 After oscillating within this zone for about a year, LINK finally broke out towards the end of 2023, coinciding with Bitcoin’s new all-time high near $70,000. This upward move was robust, but following Bitcoin’s correction to a low of $54,000, LINK also pulled back deeply to $9.77, where it stabilized.
📊 The volume has been in favor of the buyers, and as the upward trend concluded and a corrective leg began, the volume decreased significantly. Once the volume reached its lowest, a large bullish candle entered the market, pushing the price up to a high of $30.16.
⚡️ Currently, as Bitcoin ranges and corrects, LINK is also undergoing a correction. The RSI oscillator shows that LINK has dipped below the 50 area, but as long as it remains above 42.88, I still view LINK’s momentum as bullish.
🛒 For buying opportunities, risky purchases could be considered upon confirming a break of $30.16 or a more substantial breakout at the ATH of $51.30. However, if the price heads back towards $9.77 and breaks this support, it could indicate that the bullish momentum and trend have fully concluded, potentially leading to new lows.
📅 Daily Timeframe
In the daily timeframe, let’s examine the price movement in more detail. There was an Accumulation Zone between $9.77 and $12.88. After breaking $12.88 and pulling back, the next bullish leg began, pushing the price up to $29.21—a significant resistance area where the price was rejected and entered a corrective phase.
✨ In the first corrective phase, the price moved down to the 0.382 Fibonacci level and, failing to set a new high beyond $29.21, broke lower beyond the 0.382 area. It is now at the 0.5 Fibonacci level.
🧩 Essentially, a price range box has been formed between the 0.5 and 0.382 Fibonacci levels. A break below this range could lead to further corrections, with the 0.618 Fibonacci level and the crucial $12.88 level as subsequent targets. If the price reaches $12.88, it would fully correct the entire bullish leg, signaling the end of the uptrend.
🔽 The critical trigger for entering a strong bearish momentum in this position would be a break below 34.49 in the RSI. If both this support and the 0.5 Fibonacci support are broken, it could lead to significant market panic.
👀 Conversely, if the price can rise above the 0.382 Fibonacci level and start a new bullish leg, breaking $29.21 could provide an excellent opportunity for a long position, even in spot markets.
📝 Final Thoughts
This analysis reflects our opinions and is not financial advice.
Share your thoughts in the comments, and don’t forget to share this analysis with your friends! ❤️
