Falling wedge on ADA, bullish momentum?ADA may get bullish again in the short term!
If we break the falling wedge to the upside, we can expect a price target around 3$.
That would match the technical price target of the falling wedge (top).
Wedgebreakout

NVAX wedge breakIn hindsight, great opportunity to offload Nvax on wedge break, still holding shares. looking forward to WHO approval in next few weeks

BTC - Wedge ConfirmedBreak and back test as the move to upside with the look of a short covering event. Approaching Diamond Pattern Break level, watching for resistance after the solid recoviery.

Doge is in bottom, A breakout is ahead!According to last analysis on Dogecoin now we are at the Bottom IMO and a breakout will Reassures us.
After breakout next major leg up will be started.
See my last analysis on this coin for sure.

What are Falling and Rising Wedge Patterns?What Is the Wedge Pattern and Its Common Characteristics?
1. Wedge patterns have converging trend lines that come to an apex with a distinguishable upside or downside slant.
a. Wedge with an upside slant is called a rising wedge
b. Wedge with downside slant is called falling wedge
2. It has declining volumes as the pattern progresses.
3. It breaks out from one of the trend lines.
Why We Should Pay Attention to Wedge Patterns?
Some studies suggest that a wedge pattern will breakout towards a reversal rather than a continuation more often than two-thirds of the time. Therefore as the rule of thumb, people generally treat a falling wedge as a bullish pattern and a rising wedge as a bearish pattern, especially a falling wedge would be a more reliable reversal indicator than a rising wedge.
Since we know a wedge pattern has a higher probability to reverse and due to the fact that the price of wedge pattern converges to a smaller area, we can trade the reversal set up with a relatively close stop loss to its entry price, which provides us with a good trading opportunity with a decent Risk:Reward ratio.
Examples of a Bullish Rising Wedge and Bearish Falling Wedge.
Sadly, there is nothing that works 100% in trading. Not every rising or falling wedge will reverse as one might expect. Every trader must properly manage their risk by setting stop losses and not just trading based on price patterns. Below are two examples.
Bullish Rising Wedge (ETHUSDT during 15/NOV/20 - 28/DEC/20)
In the early stages of the epic 20-21 bull market, if traders blindly treat the rising wedge as a bearish signal and trade accordingly, they would pay a heavy price.
Bearish Falling Wedge (LTCUSD during 14/AUG/18 - 14/NOV/18)
On the contrary, in the late stage of the 2018 bear market, any trader who blindly trades the falling wedge to bet on a reversal would also learn a hard lesson.
Comment down your thoughts on Ascending Triangle Pattern in the comment section.
Disclaimer:
This is just an educational post. Never trade just any pattern. And please do your research before making any trades.
Happy Trading!

Broadening Wedges - Advanced AnalysisIn our previous post in this series about chart patterns we described the characteristics, rules, and causes of triangle patterns (if you haven't seen it, see the related idea below).
In this post, we perform an advanced analysis of broadening wedges patterns. We provide a description of each pattern and its implications. We also review the literature in order to find their deterministic cause.
1. Broadening Wedges
Broadening wedges are characterized by price variations laying within one support and resistance, both having the same direction and broadening over time. As such the apex of the support/resistance in a broadening wedge is located to the left.
Broadening wedges must not be confused with other broadening formations. While they all have a broadening characteristic they can have different identification rules
Broadening wedges are classified depending on the direction of the support/resistance.
1.1 Ascending
Ascending broadening wedges mostly occur during uptrends with rising local maxima (higher highs) forming an upward sloping resistance and raising local minimas (higher lows) forming an upward slopping support. The slope of both the support & the resistance should be significantly different from 0.
Bulkowski suggests the price needs to test the support and resistance three times each. Additionally, the resistance should be steeper than the support.
Volume tends to increase during the formation of such pattern.
Ascending broadening wedges have a bearish bias with breakouts mostly occurring downward. Downward breakouts are often followed by a decrease in price.
Example of an ascending broadening wedge followed by a downward breakout on SOLUSDT 4h.
1.2 Descending
Descending broadening wedges mostly occur during downtrends with declining local maxima (lower highs) forming a downward sloping resistance and declining local minimas (lower lows) forming a downward slopping support. The slope of both the support & the resistance should be significantly different from 0.
Similarly to ascending broadening wedges, Bulkowski suggests the price needs to test the support and resistance three times each. Additionally, the support should be steeper than the resistance.
Volume tends to increase during the formation of such pattern.
Descending broadening wedges have a bullish bias with breakouts mostly occurring upward. Upward breakouts are often followed by an increase in price.
Example of an ascending broadening wedge followed by a downward breakout on AVAX 1h.
2. Partial Rises/Declines
Partial rises/declines are phenomena described by Bulkowski in broadening formations and are described as being common. Partial rises/declines often indicate the direction of a breakout.
Partial rises commonly occur in broadening ascending wedges, price bounces off the support, moves towards the resistance without reaching it, and go back to the support. We can expect a potential downward breakout after that. Note that a partial rise always starts from the test of the support.
Partial declines commonly occur in broadening descending wedges. The price bounces off the resistance, moves towards the support without reaching it, and then goes back to the resistance where we can expect a potential breakout upwards. Note that a partial decline always starts from the test of the resistance.
Partial rises and declines can offer a better price to buy/sell instead of waiting for a breakout.
3. Measure Rule
The measure rule for broadening wedges allows us to determine the position of a take-profit/stop-loss.
For a broadening ascending wedge the measure rule would place our take profit at the lowest low inside the formation. Selling directly after a partial rise would allow for higher profits.
For a broadening descending wedge the measure rule would place our take profit at the highest high inside the formation. Selling directly after a partial decline would allow for higher profits.
Certain analysts close trades caused by partial rises/declines when the price reaches the support/resistance of the wedge, opening a new position in the case of a breakout while using the metric rule for setting their take profit.
4. Causes Of Broadening Wedges
Bulkowski offers a description of the causes of broadening wedges in the market in terms of the market participant's behavior.
The cause of an ascending broadening wedge is a surge from an initial buying impulse, driving the price higher. Momentum traders follow the initial impulse further pushing prices up.
Contrarian traders judge the price to be trading above its intrinsic value, selling and thus creating a decline in prices. However, before the decline reaches the previously established low, certain market participants buy again. These participants can be composed of initial buyers, accumulating positions, or late traders seeing the potential to buy at a better price. This allows the creation of a new impulse, with only a divergence left.
This scenario eventually repeats itself with increased volume, causing impulses and retracements of higher magnitude reinforcing a positive feedback loop until the price is judged overbought even by initial buyers.
A broadening falling wedge follows the same scenario structure but with sellers instead of buyers.
5. Other Observations
The amplitude of the cyclical variations within a broadening wedge increases over time, thus potentially highlighting volatility clusters in higher time-frames.
Another interesting observation that can be made is that prices within a broadening wedge are subject to heteroscedasticity (variability is not constant, it increases inside a broadening wedge), while prices inside a channel are homoscedastic (variability remains constant). This concept is inherent to regression analysis.
6. Conclusion
In this post we described broadening wedge patterns in depth. We have highlighted partial rises/declines as well as how the measure rule applies to such patterns. We then focused on showing how market participants act during the formation of broadening wedges.
Note that unlike triangles patterns we did not find a significant amount of studies mentioning such patterns, nor any agent models developed to describe their occurrence.
7. References
(1) Bulkowski, T. N. (2021). Encyclopedia of chart patterns. John Wiley & Sons.

DYDX falling wedgeFalling wedge, indicators look like it could go up... Careful, BTC dump would most probably invalidate this... Must use stop loss. Good luck traders

+1100% TEL Descending Wedge Breakout Within Next 2 Weeks?History
KUCOIN:TELUSDT is 15 days away from pinching between the bottom and top resistance that formed on March 7, 2021, which occurred just two breakouts ago. The most recent breakout took 14 days to complete and resulted in a +1,077% gain.
Potential
If history repeats itself for a 3rd time in a row, we'd be looking at a +1,105% gain by October 10th, if TEL were to break out today.
Supportive Observations
Price action is within a descending wedge and has been knocking on the upper trendline, which is bullish.
RSI is at 42, which is the level it's been at immediately prior to numerous other breakouts.
The blue MACD line is curling up towards the signal line, and the red histogram bars are decreasing in volume, which is bullish.
Volume has been descending below the MA.
Waiting for a breakthrough and retest of the top trendline for support would be the safest time to secure a position.
The Information contained in this idea is not intended to be and does not constitute financial advice, investment advice, trading advice, or any other advice. You understand that you are using any and all Information available on or through this website at your own risk.

EURCHF LOOKING VERY BEARISHMy reasons for taking a short trade here:
1. Price has broken out of a bigger structure (an ascending channel), theres a 90% chance of it going to the bottom of structure
2. Downward trend which has created a rising wedge which is a reversal pattern
3. Price has broken out of the rising wedge
4. Downward move followed by correction which creates a bearish pennant.

EVGO - Wedge Pattern EVGO has a nice falling wedge pattern. It seems like bulls are active on this chart.

ALGOUSDT 1H broke out the wedge !!In ALGOUSDT 1h
After retested the neck line of double bottom and broke out the wedge.
TP1: 2.5574
TP2: 2.9756
TP3: 3.1447
SL: 1.6534

An interesting pattern WYNNIt is interesting how the price has formed these patterns which are exactly the opposite and result in exactly the opposite outcomes
Kinda like they are pairing themselves together?
Thought it was worth a post

MMLP Looking bullishHello Traders, Based solely on the chart MMLP looks bullish we just got out of that ascending wedge or cup and handle. Either way we have a nice little solid green volume bubble when breaking the TL we might see a retest, I'd prefer bigger volume bars though.

BTC Descending Wedge / Bull Flag - PT $51,200BTC has quite a few clear bullish things going for it.
First, the bearish three drives harmonic pattern. The green arrows marked show three attempts by sellers to cause a break downward, and three fails to cause that break. Immediately after the third, the price trends upward with consecutive straight green candles with solid volume, and that's exactly what we see here.
If you want more precedent for the above harmonic, look no further than the BTC daily from May of this year to right now. You can see almost the exact same thing happening here. A wick on the initial crash to the range low, then a series of bearish drives which failed to break down significantly below 30k. Immediately after that third bullish drive, the candles immediately gain volume we had never seen in a while, and it was shocking to see BTC's strength.
Second, the descending wedge. You can see a very clean and well defined descending wedge right after the consecutive green candles. This itself is a bullish pattern, and when you consider the support line as well as the fib support thwarting any breakdown attempts from sellers, you can see we're about to go much much higher.
Make sure to set a nice SL, somewhere around 46.5k, since you might get stopped out by those breakdown attempts.
Good luck!

Short USDCAD on break of WedgeUSDCAD is trading in wedge pattern , break of this will give us an opportunity to short with good risk reward

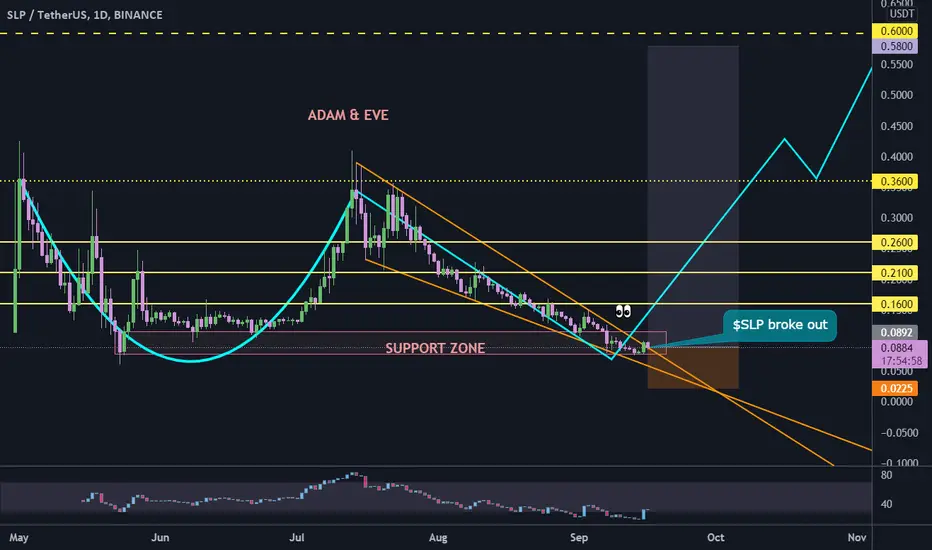
SLP broke out$SLP broke out from falling wedge and now head down to confirm broken resistance as support.
buy now.
BTC - Wedge Break with TargetThe target value is produced by measuring the largest width of the wedge and applying that distance to the break of the pattern. The target is not predictive; instead it provides a measured move to analyze the strength of the break. The pattern has been broken and back tested and BTC is forming a mini Bull Pennant. BTC has found resistance at the 2 Hour UBB, supported by the Weekly 8 EMA.

ADA is going to fall up to 2.23$!Hi dear traders,
Strong wedge was broken, A fall up to lower major support(2.23$) is expected.
Best place to buy ADA is 2.23$ zone.
Good luck


AMP Ready to Pop Soon!On the 1D chart, AMP is clearly within:
1. an ascending channel and
2. more recently, a symmetrical wedge.
As the candlesticks get closer to the tip of the wedge, strong volume is coming in, and I believe buyers will pop AMP in an upwards direction.
$0.92 - $0.95 may be a good range to take profits, as this is the range near the resistance line of the ascending channel.

Falling wedge breakout opportunityLook for BIGC to test $53-$54 before breaking to the upside to PT of $69+.

Moderna ready to break out of this huge wedgeWith the recent scare with the contaminated vials in Japan turning out to be bogus (black particles in the vial turned out to be pieces of rubber broken off from the rubber stopper on the vial when improperly inserting the needle before dosing the syringe), the stock is primed to break out of the wedge that has been forming since the early august all time high.

Big move for PSFE coming!IMO PSFE is in oversold territory and looks like it's going to breakout of a wedge on the daily and as a bonus a gap fill from $9.50 to $10.16 looks like a possibility.
