LCID rises from falling wedge on news from its rich uncleLCID got news that its rich uncle the Saudi Arabia Wealth Fund will be assisting in the
manufacturing of large body parts moving forward (perhaps on the methodology of TSLA
to just massive molds to efficiently do so and at a far lower cost). Shares pumped today on the
news. Is it sustainable? Is there still time to buy a piece of the move?
On the 120-minute chart, LCID was in a falling wedge or narrowing regression channel and
broke out also on a day when other EV stocks made good moves. The MACD indicator as
well as the dual TF RSI indicator in confirmation both show bullish momentum. The algo echo
indicator ( by LuxAlgo) which looks back in time to find matching price action patterns and
then predicts the near future move, shows a predicted move to 4.05. This is confluent with the
POC line of the volume profile anchored back to November. From November 14 to December 6,
price was range bound in consolidation around the 4.05 level. My call options for 2/16 @ $3.5
did 140% today unrealized. I will add $4.00 for 2/9 expiration and watch for the anticipated
and predicted continuation.
Wedgebreakout

AMD Continuation Wedge Bull FlagAmd continuation wedge momentum and bull flag can see NASDAQ:AMD Hit the 162/165 level in the short term this week and 180/190 level in the next few weeks. Add in NASDAQ:NVDA earnings and we could see a good pop . These are just technicals anything can invalidate them like fed actions or fed speak, tariffs, literally anything can invalidate them.

Centaurus Metals ready to rip?After declining by more than 80%, Centaurus Metals has broken out of its downtrend. While this may be the first step in a multiweek base-building process for the nickel mine developer, the chance of a v-shaped bottom makes Centaurus worthy of a speculative add following this seriously bullish price action.

DIVISLABDIVISLAB fut broke out of faling wedge or parrellel channel on an hourly charts with decent OI build up.
Risk:Reward = 1:3
Not to be missed breakout.
Could be bought with mentioned stoploss & target.

Buy EURAUD Channel Breakout The EUR/AUD pair on the M30 timeframe presents a potential buying opportunity due to a recent upward breakout from a well-defined bullish channel pattern. This breakout suggests a shift in momentum towards the upside and a higher likelihood of further gains in the coming hours.
Key Points:
Buy Entry: Consider entering a long position (buying) above the broken resistance level of the channel, ideally around 1.6300 after confirmation of the breakout. This offers an entry point close to the perceived shift in momentum.
Target Levels: Initial bullish targets lie at the previous resistance levels within the channel, now acting as potential support zones:
1.6402: This represents the first level of resistance within the channel.
1.6456: This is a further extension of the upside target, based on the height of the recent price movement before the breakout.
Stop-Loss: To manage risk, place a stop-loss order below the broken resistance line of the channel, ideally around 1.6290. This helps limit potential losses if the price unexpectedly reverses and breaks back downwards.
Thank you

Sell GBPJPY CPI DataThe GBP/JPY pair on the M30 timeframe presents a potential selling opportunity due to a recent downward breakout from a well-defined bearish wedge pattern. This suggests a potential acceleration of the downtrend and a higher likelihood of further declines in the coming hours.
Key Points:
Sell Entry: Consider entering a short position (selling) below the broken support line of the wedge, ideally around 192.80. This offers an entry point close to the perceived shift in momentum.
Target Levels: Initial bearish targets lie at the following points:
190.72: This represents the height of the wedge, measured from the wedge's peak to the breakout point, projected downwards from the breakout.
190.20: This is a further extension of the downside target, based on the height of the recent price movement before the breakout.
Stop-Loss: To manage risk, place a stop-loss order above the broken support line of the wedge, ideally around 193.00. This helps limit potential losses if the price unexpectedly reverses and breaks back upwards.
Thank you.

CADCHFCADCHF is trading in falling wedge pattern. The price was reacting well the support and resistance of wedge.
Currently the price has given the massive breakout from falling wedge and after successful retest of the level will be bullish signal and seems like the price may go for another leg higher.
If the breakout sustain to upside the optimum target could be 0.6680
What you guys think of this idea?

80% move up on VUL?VUL has broken out of descending wedge and has also broken out of a channel going back to mid 2023 with bullish RSI divergence. It is now retesting strong support of the channel trend and previous swing high if it can make a higher low here we will be off to the races 🚀 Good luck 🍀

TLT- Are rate cuts postponed? LONGTLT has been in a broadening wedge and formed a falling wedge within the larger pattern.
Price bounced off the lower supoort trendline in the mid-morning of trading then rising
to break out of the falling wedge. I see this as an opportunity to take a long trade in TLT
and close out a TBT position at the same time. This reversal may be due to the value of
existing bonds with the implications of a rate cut postponed beyond June. The faster RSI line
has recovered to cross the 50 level lending further support to this long trade.

GALA: buy in wedge📊Analysis by AhmadArz:
🔍Entry: 0.06513
🛑Stop Loss: 0.06354
🎯Take Profit: 0.06674 - 0.06832 - 0.07012
🔗"Uncover new opportunities in the world of cryptocurrencies with AhmadArz.
💡Join us on TradingView and expand your investment knowledge with our five years of experience in financial markets."
🚀Please boost and💬 comment to share your thoughts with us!

Sell NZDCHF Rising WedgeThe NZD/CHF pair on the M30 timeframe presents a potential selling opportunity due to a recent downward breakout from a rising wedge pattern. This pattern, despite an initial upward angle, is often seen as a bearish reversal signal.
Key Points:
Rising Wedge Breakout: The price has been trading within a rising wedge pattern characterized by converging upward trendlines. While the initial trend appears bullish due to the rising trendlines, this pattern can often be a bearish reversal signal. The recent break below the lower trendline signifies a potential confirmation of a downtrend continuation.
Sell Entry: Consider entering a short position around the current price of 0.5425, positioned close to the breakout level. This offers an entry point near the perceived shift in momentum.
Target Levels: The initial bearish target lies at 0.5390, which represents the support level before the wedge formation. Further downside targets could be determined using other technical analysis methods like Fibonacci retracements or extensions.
Stop-Loss: To manage risk, place a stop-loss order above the broken resistance line of the wedge, ideally around 0.5445. This helps limit potential losses if the price unexpectedly reverses and breaks back upwards.
Thank you

Short AU200Hi, a high-risk high reward play on the AU200 with a break and retest of the rising wedge with bearish RSI divergence. If playing along place stoploss above last swing high and wait for a break of trend on lower timeframe will also bring stoploss to breakeven when safe to do so. Good luck 🍀

SOXL 50 EMA BounceSOXL is tightening down in a wedge and bounced perfectly off the 50 EMA after being down over 6% on the day. Looking for continued strength into the close. Chart looking very similar to what we saw at the end of January and early February.

RUNEUSDTRUNEUSDT is in strong bullish trend.
As the market is consistently printing new HHs and HLs.
currently the market is retracing a bit after last HH, which is 50% Fib retracement level and local support as well. if the market successfully sustain this bullish confluence the next leg high could go for new HH.
What you guys think of this idea?

Short on USDJPYLooking for a scalp short on USDJPY on market open, hit the top of the channel with a rising wedge on bearish divergence should get to the bottom of the channel but will just take profit at resistance. GL

Short on WTCOn a larger timeframe WTC is in a rising channel, it is at the top of this channel with a rising wedge on bearish divergence on a smaller timeframe. Looking for a retest of support for a entry and a move down to resistance for take profit. GL

NZDJPYNZDJPY has given the clean breakout of long term consolidation and strong bullish divergence indicating the buyers are getting ready for strong upside move. And now the market is retesting the broken level. sellers seems to be exhausted.
if this breakout holds the next upside targets will be 92 followed by 93.

USDCAD, H4 - continuation of move down?Price broke downe the wedge pattern and retested it. So possible move down towards the nearest support 1.3430. Trade carefully!

TSLA bearish outlookIf you follow me then you know that we played the GAP fill on NASDAQ:TSLA with success and now we look to change our view and go bearish. Some have sized this up as a Bear Flag but i see a rising wedge formation that has broken down and we look to short $TSLA. I have given it room to move with such a massive move down but we should see continued weakness and a break of the recent bottom.
Potential Long on PENPEN is currently in a descending wedge with bullish RSI divergence but still looks bearish on an intraday chart so should move down to support at around 0.07c. Look for a breakout and retest of upper trendline for entry or enter a small position on break of wedge, stoploss at last swing low move SL to BE when safe to do so. Good luck

Potential Short on SPXPX is currently in an ascending wedge with bearish RSI divergence wait for a break of trendline and retest of support before taking a position with stoploss at last swing high and target at next area of support, moving SL to BE when safe to do so and then follow with a trailing stop looking for a bigger move down. Good luck traders.

PLUG set up on support for Long EntryPLUG is on a 60 minute chart ascending in a relatively parallel channel and oscillating within
it. Price has cycled into the lower thick green support trendline. A falling wedge pattern is seen
It is now on its second touch of the support. PLUG has gained 75% in three weeks. As a green
energy small cap, it is sharing an uptrend with FCEL, QS and others.
I find PLUG properly situated to add to my position taking a trade of more shares long. I call it
buying a fall into support and buying a falling wedge set up for a breakout ( again).
Yesterday a successful put option scalp provided profit to redeploy here. I will roll over
options expiring February 16th into March 16th. The monthly call contracts have the narrower
spreads and better liquidity from volume.

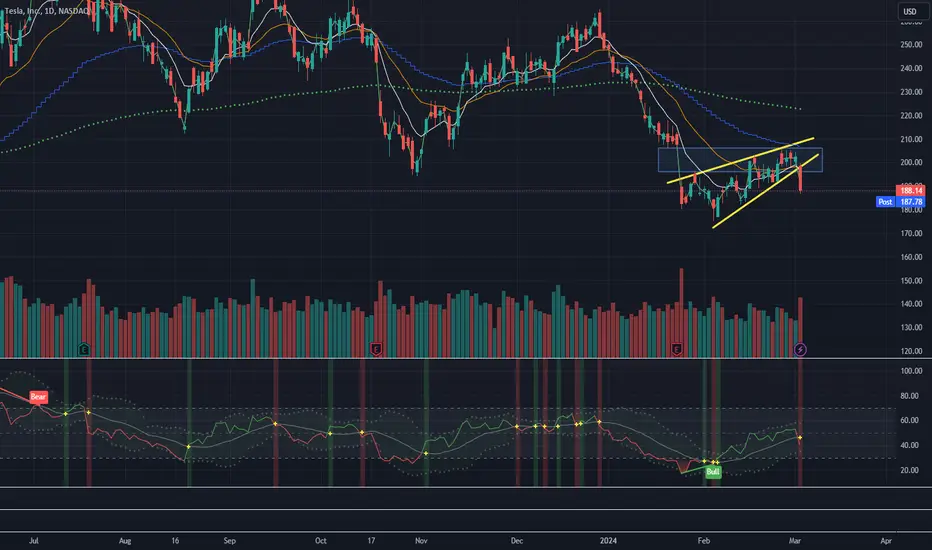
✅TESLA BEARISH WEDGE PATTERN BREAKOUT|SHORT🔥
✅TESLA was going up in
A bearish wedge pattern
But after the stock retested
The horizontal resistance
Of 208$ it broke out of the
Bearish wedge pattern and
The breakout is confirmed
So we are bearish biased
Now and we will be expecting
A further move down
SHORT🔥
✅Like and subscribe to never miss a new idea!✅
