AUDJPY: Strong Bearish Signal?! 🇦🇺🇯🇵
AUDJPY may retrace from a key daily resistance.
As a confirmation, I see a bearish breakout of a support line of a rising
wedge pattern with a high momentum bearish candle.
Goal - 96.47
❤️Please, support my work with like, thank you!❤️
I am part of Trade Nation's Influencer program and receive a monthly fee for using their TradingView charts in my analysis.
Wedge

RIVN Approaching Trend ShiftRIVN has NEVER held above the high time frame cloud....until now. Probably at least a 3-6 month idea, gotta give this time to play out after being down only since IPO. Green diag is current SL.

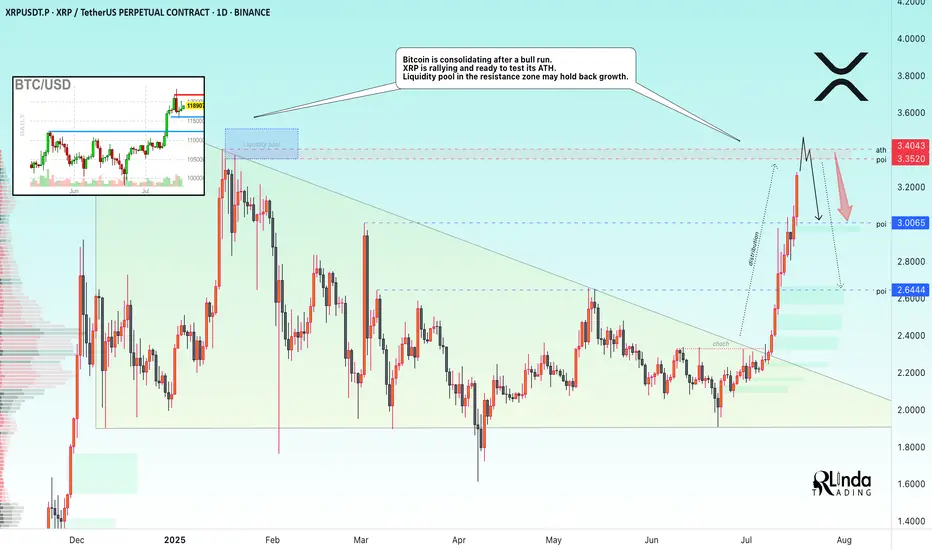
XRP → ATH retest. Reversal or continued growth?BINANCE:XRPUSDT.P is rallying and ready to test the resistance zone - ATH. Against this backdrop, Bitcoin is consolidating after a bull run. The liquidity pool may hold back growth.
Fundamentally, there is excitement across the entire cryptocurrency market. Altcoins are rallying after Bitcoin hit a new high and entered consolidation. The BTC.D index is declining, which generally provides a good opportunity for altcoins to grow. However, the index is approaching technical support, which may affect market sentiment overall...
As for XRP, there is a fairly strong liquidity pool ahead — the ATH resistance zone. The price is in a distribution phase after a change in character and a breakout of the downtrend resistance in the 2.33 zone. The momentum may exhaust its potential to break through the 3.35-3.34 zone, and growth may be halted for correction or reversal (in correlation with Bitcoin's dominance in the market).
Resistance levels: 3.35-3.40
Support levels: 3.0, 2.64
A breakout of resistance without the possibility of further growth, a return of the price below the level (i.e., inside the global flat) will confirm the fact of a false breakout of resistance, which may trigger a correction or even a reversal.
Best regards, R. Linda!
A tale of two wedgesIn early 2025 we’ve seen two classic wedge patterns on two of the market’s most watched charts: a falling wedge on the U.S. Dollar Index ( TVC:DXY ) and a rising wedge on the S&P 500 ETF ( AMEX:SPY ). Alone each tells its own tale—but together they sketch a tug‑of‑war between a fading dollar and resilient equities.
The Falling Wedge on DXY
A falling wedge in a downtrend signals waning bearish momentum and often precedes a bullish reversal once price breaks the upper trendline.
The Rising Wedge on SPY
A rising wedge in an uptrend is classically a bearish reversal pattern —a breakdown below the lower trendline confirms sellers are gaining control.
A Converging Reversal
Given the well‑known inverse correlation between the dollar and most assets, it’s noteworthy that both asset classes are flashing signs of a reversal. Taken together that makes a compelling argument.

USDJPY: Bullish Move From Support Ahead! 🇺🇸🇯🇵
I think that there is a high chance that USDJPY will continue growing
next week.
A bullish breakout of a resistance line of a flag pattern that occurred
after a test of a key support provides a strong bullish signal.
Goal - 148.7
❤️Please, support my work with like, thank you!❤️
I am part of Trade Nation's Influencer program and receive a monthly fee for using their TradingView charts in my analysis.

BITCOIN's Situation (12h) !!!So if you pay attention to the TON chart you can see that the price has formed a Ascending wedge which means it is expected to price move as equal as the measured price movement.( AB=CD )
NOTE: wait for break of the WEDGE .
Best regards CobraVanguard.💚

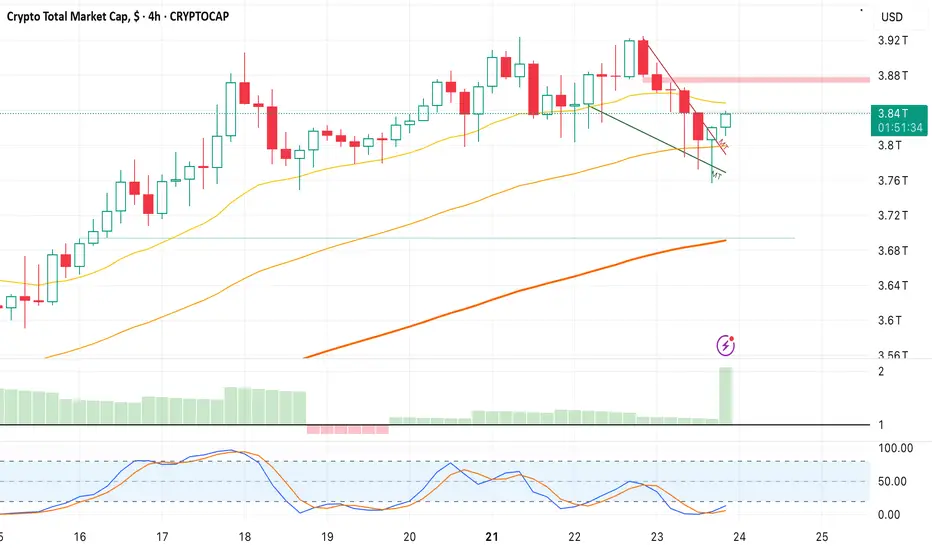
Bounce on Crypto Cap-Falling Wedge breakout at 3.836T, Target- 3.88 and 3.9.
-Looking for Bullish Crypto trading opportunities that align with this bias.
EUR/USD – The Cleanest Buy Setup EUR/USD – The Cleanest Buy Setup This Quarter (Wave E Targeting New Highs)
---
📄 TradingView explanation
📊 EUR/USD 4H Chart Analysis
The pair has beautifully respected the corrective channel from Wave C to D and is now preparing for the final leg — Wave E.
🟦 Key Highlights:
🔹 Price bouncing off demand zone
🔹 Tight consolidation near mid-channel = accumulation
🔹 Next targets: 1.1900 / 1.2050
🔹 Bullish continuation expected after liquidity sweep
🎯 The cleanest and most technically sound buy opportunity this quarter — align your longs with the trend before the breakout happens.
💬 Let them call it a bubble — we call it precision and patience. 🧠💸
#ElliottWave #EURUSD #ForexSetups #SmartMoneyMoves
?


GOLD (XAUUSD): Bullish Move Ahead?!
I think that Gold is going to rise soon.
The price is now entering a strong demand area
based on a horizontal support and a rising trend line.
The price may pull back to 3376 level.
❤️Please, support my work with like, thank you!❤️
I am part of Trade Nation's Influencer program and receive a monthly fee for using their TradingView charts in my analysis.

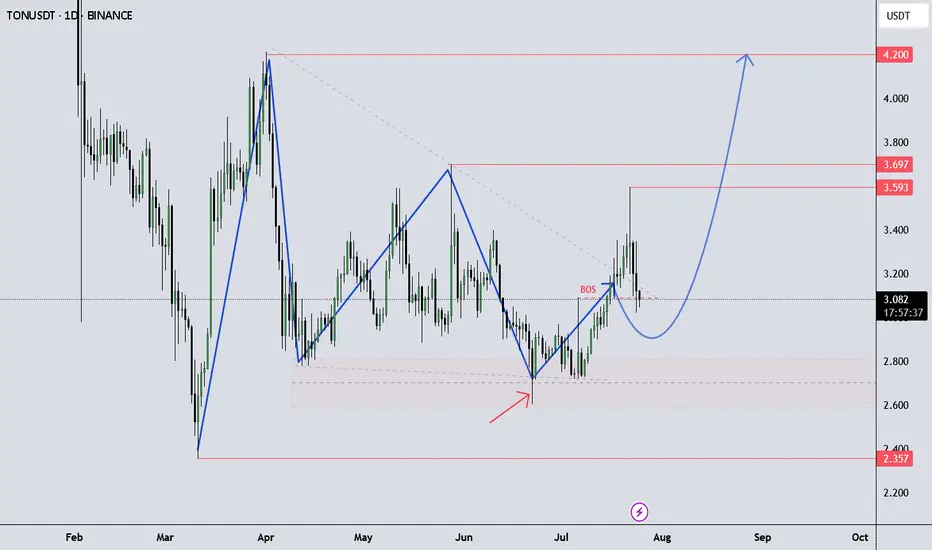
TONUSDT continue up!Looking for an Impulse Up – TONUSDT Outlook
TONUSDT is showing momentum to the upside as it continues its current structure, possibly developing another impulsive leg.
It’s important to follow your own trading plan and maintain proper risk-reward (RR) discipline.
This idea is shared for educational purposes only to support your learning.
Got questions? Feel free to drop them in the comments!
BITCOIN BULLISH WEDGE|LONG|
✅BITCOIN is trading in a
Strong uptrend and the coin
Has formed a massive bullish
Wedge pattern so we are
Bullish biased and IF we see
A bullish breakout we will
Be expecting a further
Bullish move up
LONG🚀
✅Like and subscribe to never miss a new idea!✅
Disclosure: I am part of Trade Nation's Influencer program and receive a monthly fee for using their TradingView charts in my analysis.

Market Dip or Bullish Pause Why These 4 Crypto Still Have StrongAs the crypto market retraced modestly in late July, shedding roughly 5% in total market cap, investors were left wondering: is this a signal of deeper correction—or merely a bullish pause before the next leg up?
According to analysts across leading funds and research firms, the recent dip may be healthy consolidation—and several assets continue to show strong structural momentum, even as prices pull back.
Here are four cryptocurrencies still demonstrating resilience and upside potential:
1. Bitcoin (BTC): Strong Hands, Strong Signals
Despite falling from $131,000 to $115,000, Bitcoin’s long-term holder supply reached an all-time high, with over 70% of BTC unmoved in over 12 months. Derivatives data shows rising open interest and neutral funding rates—suggesting professional positioning, not panic.
“If this is a pullback, it’s one with strong underpinnings,” said Felix Grayson, portfolio manager at Helix Funds.
2. Ethereum (ETH): ETF Flows and Ecosystem Growth
Ethereum continues to benefit from spot ETF inflows and Layer 2 expansion. Gas fees remain low, and total value locked (TVL) on Ethereum-based chains has grown by 9% in July alone.
“ETH’s on-chain activity is diverging from price,” said Melinda Zhou, research lead at TitanAlpha. “That’s usually a leading indicator.”
3. Chainlink (LINK): Real-World Integration Boom
LINK is quietly gaining institutional traction. The token surged 14% month-to-date on the back of Oracle partnerships with global banks exploring tokenized bonds and CBDCs.
Chainlink’s Cross-Chain Interoperability Protocol (CCIP) is also seeing adoption by multiple Layer 1s, strengthening its role as the data layer of Web3.
4. StarkNet (STRK): Layer 2 With Institutional Backing
A newer entrant, StarkNet, is positioning itself as the “ZK-powered” Ethereum scalability solution of choice. With backers like Sequoia and Paradigm, and growing traction among DeFi protocols, STRK has outperformed peers in July with a 27% gain.
“The zero-knowledge narrative is just beginning,” noted Zhou. “StarkNet could lead the next phase of Layer 2 expansion.”
Conclusion
Not all dips are created equal. While short-term price action may test investor nerves, fundamentals across major Layer 1 and Layer 2 networks remain robust and improving. For seasoned investors, these moments offer not panic—but perspective.
As capital returns and development accelerates, expect these four projects to remain at the forefront of the next bullish wave.

Spot Ether ETFs Log $453M in Inflows, Extend Streak to 16 DaysThe momentum behind Ethereum continues to build as spot Ether exchange-traded funds (ETFs) in the United States and abroad recorded another impressive influx of capital, attracting $453 million in net inflows over the past week. This marks the 16th consecutive day of inflows, underscoring a growing institutional appetite for the second-largest cryptocurrency by market capitalization.
While Bitcoin has long dominated the digital asset ETF landscape, Ether is increasingly capturing the attention of sophisticated investors. Analysts attribute the sustained interest to a combination of macroeconomic factors, evolving regulatory clarity, and Ethereum’s unique position within the decentralized finance (DeFi) ecosystem.
Institutional Endorsement Grows
Several major asset managers, including BlackRock and Fidelity, have reported increased client demand for Ether exposure in recent months. According to data compiled by Bloomberg, the $453 million inflow in Ether ETFs this week is the largest since the products launched, bringing total assets under management (AUM) across major Ether funds to $3.2 billion.
“These consistent inflows are a clear sign that Ether is becoming institutional-grade,” said Mira Taylor, head of digital asset research at Keystone Capital. “It reflects a shift in how the market perceives Ethereum—not just as a tech platform, but as a core financial infrastructure.”
This shift comes amid Ethereum’s continued progress toward scalability, including its transition to proof-of-stake (PoS) and the implementation of Layer-2 scaling solutions such as Optimism and Arbitrum. These upgrades improve network efficiency and reduce gas fees, making Ethereum more attractive for enterprise-level use cases.
Regulatory Developments Provide Tailwind
The surge in investor confidence is also linked to increasing regulatory clarity. The SEC’s tacit approval of spot Ether ETFs in key jurisdictions, including the United States and Europe, has provided the legitimacy many institutions required before allocating capital.
Moreover, Ethereum’s perceived decentralization and utility have helped it avoid the same level of scrutiny that other altcoins have faced. While Ripple’s XRP and Solana remain entangled in legal ambiguities, Ethereum benefits from its early position as a non-security in the eyes of regulators.
Market Outlook
Despite recent volatility in the broader crypto markets, Ethereum has shown resilience. ETH is currently trading around $3,550, up nearly 12% month-over-month. Analysts suggest the inflows into spot Ether ETFs could act as a support mechanism for price, dampening downside volatility.
“ETF inflows often act as a price stabilizer, particularly in a risk-on environment,” said Noah Wexler, macro strategist at Apollo Digital. “If inflows persist, Ethereum could revisit the $4,000 level by Q4.”
Investors and analysts alike will be watching closely to see whether the inflow streak continues into a 17th day. Regardless of short-term price action, the structural trend appears clear: Ethereum is solidifying its role as an investable, institutional-grade asset.
EURUSD | Symmetrical Wedge Breakdown
TF: 15m |
🎯 Setup Insight:
The market doesn’t move in straight lines — it coils.
What you're seeing is an ABCDE corrective wedge, playing out its final phase.
Wave E completed, and liquidity is built right above.
We expect a trap in the purple premium zone (1.1740–1.1757) — then a drop toward 1.1695.
---
🧠 Strategy:
Sell Zone: 1.17410 – 1.17574
Target: 1.16958
Invalidation Above: 1.17600
Wedge ✅
Liquidity ✅
Confluence ✅
Only one move left — the snap.
---
🗝️ Notes:
The market may spike into the OB zone to trap late buyers before the real move unfolds.
The mini-diagram on the right explains it all: "Trap them high, exit them low.✓

Bitcoin & 150k TOPBitcoin has been trading within a rising channel for a long time, with resistance at $150,000. The middle support/resistance line also indicates $150,000, suggesting a potential significant rejection at this level.

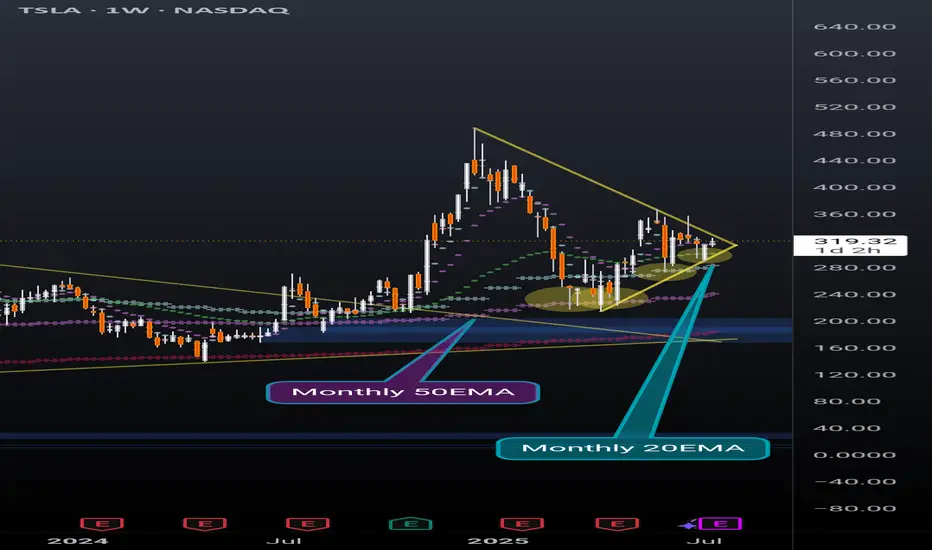
TSLA weekly coiling into something powerfulNever doubt the power of TSLA. Recently broke out of a huge pennant, and now nearing the end of another pennant while simultaneously holding support above the daily 20EMA(overlayed on this weekly chart).
Also recently found support off of the monthly 20EMA (overlayed on this weekly chart) and took 2 direct hits on the monthly 50EMA (overlayed on this weekly chart) before that and rallied up. It will take a lot to crush this setup but anything can happen. Possibly a longer pennant formation.
I'm just a cat not a financial advisor.
EUR-CAD Bullish Wedge! Buy!
Hello,Traders!
EUR-CAD is trading in an
Uptrend and the pair formed
A bullish wedge pattern and
Now we are seeing a bullish
Breakout from the wedge so
We are bullish biased and we
Will be expecting a further
Bullish move up
Buy!
Comment and subscribe to help us grow!
Check out other forecasts below too!
Disclosure: I am part of Trade Nation's Influencer program and receive a monthly fee for using their TradingView charts in my analysis.

Euro will rise a little and then start to fall to support lineHello traders, I want share with you my opinion about Euro. After a prolonged consolidation period, a strong upward trend was initiated from the buyer zone around 1.1285, propelling the EUR significantly higher. This initial impulsive move has since transitioned into a more complex and mature phase, taking the shape of a large upward wedge formation, a pattern which often signals underlying exhaustion in the prevailing trend. Currently, the pair is operating within this defined market zone, characterized by a clear ascending support line and a corresponding resistance line. The price action inside the wedge has become corrective, with the most recent upward correction originating from the support area near 1.1575. The working hypothesis is centered on a short-term bearish scenario, which anticipates that this current rally will fail as it approaches the upper boundary of the wedge. A rejection from this resistance would confirm that selling pressure is increasing and that the bullish momentum is waning. This would likely trigger a significant downward rotation within the structure, with the immediate objective being a retest of the main ascending support line. For this reason, the TP is strategically and logically placed at the 1.1665 level, as this point lies directly on the trend line and serves as the most critical test for the existing uptrend's viability. Please share this idea with your friends and click Boost 🚀
Disclaimer: As part of ThinkMarkets’ Influencer Program, I am sponsored to share and publish their charts in my analysis.

GOLD - Price can make correction and then bounce upHi guys, this is my overview for XAUUSD, feel free to check it and write your feedback in comments👊
The price has been developing within a broadening wedge formation for some time.
This pattern began after the asset found strong support in the key zone around the $3305 level.
Within this structure, buyers recently pushed the price upwards in a notable impulse wave.
This impulse culminated in a test of the wedge's upper boundary and the resistance area near $3430.
After being rejected from that resistance, the price is now in a corrective decline towards the lower trendline.
I expect that this correction will find its footing on the lower boundary, leading to a rebound and a new rally towards the $3430 resistance.
If this post is useful to you, you can support me with like/boost and advice in comments❤️
Disclaimer: As part of ThinkMarkets’ Influencer Program, I am sponsored to share and publish their charts in my analysis.

Building a Future for RWAs and Multichain DeFi: A Strategic OutlThe intersection of real-world assets (RWAs) and decentralized finance (DeFi) has become one of the most transformative trends in the blockchain space. As traditional financial institutions explore blockchain integration, and DeFi continues to mature, tokenized RWAs—like real estate, bonds, and commodities—are poised to redefine the global financial landscape. Combined with multichain interoperability, this evolution promises greater efficiency, transparency, and accessibility.
The Rise of Real-World Assets on Blockchain
Tokenization is the process of converting rights to an asset into a digital token on a blockchain. For RWAs, this means that tangible assets—such as property, equities, or art—can be fractionalized and traded globally in real-time. This unlocks liquidity in previously illiquid markets, enables 24/7 trading, and reduces administrative overhead.
Use cases are rapidly emerging: real estate funds issuing tokenized shares; commodities like gold being represented on-chain; and even government bonds available on DeFi platforms. These developments democratize access to assets once limited to high-net-worth individuals and institutions.
However, integrating RWAs into DeFi isn't just a technical feat. It requires robust legal frameworks, clear custodianship, and standardized processes for valuation and dispute resolution. Without proper infrastructure, tokenized RWAs risk becoming speculative rather than transformative.
The Role of Multichain Ecosystems
No single blockchain can accommodate the entire spectrum of financial use cases. Multichain architecture—where assets and applications span multiple blockchains—is essential to scale RWA integration effectively.
Cross-chain interoperability enables users to leverage different blockchains for what they do best. Ethereum offers deep liquidity and composability. Algorand and Avalanche deliver scalability and low fees. Polkadot and Cosmos focus on seamless interoperability. Bridging these ecosystems creates a holistic, resilient financial infrastructure.
Protocols like Wormhole, LayerZero, and Chainlink’s CCIP are leading the charge in enabling these connections. By ensuring assets can move securely and efficiently across chains, they support a unified liquidity layer that benefits both RWA issuers and investors.
Challenges and Opportunities
Despite the promise, several hurdles remain. Regulatory compliance is fragmented across jurisdictions, making it difficult for global RWA platforms to operate consistently. Many DeFi protocols are not yet equipped to handle the complexities of asset custody, identity verification, or investor rights enforcement.
Moreover, education is a significant barrier. Institutional investors and retail users alike must understand the risks and mechanisms of DeFi to participate confidently. Projects that prioritize transparency, usability, and regulatory alignment are more likely to gain mainstream adoption.
The opportunity, however, is vast. RWAs could unlock trillions in idle capital, while multichain frameworks reduce friction in global capital markets. Combined, they offer a future where financial products are borderless, inclusive, and programmable.
Conclusion
The convergence of RWAs and multichain DeFi represents a critical shift in finance—from centralized gatekeeping to decentralized participation. It has the potential to create a more accessible and efficient global financial system. While challenges persist, technological advances and increasing institutional interest suggest that this transformation is not only possible, but inevitable. The next few years will be pivotal in shaping the architecture, governance, and standards of this emerging ecosystem.
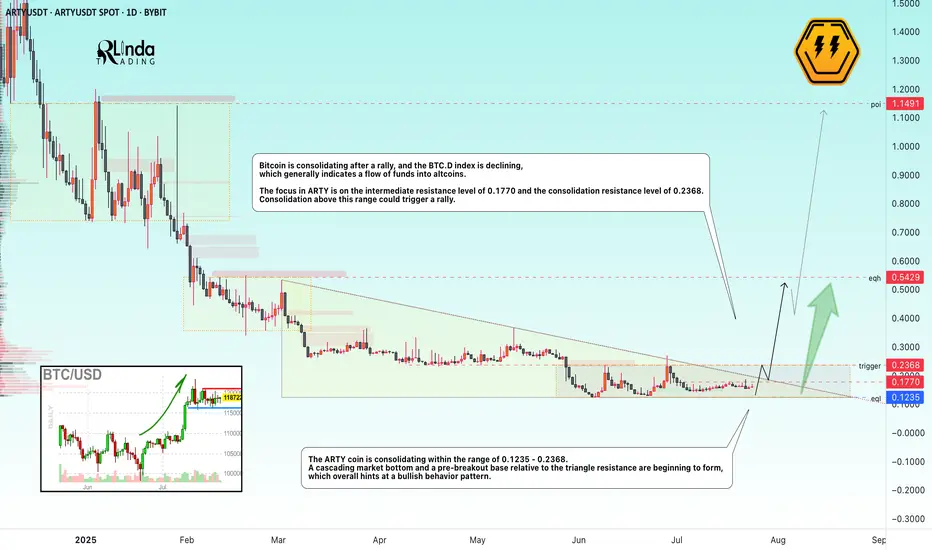
ARTYUSDT → A breakout of resistance could trigger another rallyBYBIT:ARTYUSDT is forming a cascading bottom as part of consolidation before a possible breakout of resistance. The decline in Bitcoin's market dominance gives altcoins a chance.
( (Idea from September 29, 2024!) We previously discussed this coin before its 300% rally. The root causes of its emergence from accumulation and readiness for strong growth were correctly identified).
The dump phase is coming to an end, a cascading market bottom is beginning to form, and a pre-breakout base relative to the triangle resistance is forming, which overall hints at a bullish behavior pattern.
Bitcoin is currently consolidating after the rally, and the Bitcoin dominance index is declining, which generally indicates a flow of funds into altcoins. The situation is such that the altcoin market has another chance for the season. The correction across the entire market may end in the near future, and under favorable conditions (the fundamental background is strengthening, Trump has announced another important event for cryptocurrencies), the market may return to strong movements...
The focus in ARTY is on the intermediate resistance at 0.1770 and the consolidation resistance at 0.2368. Consolidation above this range could trigger a rally.
Resistance levels: 0.2368
Support levels: 0.1235
Technically, a few days ago, the coin tested the consolidation resistance, but the decline did not continue, which generally indicates that buyers are showing interest and holding the market. Consolidation in the near term may end with a retest of 0.1770, 0.2368, a breakout, and further growth.
Best regards, R. Linda!
Trading Divergences With Wedges in ForexTrading Divergences With Wedges in Forex
Divergence trading in forex is a powerful technique for analysing market movements, as is observing rising and falling wedges. This article explores the synergy between divergence trading and wedges in forex, offering insights into how traders can leverage these signals. From the basics to advanced strategies, learn how you could utilise this approach effectively, potentially enhancing your trading skills in the dynamic forex market.
Understanding Divergences
In forex trading, the concept of divergence plays a pivotal role in identifying potential market shifts. A divergence in forex, meaning a situation where price action and a technical indicator like the Relative Strength Index (RSI) or Moving Average Convergence Divergence (MACD) move in opposite directions, often signals a weakening trend. This discrepancy is a valuable tool in divergence chart trading, as it may indicate a possible reversal or continuation of the current trend.
There are two primary types of divergence in forex—regular and hidden. Regular divergence occurs when the price makes higher highs or lower lows while the indicator does the opposite, often signalling a reversal. Hidden divergence, on the other hand, happens when the price makes lower highs or higher lows while the indicator shows higher highs or lower lows, typically suggesting a continuation of the current trend.
Trading Rising and Falling Wedges
Rising and falling wedges are significant patterns in forex trading, often signalling potential trend reversals. A rising wedge, formed by converging upward trendlines, often indicates a bearish reversal if it appears in an uptrend. Conversely, a falling wedge, characterised by converging downward trendlines, typically reflects a bullish reversal if it occurs in a downtrend.
Traders often look for a breakout from these patterns as a signal to enter trades. For rising wedges, a downward breakout can be seen as a sell signal, while an upward breakout from a falling wedge is often interpreted as a buy signal. When combined with divergences, this chart pattern can add confirmation and precede strong movements.
Best Practices for Trading Divergences
Trading divergence patterns in forex requires a keen eye for detail and a disciplined, holistic approach. Here are key practices for effective trading:
- Comprehensive Analysis: Before trading on divergence and wedges, be sure to analyse overall market conditions.
- Selecting the Right Indicator: Choose a forex divergence indicator that suits your trading style. Common choices include RSI, MACD, and Stochastic.
- Confirmation Is Key: It’s best to watch for additional confirmation from price action or other technical tools before entering a trade.
- Risk Management: Traders always set stop-loss orders to manage risk effectively. Divergence trading isn't foolproof; protecting your capital is crucial.
- Patience in Entry and Exit: Be patient as the divergence develops and confirm with your chosen indicators before entering or exiting a trade.
Strategy 1: RSI and Wedge Divergence
Traders focus on regular divergence patterns when the RSI is above 70 (overbought) or below 30 (oversold), combined with a rising or falling wedge pattern. The strategy hinges on identifying highs or lows within these RSI extremes. It's not crucial if the RSI remains consistently overbought or oversold, or if it fluctuates in and out of these zones.
Entry
- Traders may observe a regular divergence where both the price highs/lows and RSI readings are above 70 or below 30.
- After the formation of a lower high (in an overbought zone) or a higher low (in an oversold zone) in the RSI, traders typically watch as the RSI crosses back below 70 or above 30. This is accompanied by a breakout from a rising or falling wedge, acting as a potential signal to enter.
Stop Loss
- Stop losses might be set just beyond the high or low of the wedge.
Take Profit
- Profit targets may be established at suitable support/resistance levels.
- Another potential approach is to exit when the RSI crosses back into the opposite overbought/oversold territory.
Strategy 2: MACD and Wedge Divergence
Regarded as one of the best divergence trading strategies, MACD divergence focuses on the discrepancy between price action and the MACD histogram. The strategy is particularly potent when combined with a rising or falling wedge pattern in price.
Entry
- Traders typically observe for the MACD histogram to diverge from the price. This divergence manifests as the price reaching new highs or lows while the MACD histogram fails to do the same.
- The strategy involves waiting for the MACD signal line to cross over the MACD line in the direction of the anticipated reversal. This crossover should coincide with a breakout from the rising or falling wedge.
- After these conditions are met, traders may consider entering a trade in anticipation of a trend reversal.
Stop Loss
- Stop losses may be set beyond the high or low of the wedge, which may help traders manage risk by identifying a clear exit point if the anticipated reversal does not materialise.
Take Profit
- Profit targets might be established at nearby support or resistance levels, allowing traders to capitalise on the expected move while managing potential downside.
Strategy 3: Stochastic and Wedge Divergence
Stochastic divergence is a key technique for divergence day trading in forex, especially useful for identifying potential trend reversals. This strategy typically employs the Stochastic Oscillator with settings of 14, 3, 3.
Entry
- Traders may look for divergence scenarios where the Stochastic readings are above 80 or below 20, mirroring the RSI approach.
- This divergence is observed in conjunction with price action, forming a rising or falling wedge.
- Entry may be considered following a breakout from the wedge, which signals a potential shift in market direction.
Stop Loss
- Setting stop losses just beyond the high or low of the wedge might be an effective approach.
Take Profit
- Profit targets may be set at key support/resistance levels.
The Bottom Line
Divergence trading, coupled with the analysis of rising and falling wedges, offers a comprehensive approach to navigating the forex market. By integrating the discussed strategies with sound risk management and market analysis, traders may potentially enhance their ability to make informed decisions in the dynamic world of forex.
This article represents the opinion of the Companies operating under the FXOpen brand only. It is not to be construed as an offer, solicitation, or recommendation with respect to products and services provided by the Companies operating under the FXOpen brand, nor is it to be considered financial advice.
