EURNZD: Bearish Move From Resistance 🇪🇺🇳🇿
EURNZD is going to retrace from a strong daily resistance cluster.
As a confirmation signal, I see a bearish breakout of a support line
of a rising wedge pattern on an hourly time frame.
Goal - 1.9144
❤️Please, support my work with like, thank you!❤️
I am part of Trade Nation's Influencer program and receive a monthly fee for using their TradingView charts in my analysis.
Wedge

GOLD → Continuation of the global trend... To 3350?FX:XAUUSD is testing trend support within a correction. Against a complex fundamental backdrop (the Middle East, Fed comments, Trump's desire to lower rates), the price may continue to rise.
The price of gold rose from a weekly low of $3,363 on Thursday thanks to increased demand for safe-haven assets following reports of possible US strikes on Iran. Markets are ignoring the Fed's hawkish decision to maintain its tight policy and rate forecasts. Traders are waiting for new signals from the Middle East, given the risk of increased volatility due to low liquidity in connection with the US holiday.
Technically, a bullish wedge pattern is forming as part of the correction. The breakdown of the pattern's support did not lead to a decline, but a return of prices and a breakout of resistance could trigger growth after liquidity returns.
Resistance levels: 3373, 3403, 3420
Support levels: 3349, 3320
Before growth, a retest of the trend support or the 3350 zone is possible. However, if the price goes above 3375 and the bulls hold their ground above this level, then we can expect growth to continue within the trend.
Best regards, R. Linda!

Gold Hits PRZ with RD-! Time for Bears to Take Over?Gold ( OANDA:XAUUSD ) attacked the Resistance zone ($3,445-$3,406) once again, forming an Ending Diagonal at the top of the structure.
Although price reached the Potential Reversal Zone (PRZ) , the presence of Regular Divergence (RD-) between the last two peaks could indicate the weakening of bullish momentum .
In terms of Elliott Wave theory , we can clearly count a completed 5-wave structure , with an Ending Diagonal pattern . This supports the idea of a major correction starting soon .
I expect Gold to attack the lower lines of Ending Diagonal , and if it breaks, it could drop to at least $3,333 . The Second Target could be the Support zone ($3,451-$3,120) .
Do you think Gold will make a new All-Time High(ATH) again in this rally?!
Note: Stop Loss (SL) = $3,463
Gold Analyze (XAUUSD), 2-hour time frame.
Be sure to follow the updated ideas.
Do not forget to put a Stop loss for your positions (For every position you want to open).
Please follow your strategy; this is just my idea, and I will gladly see your ideas in this post.
Please do not forget the ✅ ' like ' ✅ button 🙏😊 & Share it with your friends; thanks, and Trade safe.

#BSVUSDT #1D (ByBit) Falling wedge breakoutBitcoin Satoshi Vision is pulling back to 100EMA daily support where it seems likely to bounce and resume bullish, mid-term.
⚡️⚡️ #BSV/USDT ⚡️⚡️
Exchanges: ByBit USDT
Signal Type: Regular (Long)
Leverage: Isolated (2.0X)
Amount: 4.5%
Entry Targets:
1) 38.05
Take-Profit Targets:
1) 63.54
Stop Targets:
1) 29.54
Published By: @Zblaba
AMEX:BSV BYBIT:BSVUSDT.P #BitcoinSatoshiVision #PoW
Risk/Reward= 1:3.0
Expected Profit= +134.0%
Possible Loss= -44.7%
Estimated Gain-time= 2 months

$ENS / USDT Daily Time frame, MAJOR PUMP?Chart Overview
- Pattern Identified: Falling Wedge Pattern
- A bullish reversal pattern, often appearing after a downtrend.
- Three major touchpoints on the lower trendline indicate strong support and pattern validity.
Demand Zone (Support Area)
- Marked near the current price level ($2.0309 - $2.6722)
- Price is testing this zone for the third time.
Supply Zone (Resistance Area)
- Around ($6.6529 – $9.2734)
- Multiple swing highs are plotted within or near this region, indicating strong historical resistance.
Volume Profile (Right side of chart)
- High volume node between $2.50 – $4.00 suggests price acceptance and a potential area for consolidation or resistance after breakout.
- Low volume area between $4.50 – $6.50 implies less resistance, so price might move quickly through it.
FVG (Fair Value Gaps)
- Several FVGs (imbalance zones) are highlighted.
- $3.8 – $4.05
- $5.8236 – $6.1663
- These zones often act as magnets for price, offering potential targets after breakout.
📏 Fibonacci Levels
- Pullback levels (0.28, 0.5, 0.618, 0.786) are marked.
- Price may retrace toward these areas as part of the bullish structure.
✅ Bullish Scenario
- Breakout from the falling wedge pattern.
- Price pushes into first FVG (~$3.8), then toward $5.8236 – $6.1663, eventually challenging the supply zone ($6.6529 – $9.2734)
⚠️ Risks
- If price breaks below the demand zone, it invalidates the wedge and opens room for further downside.
- Falling wedge breakouts require confirmation (e.g., daily close above wedge resistance).
📊 Summary
- Bias: Bullish if support holds and wedge breakout occurs.
- Trigger: Break and close above wedge resistance line.
- Targets: $3.8 → $5.8 → $6.1 → $9.5
- Invalidation: Daily close below the demand zone ($2.00 - $1.90)
Please note this is not financial Advice. This is just an analysis!

WIFUSDT Long Setup – Falling Wedge Breakout Incoming?Hey Traders — if you're into high-conviction setups with real momentum, this one’s for you.
WIF has been consolidating inside a falling wedge structure and is now showing signs of strength from the major horizontal support zone around $0.77. The structure is tightening, and the recent bounce from support could be the early signal of a breakout.
Here’s the trade idea:
Entry Zone: $0.77 – $0.81
Breakout Confirmation: 4H close above the wedge trendline (~$0.87)
Targets:
Target 1: $0.95
Target 2: $1.10
Target 3: $1.35
Invalidation / SL: Below $0.74
Risk-Reward: High (3R+ depending on entry)
Strategy:
Wait for a confirmed breakout with volume. Early entries around current support with tight SLs offer favorable setups if you’re comfortable with added risk.
Keep an eye on Bitcoin’s volatility and global macros, as they may influence alt momentum.

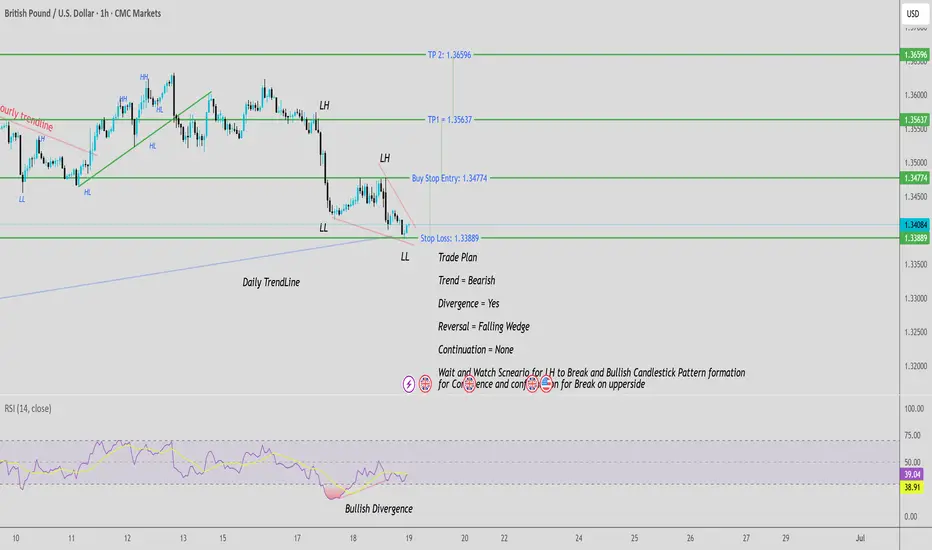
GBPUSD is forming a Potential Bullish Reversal pattern
Price formed a Potential Falling Wedge pattern with a waiting for break of LH as current Temporary Resistance.
• ✅ Entry is triggered only after a confirmation candle breaks above the LH.
• Buy Stop is placed to catch the momentum move.
• Stop Loss is at the recent lower Low (safe and logical placement).
• 🎯 Take Profit levels are based on measured move projections.
Trade Plan:
• Buy Stop = 1.34774
• Stop Loss = 1.33889
• Take Profit 1: 1.35637
• Take Profit 2: 1.36596
• Lot size : 1:2 Risk Reward Ratio
“Waiting for Lower High to break with Bullish confirmation candle” – this ensures you enter only on strong momentum.
GBPUSD is forming a Potential Bullish Reversal pattern with clear structure. A break of the neckline confirms the setup
Key Highlights:
• ✅ Pattern: Falling Wedge
• ⚠️ Confirmation: Break + Bullish candle
• 🔄 Risk Management: Tight SL, 2 TP levels
• 🧩 Confluence: Trendline Bounce + structure shift + RSI Divergence
Silver Under Pressure with Dollar on the MoveSitting in a rising wedge and with momentum indicators rolling over, the ducks look to be lining up for a potential downside break for silver. Throw in signs the U.S. dollar may have bottomed—an adversary to commodity prices—and the unwind could be sizeable, especially if risk appetite were to evaporate.
If silver were to break beneath wedge support and hold there, it would allow for shorts to be established with a tight stop above the level for protection. $35.50—where the price bounced strongly from on June 12—screens as an initial target. If broken, it would bring uptrend support established in early April, along with the October 2024 highs at $34.87, into play.
Bullish momentum that helped power silver higher is also showing signs of waning—we’ve seen bearish divergence between RSI (14) and price, while MACD is also rolling over towards the signal line. The momentum picture isn’t outright bearish but just looks heavy.
Another important factor to consider beyond technicals is that silver and other commodity prices often struggle in an environment where the U.S. dollar is strengthening. That point is reinforced by the inverse correlation between silver and DXY over the past month, sitting with a score of -0.66—not strong by any stretch, but not something you can ignore either.
Good luck!
DS

GBPUSD - One More Leg for Bears to Take Over!Hello TradingView Family / Fellow Traders. This is Richard, also known as theSignalyst.
📈GBPUSD has been overall bullish trading within the rising broadening wedge pattern marked in red.
However, it is currently approaching the upper bound of the wedge acting as an over-bought zone.
And the $1.365 - $1.375 is a strong resistance zone.
🏹 Thus, the highlighted red circle is a strong area to look for sell setups as it is the intersection of resistance and upper red trendline acting as a non-horizontal resistance.
📚 As per my trading style:
As #GBPUSD approaches the red circle zone, I will be looking for bearish reversal setups (like a double top pattern, trendline break , and so on...)
📚 Always follow your trading plan regarding entry, risk management, and trade management.
Good luck!
All Strategies Are Good; If Managed Properly!
~Rich
Disclosure: I am part of Trade Nation's Influencer program and receive a monthly fee for using their TradingView charts in my analysis.

Distribution Zone Triggered⏰ Timeframe: 15-Minute (M15)
💱 Pair: EUR/USD
📍 Event: Distribution Zone Triggered ‼️
🔍 Market Structure Breakdown: 1️⃣ Accumulation Phase 🟨
📌 Smart money builds long positions
📌 Stops hunted below support
2️⃣ Manipulation Phase 🟦
📌 Liquidity grab above resistance
📌 Trap set for retail buyers
3️⃣ Distribution Phase 🟥
📌 Entry for institutional sellers
📌 Shift in order flow to bearish bias
📊 What’s next?
🔻 Price likely heading to lower demand zones
🔄 Expecting continuation move post-distribution
🧠 Powered by Smart Money Concepts + Wyckoff Logic
🎯 Trader's Tip: Always wait for confirmation inside distribution to avoid false entries!
#EURUSD #DistributionZone #SmartMoney #WyckoffLogic #LiquidityGrab #SMCTrading

USDCHF: Pullback From Resistance 🇺🇸🇨🇭
USDCHF is going to retrace from a key daily horizontal resistance cluster.
As a confirmation, I spotted a bearish breakout of a support line of a rising
wedge pattern on an hourly time frame.
We see its retest now.
Goal - 0.815
❤️Please, support my work with like, thank you!❤️
I am part of Trade Nation's Influencer program and receive a monthly fee for using their TradingView charts in my analysis.

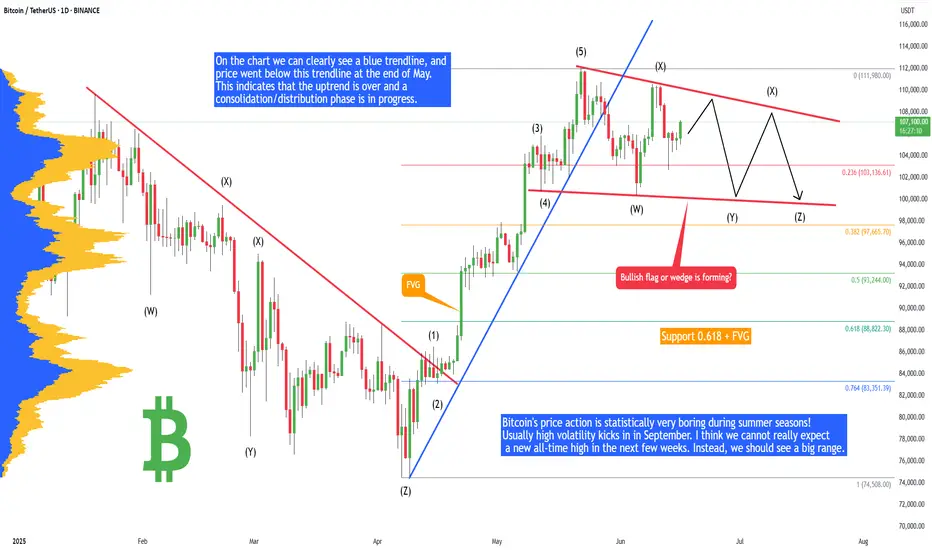
Bitcoin - Plan for summer 2025 (no new ATH, big range!)Bitcoin's price action is statistically very boring during summer seasons! Usually high volatility kicks in in September. I think we cannot really expect a new all-time high in the next few weeks. Instead, we should see a big range. Why? Let's take a look at technical analysis.
On the chart we can clearly see a blue trendline, and price went below this trendline at the end of May. This indicates that the uptrend is over and a consolidation/distribution phase is in progress. This phase is usually represented as a bull flag, triangle, rectangle, or wedge. When we look at the current price action, it looks like a bullish flag consolidation pattern. In this case we will probably see multiple liquidity sweeps below the previous swing lows to kick out early longs.
There are 2 types of traders. The first one they love to trade ranges, and the second they love to trade breakouts and higher volatility environments. Currently I think Bitcoin is creating a range, so do not expect any crazy movements until this range is valid.
Bullish flags are usually bullish patterns, but often they break down and act like bearish patterns. So what would happen if this bullish flag breaks down? That would send the price of Bitcoin to the 0.618 FIB, which is at 88,882 USDT. What is this bullish flag breaks out? That would send the price of Bitcoin to 116,000 to 125,000, but to establish this price we first need to see low of the bull flag, which is not confirmed yet. I will definitely inform you in one of my next analyses, so write a comment with your altcoin + hit the like button, and I will make an analysis for you in response.
At the end of each post, I share my professional trading tips: "If you realize you’ve made a poor trading decision, exit before the stop loss forces you out." Trading is not hard if you have a good coach! This is not a trade setup, as there is no stop-loss or profit target. I share my trades privately. Thank you, and I wish you successful trades!
GOLD - Price will bounce from support area and start to growHi guys, this is my overview for XAUUSD, feel free to check it and write your feedback in comments👊
Some days ago price declined to $3220 level and then started to grow, and soon reached $3380 level and even broke it.
Then price started to trades inside wedge, where it at once started to decline and in a short time declined to support line of wedge.
After this, Gold rose and broke $3220 level and continued to move up in wedge, where it also made two gaps before.
Price rose to $3380 level and some time traded very close to this level, but later corrected to support line.
Next, price made a strong impulse, breaking $3380 level and exiting from wedge as well, and continued to grow.
Recently, Gold started to fall, so I think that it will fall to support area and then bounce up to $3500
If this post is useful to you, you can support me with like/boost and advice in comments❤️
Disclaimer: As part of ThinkMarkets’ Influencer Program, I am sponsored to share and publish their charts in my analysis.

EUR/USD Triangle Pattern – 1H Timeframe
📊 EUR/USD Triangle Pattern – 1H Timeframe
🕐 Date: 17 June 2025
📌 Chart by: GreenfireForex
🔷 Pattern: Contracting Triangle (ABCDE)
🔍 Context: Forming inside Wave (4) – possible breakout before Wave (5)
📈 Upside Potential: Break above triangle → target near 1.16500+
📉 Downside Risk: If fails to break up → revisit demand zone around 1.15000
---
🔮 Possible Scenarios:
✅ Bullish Breakout:
Breaks above wave (e)
Clean rally toward target zone
Ideal for a long setup with tight SL
❌ Bearish Fakeout:
Rejection from triangle resistance
Falls back into demand zone
Look for reversal or retest opportunities
---
🎯 Strategy Tips:
Wait for a breakout candle
Use SL outside triangle zone
Entry based on confirmation – avoid early trades
💬 Let’s discuss live market reaction as price nears triangle edge. Stay ready .

Wedge Pattern – Simple Explanation
📚 Wedge Pattern – Simple Explanation
A wedge pattern is a shape on the chart that looks like a triangle or cone. It tells us that the price is getting ready to break out — either up or down.
---
🔻 Falling Wedge (Bullish)
Looks like price is going down, but slowly.
Lines move closer together.
Usually means the price will go up soon.
It's a bullish signal (good for buying).
---
🔺 Rising Wedge (Bearish)
Price goes up, but losing strength.
Lines get closer together.
Usually means the price will go down soon.
It's a bearish signal (good for selling).
---
💡 Easy Tips:
Wait for breakout (big move out of the wedge).
Use a stop-loss below/above the pattern.
Target = height of the wedge.
---
📌 In Short:
Wedge = Squeeze pattern.
Falling wedge = Buy chance.
Rising wedge = Sell chance.
---
Let me know if you have sny doubt in comments

Google Wave Analysis – 16 June 2025- Google reversed from support level 175.00
- Likely to rise to the resistance level 180.00
Google recently reversed up from the support zone between the support level 175.00 (former Double Top from May) and the 38.2% Fibonacci correction of the sharp upward impulse iii from the start of June.
The upward reversal from this support zone started the active minor impulse wave v of the C-wave from the start of May.
Google can be expected to rise further in the active Rising Wedge chart pattern to the next resistance level 180.00 (which stopped the previous impulse wave (iii) earlier this month).

Bitcoin Consolidates Near Highs — Bullish Wedge Signals StrengthHolding Strong Amid Uncertainty:
Despite rising geopolitical tensions, Bitcoin remains resilient, trading near recent highs. This stability reflects strong institutional confidence and sustained accumulation by long-term holders.
Bullish Technical Setup:
The ongoing consolidation between $100,000 and $110,000 is forming a wedge pattern—a classic bullish continuation structure. This suggests the market is coiling for its next major move.
Key Levels to Watch:
Immediate Resistance: $112,500
Support Zone: Holding above $100,000 keeps the bullish case intact
Measured Move Target: $130,000–$135,000
Outlook:
This tight consolidation signals a healthy pause in a strong uptrend, positioning Bitcoin for a potential breakout and continuation higher. All signs point to the bulls remaining firmly in control.
#Bitcoin #BTC #TechnicalAnalysis #BullishWedge #CryptoMarket #InstitutionalBuying #PriceAction #Geopolitics #SupportAndResistance #BullRun

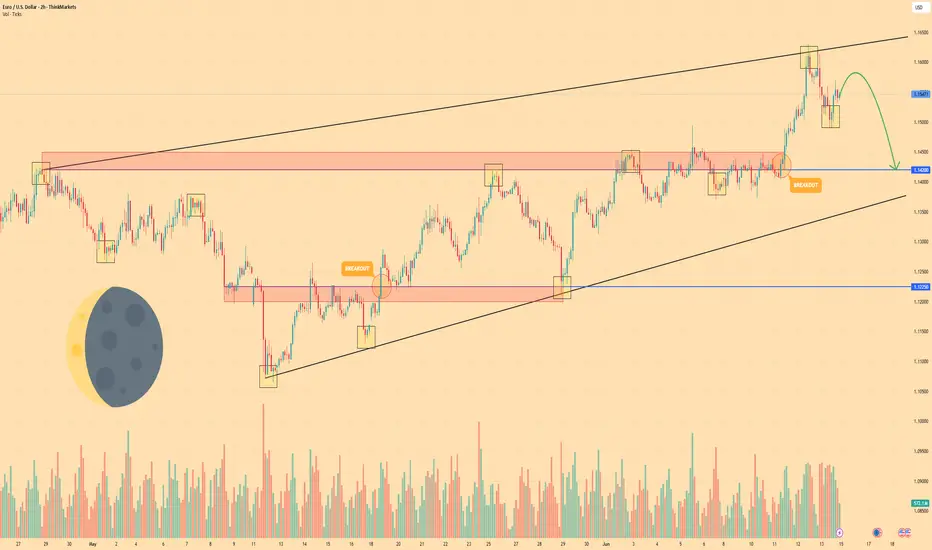
EURO - Pirce can make movement up and then drop to $1.1420Hi guys, this is my overview for EURUSD, feel free to check it and write your feedback in comments👊
After entering the wedge, Euro began to slow down, creating a tightening structure between support and resistance.
Price corrected toward the support line of the wedge, where it briefly paused and bounced with weak momentum.
The bounce triggered a breakout above local resistance, but buyers failed to hold the price at higher levels.
Soon after, the market reversed from the wedge’s upper boundary and began forming a bearish rejection pattern.
Now price trades just below the recent highs, showing fading demand and early signs of short-term reversal.
I expect Euro to move lower and reach the $1.1420 support level — my current target in this scenario.
If this post is useful to you, you can support me with like/boost and advice in comments❤️
Disclaimer: As part of ThinkMarkets’ Influencer Program, I am sponsored to share and publish their charts in my analysis.
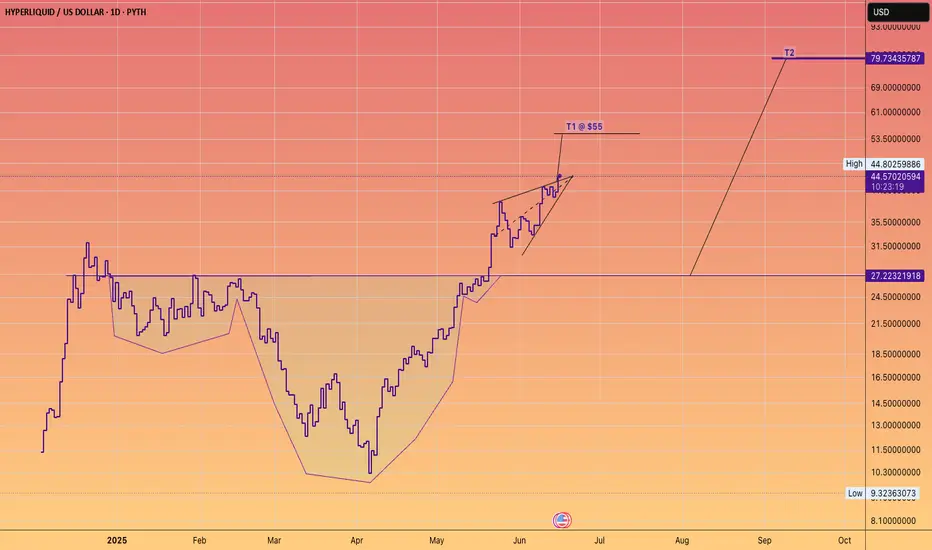
Don't fight the HYPE train!The James Wynn saga was wonderful advertising for the platform.
(Maybe it was staged).
Either way #Hyperliquid goes higher.
USDCHF → Retesting resistance will lead to a declineFX:USDCHF , having failed to reach its global target after breaking through support, is turning back to retest the zone of interest at 0.8157. A fall in the dollar could trigger a decline in prices...
After breaking through support and falling to 0.8055, a correction is forming towards the zone of interest and liquidity at 0.8157. After reaching the local target, the price may return to the global target (liquidity zone) at 0.8042.
The dollar returned to its downward phase at the opening of the session, to which the forex market reacted accordingly. Most likely, bearish pressure may also affect the USDCHF currency pair, which continues to follow the downward trend.
Resistance levels: 0.8157
Support levels: 0.8055, 0.8042
A retest of resistance amid high volatility could form a false breakout (liquidity capture) before the decline continues within the downtrend.
Best regards, R. Linda!

SYRUP consolidates for rallySYRUP - is testing ATH while the crypto market is in correction. We can conclude that this coin is stronger than the whole market and can continue its rally after accumulating the right potential.
Focus on the mirror support level 0.4600 - the round number gives strength to this level. After a false breakdown, the coin is consolidating in the buying zone. A break of the downside resistance will trigger a rally
Scenario: If the consolidation above 0.4600 continues and the coin breaks the downside resistance, a breakout and consolidation above 0.49450 will attract new buyers, which will only strengthen the rally.

PIPPIN/USDT Long Setup Update!!PIPPIN Breakout Alert – 100% Potential on the Table
Hey Traders — if you're into high-conviction setups with real momentum, this one’s for you.
PIPPIN is breaking out from a falling wedge pattern on the 4H timeframe after a long period of consolidation. This structure typically signals a potential reversal with strong upside momentum.
With the recent breakout, we’re looking at a fresh long opportunity:
Entry:
Current levels: 0.0172 and add more up to $0.0155
Stop-Loss:
Below support: 0.0141
Targets:
Target 1: 0.0336
Target 2: 0.0450
Target 3: 0.0550
Target 4: 0.0650
✅ Risk-reward remains highly favorable from this point.
✅ Tight stop-loss to manage risk in case of any invalidation.
✅ Watch for confirmation above immediate resistance for further strength.
Disclaimer: Always manage your position size and risk. Trade safe!

USDJPY – 4H . [[ TRIANGLE PATTERN ]]Technical Breakdown:
Symmetrical triangle pattern clearly formed with clean ABCDE wave structure.
The price has broken out from the upper resistance (trendline), confirming a bullish breakout scenario.
Next key area to watch is the supply zone near 145.800 – 146.200, where price may either:
Face resistance and retrace,
Or break through for continuation.
---
🔍 Key Levels:
Support Base (Retest zone): ~143.000
Breakout Entry Trigger: Above 144.200
Supply Zone Target: 145.800 – 146.200
Invalidation Level (Break Below Triangle): <142.500
---
🧠 Analysis Insight:
This is a classic triangle consolidation breakout, with price respecting both ascending and descending boundaries before thrusting upward.
Look for possible pullback retest entries before continuation to the supply zone.
Volume and momentum confirmation on breakout is key for sustainability.
---
🎯 Strategy Note:
Use low-risk entry setups on breakout retest.
Ideal for scalp to swing trades, with strong risk-reward structure.
