USDCHF Forms Falling Wedge Pattern Near Support GapOn the 1-hour chart, USDCHF is currently forming a falling wedge pattern, a classic technical formation that often precedes a bullish breakout. Price action is compressing within a narrowing range, marked by two downward-sloping trendlines.
Key observations:
A price gap from May 10 still remains unfilled, serving as a potential area of interest for buyers. The market may look to revisit and react to this level.
The lower boundary of the wedge has acted as strong support, with multiple rejections suggesting demand interest.
A break above the upper trendline of the wedge would confirm a potential reversal, with bullish momentum likely accelerating toward the 0.8465 resistance level.
Bullish Scenario:
Breakout Entry: Wait for a decisive breakout and candle close above the upper wedge boundary (around 0.8340–0.8350).
Target 1: 0.8465 (recent swing high and gap origin)
Stop Loss: Below the recent swing low near 0.8280 or just under wedge support (0.8260)
Alternative Scenario:
If the wedge support breaks down with strong bearish momentum, the price may slide lower to retest deeper support near 0.8200.
This setup favors bulls only if the wedge breakout is confirmed. Conservative traders may wait for retest confirmation before entering long positions.
Wedge

CADJPY - Bearish Rising WedgeHello Traders !
The CADJPY price formed a rising wedge pattern.
The price broke the support line.
So, I expect a bearish move📉
_______________
TARGET: 103.655🎯

PRME, Falling wedge PRME is beginning to emerge from the descending wedge pattern, accompanied by strong trading volume.
The initial target is 1.65, which must be surpassed with significant volume to reach the second target of 3.28 and then 5.60.The stop loss is set at 1.09

The USD/JPY pair is at a critical junctureThe USD/JPY pair is at a critical juncture within a broadening formation. Traders should monitor key support and resistance levels closely. A break below support may signal further downside, while a move above resistance could indicate a bullish reversal. Given the current indicators and economic data, a cautious approach with well-defined risk management is advisable.

GBPJPY Rising Wedge Bearish Reversal Pattern with Trade PlanGBPJPY Rising Wedge Bearish Reversal Pattern with Trade Plan

Rising wedge on SPY - Melt up? or Next leg down? Immediate Bias (Tomorrow):
Scenario 1 – Bullish Continuation (Low Probability unless there's a macro catalyst):
Breaks above ~$596–$598 cleanly
Retests that zone as support (watch 595.50 intraday)
Then targets:
600 psychological
604–608 upper resistance channel
Possible end-of-month blow-off top: 612–618
Scenario 2 – Pullback / Rejection (More Probable Setup):
Rejected at ~596–597 zone (which aligns with upper wedge resistance)
Breakdown below $590 intraday
Then targets:
587.80 EMA cluster (20/50)
If lost → 576.44 next EMA + demand level
Followed by major support at 565.87 / 563.43
🔥 Week Ahead Trade Plan (May 20–24)
✅ Bullish Possibility:
If NVDA earnings, FOMC minutes, or macro data surprise to the upside
Watch for breakout above the red wedge and hold above 600
Target range: 604 → 612 max upside
🚨 Bearish Scenario:
Wedge breakdown below ~$590
Momentum cracks down to:
587
576 (watch for bounce)
If panic selling → 565–563 (larger time frame buying zone)
Volume divergence and overbought EMAs support a potential cool-off.
📅 Monthly Projection (End of May):
If wedge breaks down → consolidation range between 563 – 587
If wedge breaks out → blow-off rally up to 612–620, but likely to fade quickly
Fed commentary and NVDA earnings on May 22 will be major catalysts
📌 Key Levels
Type Price Notes
Resistance (R3) 612–618 Final upside blow-off zone (channel top)
Resistance (R2) 604 Overhead channel line
Resistance (R1) 595–598 Wedge top + major resistance
Support (S1) 587 EMA cluster + strong local demand
Support (S2) 576 Clean structure + prior breakout
Support (S3) 565–563 Confluence of long-term EMAs + trendline
🎯 Trade Setups
📉 Bearish (Favored if no breakout tomorrow):
Short 595–597 with stop above 600
Targets: 587 → 576
Optional: Add below wedge break (~590)
📈 Bullish (Confirmation-based):
Break + retest of 597–600
Target: 604, then scale out at 612
Avoid front-running long unless you see volume + price close outside wedge

GOLD → Retest of trend resistance before declineFX:XAUUSD is recovering amid uncertainty, but there is a fairly strong resistance zone ahead that could hold back growth and trigger a decline...
Since the opening of the session, the price has recovered slightly after a week-long decline. Growth is being held back by two-sided risks: on the one hand, pressure on the dollar and Moody's downgrade of the US credit rating are supporting the metal, while on the other hand, high bond yields and possible US trade agreements are limiting growth.
Investors are awaiting new statements from the Fed and are monitoring US negotiations with key partners. Amid concerns about fiscal stability and weak economic data, gold may remain in positive territory, but positive trade news could turn it down again.
Resistance levels: 3257, 3265
Support levels: 3206, 3153
A false breakout of the specified resistance will confirm the inability to continue growth. Consolidation after a false breakout of 3257 - 3265 below 3257 could trigger a reversal and a fall to areas of interest...
Best regards, R. Linda!

USDJPY → Support retest. Is the trend continuing?FX:USDJPY is storming key support within the local downtrend. Pressure is intensifying the dollar's decline...
The dollar index is beginning to fall, which is also reflected in the currency pair.
Selling pressure is intensifying. A local downtrend is forming, with an attempt to break through key support at 144.82, below which the path to 143.4 - 142 opens up. Consolidation of the price below 144.82 could intensify the sell-off.
Resistance levels: 145.34, 146.07
Support levels: 144.82, 143.44, 142.35
Global and local trends are downward, and the fall of the dollar can only provide additional resistance, which will intensify the sell-off. A break of key support and consolidation of prices below 144.82 will trigger further sell-offs.
Best regards, R. Linda!

NZDJPY: Another Bullish Confirmation 🇳🇿🇯🇵
If you remember, I already posted a bullish outlook for NZDJPY on Friday.
This morning, I spotted one more intraday bullish confirmation.
I see a breakout of a resistance line of a bullish flag pattern on an hourly time frame.
I expect a bullish movement at least to 85.9 level soon.
❤️Please, support my work with like, thank you!❤️
I am part of Trade Nation's Influencer program and receive a monthly fee for using their TradingView charts in my analysis.

ETH's situation+ Target PredictionThe COINBASE:ETHUSD is in a Bullish phase by a Falling Wedge Pattern.
A falling wedge indicates the potential for price to reach to $2750.
Note if the Wedge Pattern is broken downwards with the strength of Bearish candles , this analysis of ours will be failed.
Give me some energy !!
✨We spend hours finding potential opportunities and writing useful ideas, we would be happy if you support us.
Best regards CobraVanguard.💚
_ _ _ _ __ _ _ _ _ _ _ _ _ _ _ _ _ _ _ _ _ _ _ _ _ _ _ _ _ _ _ _
✅Thank you, and for more ideas, hit ❤️Like❤️ and 🌟Follow🌟!
⚠️Things can change...
The markets are always changing and even with all these signals, the market changes tend to be strong and fast!!

ES1! (S&P500 Mini Futures) - Support Trendline Price Test -DailyES1! (S&P500 Mini Futures) price is currently testing a support trendline around $5900.
If several daily Price candles close below $5865 this month, a pullback in the price can occur (rising wedge pattern).
Volume has been decreasing in May 2025, compared to March and April.
Finance and Technology corporate earnings season has passed. The U.S. government 90-day tariff pause is set to expire in early July (pending trade deal negotiations with other countries).
Tariff and trade deal news, breaking news, corporate earnings, government law changes, consumer sentiment, inflation data, the FOMC, and presidential announcements can all affect the prices of stocks and ETFs.

GOLD consolidated below a key level on FridayGold is in a downtrend forming a counter-trend correction. Friday's trading session closes below the key level of 3203-3205. Buyers are weaker than sellers.
But, before the continuation of the fall MM is quite likely to test the resistance to provoke ordinary buyers before the fall
Scenario: the growth attempt may turn out to be false. A retest of 3203 resistance, a false breakout and price consolidation below 3203 is a sell signal.
Additional scenario: MM trap to provoke buyers to buy. A retest of the far resistance 3230, a false breakout and a price fixing below 3223 could start a decline

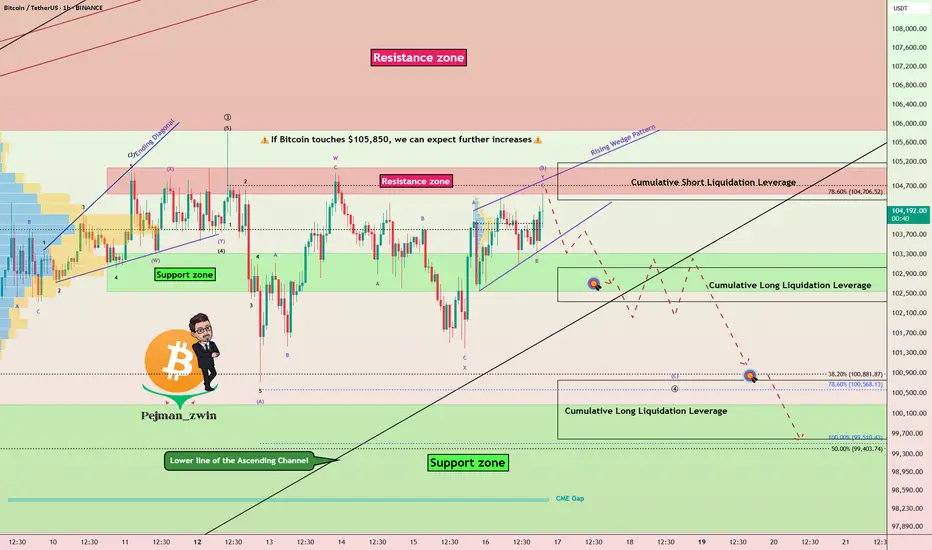
Bitcoin at Resistance With Weak Momentum-Bearish SetupBitcoin ( BINANCE:BTCUSDT ) finally reached the Resistance zone($105,100-$104,520) as I expected yesterday. Of course, the way Bitcoin reached the resistance zone was NOT with high momentum , so I decided to share this analysis with you.
In terms of Classic Technical Analysis , Bitcoin appears to have formed a Rising Wedge Reversal Pattern between Support zone($103,320-$102,600) and Resistance zone($105,100-$104,520) over the past few hours .
In terms of Elliott Wave theory , given Bitcoin’s low momentum and the Heavy Cumulative Short Liquidation Leverage($105,180-$104,412) ahead of Bitcoin, it appears that Bitcoin has completed microwave B of the main wave 4 with a Double Three Correction(WXY) .
I expect Bitcoin to decline to at least $102,800 at the first target AFTER breaking the lower line of the Rising Wedge Pattern, and if the Support zone($103,320-$102,600) and lower line of the ascending channel(Major) are broken, we should expect a drop to Cumulative Short Liquidation Leverage($100,763-$99,600) .
Note: If Bitcoin touches $105,850, we can expect further increases.
Please respect each other's ideas and express them politely if you agree or disagree.
Bitcoin Analyze (BTCUSDT), 1-hour time frame.
Be sure to follow the updated ideas.
Do not forget to put a Stop loss for your positions (For every position you want to open).
Please follow your strategy and updates; this is just my Idea, and I will gladly see your ideas in this post.
Please do not forget the ✅' like '✅ button 🙏😊 & Share it with your friends; thanks, and Trade safe.
Caught her playin’ both sides but trust me, she’s loyal in sellPrice be flirtin’ with that support — but yo, don’t get cozy, it’s fakin’ love before the real drop hits!”
Breakdown:
Bearish wedge structure
Liquidity grab incoming
Two clean selling zones
Targeting that juicy demand block below
Smart money’s movin’ silent. You ready or you sleepin’ on it?

EUR_AUD BULLISH WEDGE|LONG|
✅EUR_AUD made a bullish
Breakout from the bullish
Wedge pattern and the
Breakout is confirmed so
We are bullish biased and
We will be expecting a
Further bullish move up
On Monday when the
Market reopens
LONG🚀
✅Like and subscribe to never miss a new idea!✅
Disclosure: I am part of Trade Nation's Influencer program and receive a monthly fee for using their TradingView charts in my analysis.

ABNB close to huge breakoutABNB is poised to have a huge breakout, this massive wedge reminds me of the Tesla multi year consolidation and breakout. With the new version of ABNB we should see increased cash flows at they attempt to integrate more experiences into the platform. Need a chef for a luxury weekend? They will also have experiences for locals to try to make it a one in all app for many things. My fib extension is at 225. Remember this is a monthly chart and will take some time.

$WIFUSDT pushing towards $1.50BINANCE:WIFUSDT shows a bullish breakout from a descending wedge pattern following a strong uptrend. This suggests a high probability of continued upward momentum, with the primary target being the resistance zone around $1.50 already marked out on the chart with a yellow line.
TP1: $1.20
TP2: $1.50
Kindly support this analysis to enable it reach to other people, and do comment your thoughts.

EUR-AUD Bullish Breakout! Buy!
Hello,Traders!
EUR-AUD has formed a bullish
Wedge pattern and now we are
Seeing a bullish breakout which
Is confirmed so we are bullish
Biased and we will be expecting
A further bullish move up
Buy!
Comment and subscribe to help us grow!
Check out other forecasts below too!
Disclosure: I am part of Trade Nation's Influencer program and receive a monthly fee for using their TradingView charts in my analysis.

Bitcoin can drop from wedge to 100K pointsHello traders, I want share with you my opinion about Bitcoin. After consolidating for an extended period within a triangle pattern, the price eventually broke out with strong bullish momentum. The move was supported by a solid rebound from the buyer zone and a clean breakout above the 92800 - 94200 support area. This breakout initiated a steep climb, forming a new upward wedge structure, defined by narrowing trend lines and rising local highs. Currently, the price is trading near the resistance boundary of the wedge, around the 104000 - 105000 zone. This zone has already triggered one rejection and is showing signs of weakening bullish strength. Given the rising wedge geometry and the fading impulse strength, the risk of a correction is increasing. The current structure typically leads to a pullback, especially after such a steep rise. I expect that BTC may rise to the resistance line of the wedge and then drop below the support line, thereby exiting from this pattern. That's why I set my TP 1 at the 100K points. Please share this idea with your friends and click Boost 🚀

Gold Bullish Outlook - Gold BullishFollowing strong buying momentum observed yesterday, gold is currently consolidating within a falling wedge pattern — a typically bullish setup. A breakout from this pattern could trigger a fresh upward move in the price of gold.
Post-Breakout Bullish Targets:
Target 1: 3230
Target 2: 3240
Target 3: 3250
Target 4: 3275
Disclaimer: This is a technical analysis-based outlook. Please assess your risk-to-reward ratio and follow your individual trading strategy. This is not financial advice — trade responsibly and according to your plan.

Long Swing Idea – Waiting on Confirmation at Wedge SupportRefining the previous idea: Price is holding the lower boundary of an Ascending Broadening Wedge, showing signs of support rejection. However, we’re noticing a clear decline in bullish momentum. No rush to enter—we wait for strong confirmation before committing to a swing long. A solid reaction or breakout of a minor structure will be the signal. Until then, patience is the edge.

Bitcoin Ascending Triangle (4H)BINANCE:BTCUSDT might be forming an ascending triangle on the 4H chart, with a horizontal resistance at $105k and support being the resistance of the broadening wedge we identified last week: Bitcoin Ascending Broadening Wedge (4H)
A sustained break above $105k would set the target at $109k, very close to ATH.

OP/USDT Breakout Alert!!🚀 OP Breakout Alert – 100% Potential Incoming?! 👀🔥
Hey Traders! If you're all about high-conviction plays and real alpha, smash that 👍 and tap Follow for more setups that actually deliver! 💹💯
OP has successfully broken out from the falling wedge pattern on the daily timeframe, which historically signals a strong trend reversal. After retesting the breakout zone, price action looks ready for a fresh upside move!
🔹 Entry: CMP and add more up to $0.76
🎯 Targets:
→ $0.98
→ $1.21
→ $1.43
→ Final Target: $1.64
🛑 SL: $0.688
⚙️ Leverage: Low leverage (Max 5x)
📊 Structure:
Falling wedge breakout ✅
Retest holding strong ✅
Volume starting to pick up 📈
We’re watching closely—this setup has the potential to mimic the last 114% rally. Let's see how it unfolds! 🚀
💬 What’s your take on OP from here?
