DEXE/USDT: FALLING WEDGE BREAKOUT!!DEXE Breakout Alert – 80% Move Loading?
Hey Traders! If you're into high-conviction plays and real alpha — hit that like and tap Follow for trade setups that actually deliver.
DEXE has broken out of a falling wedge pattern on the daily timeframe and has successfully retested the breakout level. The structure looks strong, and momentum is starting to build.
Entry Zone: $13.4 – $14.4
Targets: $16.1 / $18.2 / $21.2 / $24.4
Stop-loss: $12.60
Leverage: Use low leverage (Max 5x)
This could be the beginning of a powerful upward move.
Keep this setup on your radar and manage risk accordingly.
Let me know your thoughts or if you're riding this one too.
Wedge

Break down Were gunna go back down in ethfor a short period were getting a retest of the upwar slope if we get rejected looking at 20% move downwards

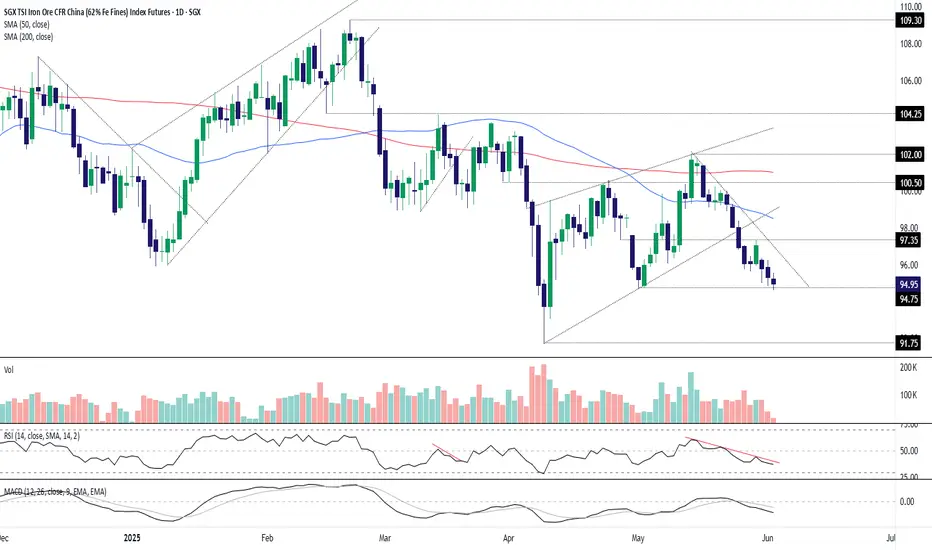
Bearish Iron Ore Bias Intact, Watching $94.75SGX iron ore looks heavy, threatening to extend the bearish break that began a week ago. The test and rejection at horizontal resistance at $97.35 last Thursday only adds to the bearish picture from momentum indicators like RSI (14) and MACD, reinforcing the bias to sell pops and downside breaks.
The price now finds itself at an interesting spot on the charts, sitting just above $94.75 after briefly dipping below it during thin overnight trade on Monday. While the bias remains lower, subdued volumes on either side of the weekend serve as a warning not to get overly bearish without a clear catalyst.
If the price can take out the overnight low and hold below $94.75, consider initiating shorts beneath the level with a stop above, targeting a potential retest of the April 9 low at $91.75.
Alternatively, if $94.75 continues to attract buyers, the setup could be flipped with longs established above the level with a stop beneath for protection. Downtrend resistance kicks in around $97, just above resistance at $97.35. They’re two potential targets.
Good luck!
DS
EURGBP Wave Analysis – 2 June 2025
- EURGBP broke daily Falling Wedge
- Likely to rise to resistance level 0.8525
EURGBP currency pair recently broke the resistance trendline of the daily Falling Wedge chart pattern from April, which encloses the earlier ABC correction (2).
The breakout of this Falling Wedge continues the active impulse wave (3), which started earlier from the key support level 0.8350.
EURGBP currency pair can be expected to rise to the next resistance level 0.8525 (which reversed the price twice at the start of May).

SOLANA It has good growth potential in midtermThe SOL will increase $150 and reach to the top of the wedge in the coming weeks .
Give me some energy !!
✨We spend hours finding potential opportunities and writing useful ideas, we would be happy if you support us.
Best regards CobraVanguard.💚

EURUSD Forms Rising Wedge + Evening Star_ Bearish SetupAs I expected in the previous idea , the EURUSD ( FX:EURUSD ) started to rise after breaking the upper line of the descending channel and hit the Long Position target with Risk-To-Reward: 1.46 .
The EURUSD is trading near the Resistance zone($1.149-$1.142) .
From a Classic Technical perspective, EURUSD appears to be completing a Rising Wedge Reversal Pattern . Also, a good sign for a EURUSD reversal is the formation of an Evening Star Candlestick Pattern near the upper line of the rising wedge pattern.
Also, we can see the Regular Divergence(RD-) between Consecutive Peaks .
In terms of Elliott Wave theory , I think the EURUSD corrective waves are NOT over yet, and it seems that EURUSD has completed the main wave X inside the rising wedge pattern.
I expect EURUSD to decline to at least $1.126 AFTER breaking the lower line of the wedge pattern.
Note: If EURUSD touches $1.14903 , we can expect more pump.
Please respect each other's ideas and express them politely if you agree or disagree.
Euro/U.S. Dollar Analyze (EURUSD), 4-hour time frame.
Be sure to follow the updated ideas.
Do not forget to put a Stop loss for your positions (For every position you want to open).
Please follow your strategy and updates; this is just my Idea, and I will gladly see your ideas in this post.
Please do not forget the ✅' like '✅ button 🙏😊 & Share it with your friends; thanks, and Trade safe.

Small Clues In A Big Breakout PatternSilver has been consolidating as of late and if there's one thing we no about contraction is that it eventually leads to expansion aka a breakout.
The issue with this particular setup is that based on location of the pattern, there's no predetermined directional bias for the breakout.
Therefor, what we're doing today is looking for small clues that the market has provided to give us any type of edge in predicting a breakout one way or another and guess what. WE FOUND SOME!
If you have any questions or comments, please leave them below!
Akil

A Different Way To Use the RSI To Trade Deceleration Patterns A deceleration pattern is a pattern that forms at the end of a directional move as it starts to lose steam. 2 good ones to learn are the rising/falling wedge & channel.
The problem wit these patterns however, is that it can sometimes be difficult to tell when that final reversal may come backing it hard to place stops.
Lately, and by that I mean for the past year or so, I've been tracking a very specific pattern on the RSI (Relative Strength Index) indicator to help me with these situations.
Please LIKE & SHARE and if you have any questions or comments, leave them below
Akil

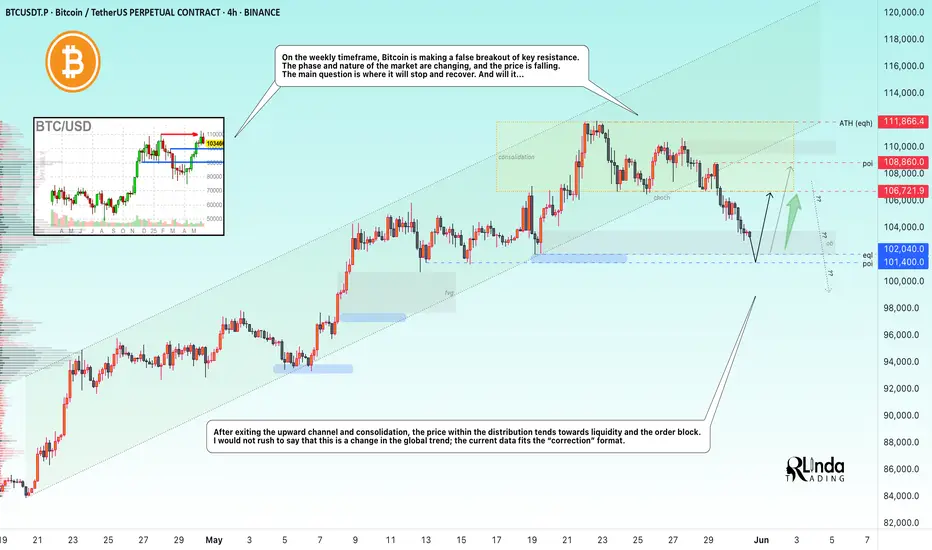
BITCOIN → Correction or trend reversal? Why is 101K important?BINANCE:BTCUSDT.P is exiting the upward channel after a false breakout of the key resistance level of 110K (previous ATH). Liquidation?
Quite an interesting situation with James Wynn. As they say, money loves silence, especially when it comes to a highly manipulated market... A week after the whale's actions, Trump decided to play the market again by creating emotional swings: he announced tariffs on the EU, canceled them, then made claims against China and is now ready to reintroduce tariffs on the EU. Things didn't end well with James... Liquidation before the rally?
On the weekly timeframe, Bitcoin is making a false breakout of the key resistance level of 110K. The phase and nature of the market are changing, the price is falling, breaking the structural support of 106500. The main question is where the stop and recovery will be. And will there be one...
After exiting consolidation and the upward channel, the price within the distribution is moving towards liquidity and the order block. I would not rush to say that this is a change in the global trend; the current data fits the “correction” format.
Support levels: 102000, 101400
Resistance levels: 106700, 108800
102-100K is a fairly important zone for the market; a breakout in this area could open the way to a (local) bottom. Bulls may not be able to hold the market, in which case a global sell-off could form. Therefore, I believe that retesting the 102000 level will end with a liquidity grab and a correction along the trend, during which the price may test the 106K - 108K level, which will determine the future of the market: consolidation, growth, or decline...
Best regards, R. Linda!
TAOUSDT at a Crucial Level – Breakout or Breakdown?Yello, Paradisers! Is TAOUSDT gearing up for a strong bounce, or is a deeper correction on the horizon? Let’s break it down.
💎TAOUSDT has completed a healthy retracement, forming a descending channel alongside a Dragon Butterfly candlestick pattern—both backed by high volume. Historically, when this pattern appeared with strong volume, we saw a solid upside move. This time, we also have a bullish divergence, adding confluence to the bullish case. However, to increase the probability of a breakout, we need to see price breaking above the descending channel with strong volume.
💎Now, what if price drops further or shows panic selling? In that case, we must wait for clear bullish confirmations before jumping in. Ideal signals include - Bullish I-CHoCH formation, W pattern or Inverse Head and Shoulders on lower timeframes. Any of these would significantly increase the probability of a strong bounce from the strong support zone.
💎 However, If price closes a candle below the strong support zone, it will invalidate our bullish outlook. If that happens, the best move is to stay patient and wait for better price action before considering any long positions.
🎖Patience is what separates pros from amateurs. If you want to make it in this game, trade smart, stay disciplined, and always wait for high-probability setups. The market will always test your emotions—don’t let it break your strategy.
MyCryptoParadise
iFeel the success🌴

Shiba INU - Bottom Buy confirmed istorical Pattern Repetition (2024 & 2025):
The chart suggests that SHIB is following a repeated pattern cycle:
Stage 1 – Falling Wedge (Completed)
Stage 2 – Cup and Handle (Completed)
Stage 3 – W Pattern (Recently Completed)
Stage 4 – Inverted Head and Shoulders (Pending Formation)
Key Highlights:
✅ Buying Zone Identified between 0.00001167 – 0.00001271 USD.
🎯 New Target: 0.00002431 USD, representing a potential 90% return from the buying zone.
⚠️ Breakout Awaited: Stage 4 pattern (Inverted Head and Shoulders) is pending confirmation, which could trigger a major upward move.
🔄 Emphasis on pattern repetition to project future price action.
Conclusion:
The chart analysis suggests that SHIBA INU is mirroring its previous bullish cycle. With three bullish stages already complete and the fourth (inverted head and shoulders) pending, a breakout could lead to a significant price rally targeting 0.00002431 USD.

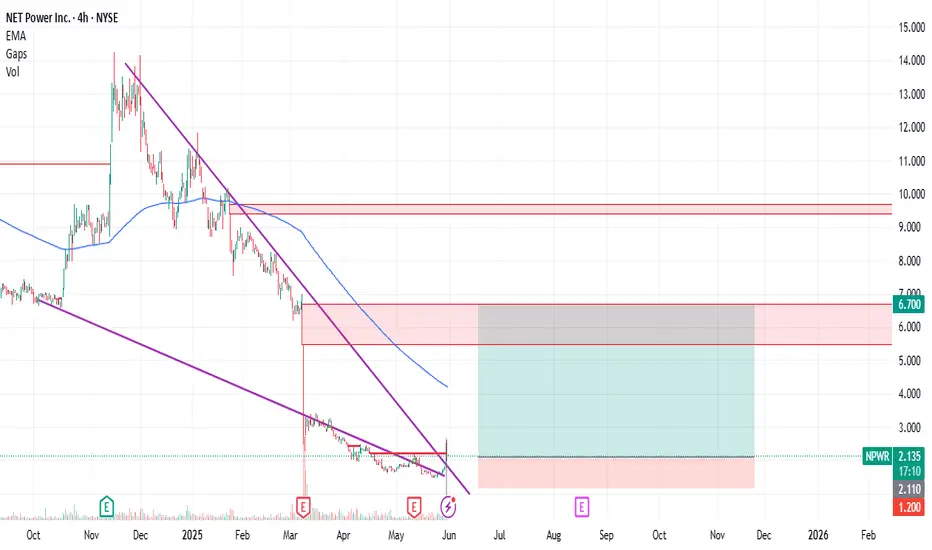
NPWR : Small Position Size Play with 5.00 Risk-Reward RatioNet Power Inc. NPWR stock has seen high volume and a tendency to break the falling wedge. Can this initiative close the gap that ended at 6.7 ?
This traded can be tried with very small position size.
Because Stop-Loss and Target are very wide.
Risk-Reward Ratio : 5.00
Stop-Loss : 1.20
Target: 6.70
ETHEREUM Wedge Breakout! Sell!
Hello,Traders!
ETHEREUM was trading in an
Uptrend but then the coin
Formed a bearish wedge pattern
And we are now seeing a bearish
Breakout so we are locally
Bearish biased and we will be
Expecting a long awaited
Bearish correction
Sell!
Comment and subscribe to help us grow!
Check out other forecasts below too!
Disclosure: I am part of Trade Nation's Influencer program and receive a monthly fee for using their TradingView charts in my analysis.

USDCAD: Bearish After the News 🇺🇸🇨🇦
USDCAD looks bearish after a release of today's fundamental news.
A bearish breakout of a rising channel on a 4h time frame
and a strong selling reaction after its retest provide
a reliable bearish continuation.
I think that the price may drop to 1.3743 support.
❤️Please, support my work with like, thank you!❤️
I am part of Trade Nation's Influencer program and receive a monthly fee for using their TradingView charts in my analysis.

Can this be a fakeout?Xrp is forming a perfect falling wedge. Is this a fakeout and a bear trap or a real breakdown?
Probability for falling wedge to break to the upside is around 70%.

BITCOIN (BTCUSD): A Deeper Correction?!
After Bitcoin updated the All-Time High, the market became
weak and exhausted.
A violation of a support line of a rising channel and a breakout
of a key horizontal support indicate a highly probable continuation
of a correction.
Our closest demand zone is 103200. It can be the goal for the sellers for now.
❤️Please, support my work with like, thank you!❤️

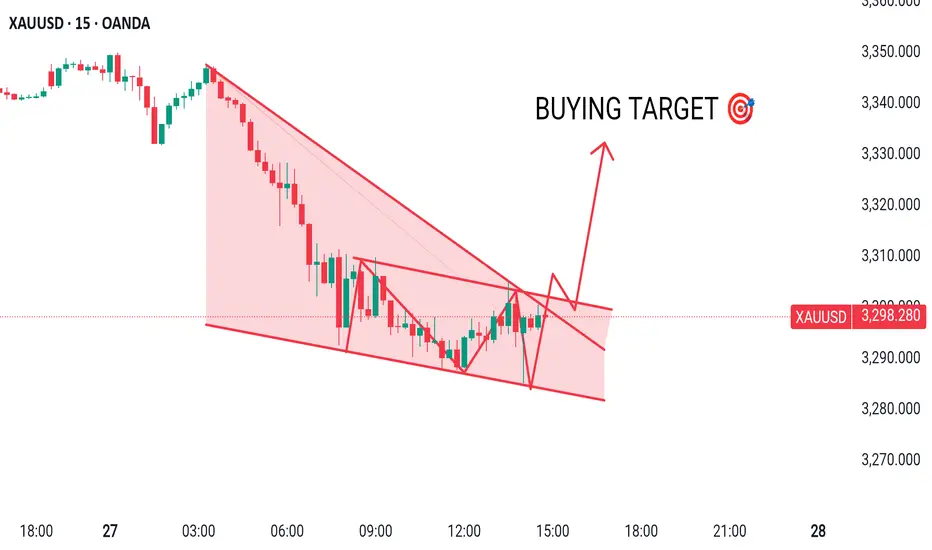
XAUUSD MADE FALLING WEDGE & DESCENDING PATTERNHere I Created This XAUUSD Chart Analysis
Pair : XAUUSD (Gold)
Timeframe: 15 - Minutes
Pattern: FALLING WEDGE
Momentum: BULLISH/ BUY
Entry Level : BUY 3297
SUPPORT zone : 3285
Target Will Be : 3330
Disclaimer : This signal is based on personal analysis for learning purposes. Trade at your own risk and always use proper risk management.
CAD-CHF Bearish Wedge! Sell!
Hello,Traders!
CAD-CHF formed a bearish
Wedge pattern and now we
Are seeing a powerful breakout
Which is confirmed so we are
Locally bearish biased and
We will be expecting a
Further bearish move down
Sell!
Comment and subscribe to help us grow!
Check out other forecasts below too!
Disclosure: I am part of Trade Nation's Influencer program and receive a monthly fee for using their TradingView charts in my analysis.

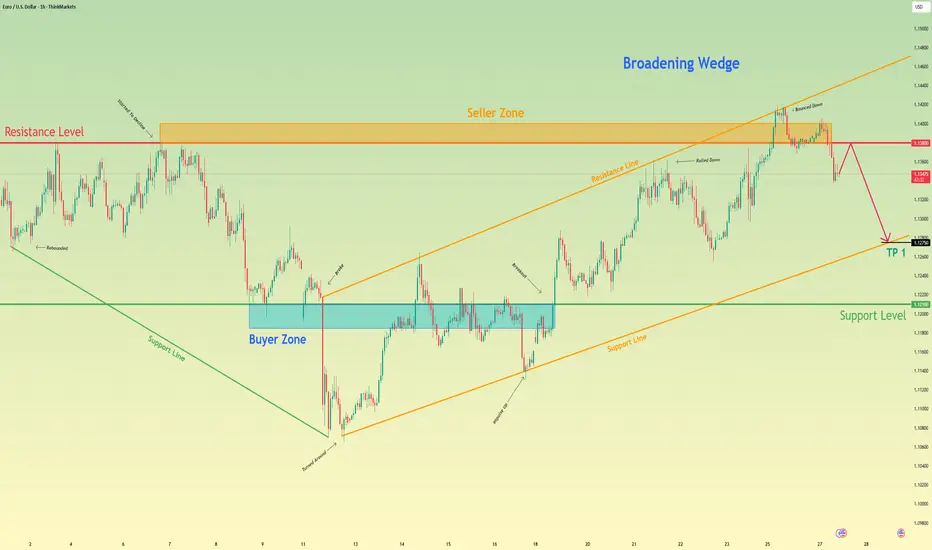
Euro may grow to resistance level and then drop to 1.1275 pointsHello traders, I want share with you my opinion about Euro. After forming a strong upward move from the buyer zone (1.11850–1.1210), the price rose sharply, broke the mid-range resistance, and entered the seller zone between 1.1380 and 1.1400. Once it reached the upper boundary of the broadening wedge, the price bounced down from resistance at 1.1380. Now the price is trading inside a broadening wedge, showing signs of a potential reversal. After failing to hold above resistance, the Euro started to decline from the seller zone, confirming selling pressure. The current movement points to a correction within the wedge structure. I expect the Euro will continue falling toward 1.1275, my TP 1, where the support line of the wedge coincides with the upper boundary of the previous buyer zone. This zone has already shown strong reactions before and could act as a short-term reversal area. Given the recent rejection from resistance, the broadening wedge formation, and return from the seller zone, I remain bearish and anticipate further decline. Please share this idea with your friends and click Boost 🚀
Disclaimer: As part of ThinkMarkets’ Influencer Program, I am sponsored to share and publish their charts in my analysis.
DOGEUSDT → Long squeeze before growth?BINANCE:DOGEUSDT.P is consolidating. A range with clear boundaries has formed. Before a possible breakout, a liquidation (false breakdown) may form
On D1, the structure is quite positive. Earlier, the price tested the downward resistance, but there was no reaction (fall) as such. Instead, the price is consolidating within the range of 0.211 (0.205) - 0.23 - 0.253.
Bitcoin, like the entire crypto market, is consolidating within fairly clear boundaries. Based on the current situation, it would be logical to wait for one part of the market to be liquidated before the price can move in either direction. Based on the bullish market, there may be a retest of support in the form of a false break...
Resistance levels: 0.2308, 0.253
Support levels: 0.213, 0.2116, 0.205
DOGE is consolidating with a focus on the 0.23–0.211 range. Against the backdrop of a bullish trend, a liquidation (long squeeze) relative to the lower boundary of the 0.23–0.205 range is possible before growth continues. A false break of support and liquidity capture would be useful maneuvers before implementation. However, if the market is aggressive enough and resistance at 0.23 is broken with subsequent consolidation above this level, it could trigger premature growth.
Best regards, R. Linda!

WATCH OUT FOR VERITASKAPFrom around 0.83, VERITASKAP created an all-time high of around 1.81. This happened between August 2024 and September 2024. Then, price dropped into the discount level where is currently. The current price action shows that price is in a discount level, at a demand zone and within a falling wedge.
From a chart pattern perspective, falling wedge can be seen on the chart and a break out of the downtrend and resistance level around 1.06 with a bullish candle closing above these levels will serve as a strong indication that the stock is ready to rally up as much as the all-time high.
From a technical indicator perspective, awesome oscillator is below 0, showing that the stock is oversold. In addition, there is a bullish indication on the awesome oscillator as shown by its colour and upward movement. This is pointing to the fact that the value of the awesome oscillator is moving towards 0 and can cross over it which can be a good indication for a rise in price as well.
From a smart money concept perspective, a break of the last high (around 1.27) that led to the last bearish internal break of structure will as serve as indication of a bullish trend. Hence, the target will the all-time high.
Either way, the stock has a good potential. An aggressive trader or investor may buy at the current market price. While a conservative trader or investor may wait for a breakout.
Watch out for the confluences indicating potential rise in price so as to not miss out on the benefit.

CADJPY: Bullish Continuation Confirmed 🇨🇦🇯🇵
Look how strongly CADJPY reacted to a recently broken
resistance that turned into a support after a breakout.
A bullish violation of a resistance line of a falling wedge on an hourly time frame
with a bullish imbalance confirms a highly probable growth.
The price will go up at least to 105.09
❤️Please, support my work with like, thank you!❤️
I am part of Trade Nation's Influencer program and receive a monthly fee for using their TradingView charts in my analysis.

Flying into the sun or about to get burnt?Market is about to reach all-time highs again. Many trade deals must have been made. Interest rates must have been cut. Wars must have been resolved. Personal debt must have come under control. Corporate debt must have been resolved.
Wait, nothing has changed? Things are worse? Well why is the index about to hit new all-time highs? My take is a major fake out. We are about to set a double top as we complete a rising wedge pattern.
The rising wedge.
What began at the market bottom on 7 April, has remained bound in a channel. If the first pump up was an A followed by the declaration of the channel bottom as B, wave C has last over a month upward. We have wave 3 signals identifying wave 3 of C ending with the high on 19 May. Last week's dip was wave 4 and now we fly high this week. It is unclear if we actually make a new all-time high or fall just short. The below chart has 138.197% extension around 610.63. Inside wave C, my wave 1 was nine days long, and wave 3 was only 8. This points to wave 5 lasting less than 8 days. A common wave 1-3-5 duration in relation to wave 3 is around 114% for 1 and 50% for wave 5.
The height of the rising wedge covers 66.82 points. This same distance should provide the first target bottom once we exit the channel, possibly as early as next week. Once the bottom falls, we then examine the double top pattern. Although the neckline stretches far backwards, the bottom is established at the 7 April low. The distance from the neckline to the all-time high in February provides the next possible minimum target bottom by taking this 131.43 drop and subtracting it from the neckline of 481.80. This puts the initial low around 350.37 sometime later this year or early next.
There is a perfect storm of calamity brewing with zero resolutions in place or even planned. Do we finally drop or keep rising into the sun?
