GOLD → Correction before possible growthFX:XAUUSD entered a liquidation phase (rally) within the trading range at the opening of the session. The dollar's rise is to blame. The focus is on supporting consolidation...
Investors remain interested in gold as a safe haven asset amid geopolitical risks and declining demand for US assets.
The key drivers remain news about tax reform in the US, trade negotiations, and upcoming macro data.
Gold is consolidating, but since the opening of the session, the price has been heading towards support. Against the backdrop of an upward trend, a trigger for bearish liquidity is likely to form before growth.
Against the backdrop of the dollar's growth, gold is entering a correction phase. At the moment, all attention is on support and the liquidity zone of 3265. A false breakdown will trigger a price buyback.
Resistance levels: 3322
Support levels: 3282, 3265
Since the price is still within the range and a countertrend correction is forming in the market, in our case, it is worth considering an intraband trading strategy. A false breakdown of support could trigger growth to intermediate resistance or to the upper border of the channel.
Best regards, R. Linda!
Wedge

JTO Approaching Breakout Point – Watch This Wedge!🚀 JTO Falling wedge Formation – 100%+ Potential Incoming?! 👀🔥
Hey Traders! If you're all about high-conviction plays and real alpha, smash that 👍 and tap Follow for more setups that actually deliver! 💹💯
JTO has been consolidating within a falling wedge on the daily timeframe for months and is now approaching the apex of the structure.
The price has shown strong demand around the $1.85–$2.00 support zone and is now attempting to push above the wedge resistance trendline.
Technical Highlights:
Falling wedge formation, typically a bullish pattern
Support holding firm at the $2.00 psychological level
Potential for a breakout retest and continuation if volume confirms
Trade Setup
Entry: CMP and add more in the green box(up to $1.8)
Targets: $2.48 / $2.84 / $3.30
Stop Loss: Below $1.85
Risk-to-Reward: Well-structured setup with defined invalidation
A confirmed breakout from this structure could open the door for a strong upside move. Keep an eye on volume and market momentum for confirmation.
What do you think about this? Share your views in the comment section.

EURCHF both scenarios possibles
OANDA:EURCHF UPDATE from first analysis (attached) we are have upside - downside moves, new trend line is created, sup zone is created (violet line) and we can see also long zone.
If we see break of 0.94000 we will be higly possible in bullish move, break of sup zone (violet line) we will can see bearish move.
Currently still giving higher chances for bearish trend, but lets see some stronger moves.
SUP zone: 0.93850
RES zone: 0.92750, 0.92550

GBPUSD SHORT IDEAGBPUSD has been rally up for a while. Currently, there's a divergence signal from the awesome oscillator on the daily timeframe. Switching to 4 hours timeframe, there's a clearer view of what's going on. Based on the 4 hours chart, rising wedge has been formed and there's also a bearish divergence signal from the awesome oscillator. In addition to these, price has mitigated a daily supply zone after taking out a significant high as a liquidity. Then, a bearish engulfing candlestick was formed, signifying potential reversal. On 1 hour timeframe, price has broken out of a rising wedge and retested it.
As a retail trader, one can enter a short position after the bearish engulfing candlestick confirmation. This aligns with the 1 hour breakout and retest. While one can wait for price to break out of the 4 hours rising wedge.
As a smart money trader, one can wait for a change of character and break of structure on the 4 hours timeframe to confirm that price has really changed its trend ready for a reversal.
Either way, one can take advantage of the potential short opportunity on GBPUSD.
Confluences for the short signal:
1. Bearish divergence signal from awesome oscillator on daily and 4 hours timeframe.
2. Rising wedge on 4 hours timeframe.
3. Price mitigating daily supply zone.
4. Price has taken out a significant high as a liquidity.
5. Bearish engulfing candlestick formation on 4 hours timeframe.
Disclaimer: This is not a financial advice. The outcome maybe different from the projection. If you can't accept the risk, don't take the signal.

BTC DOMINANCE AT CRUCIAL LEVEL! When Alt season? 🚀 Hey Traders! 👋
If you’re finding value in this analysis, smash that 👍 and hit Follow for high-accuracy trade setups that actually deliver! 💹🔥
Bitcoin dominance is once again hovering around the key resistance zone (~64%) that previously triggered a sharp rejection and boosted altcoins. 🚨
🟢 What we're watching:
Dominance bounced back after a breakdown from the rising wedge 📉
It's now retesting the breakdown zone (red resistance)
A rejection here = Altcoin Rally 🎯
A clean breakout above = Altcoins stay weak ⚠️
⏳ We’re at a decision point. Altcoin bulls are watching this zone very closely.
🧠 Our take:
Until BTC.D rejects from this level, don’t expect a full-blown Altseason. A strong red candle from here could open the floodgates for mid and low caps to run wild again. 🚀
📌 Stay patient, stay positioned. The move will be big—just a matter of “when.”

XAUUSD Breakdown from Rising Wedge - Watch Key Support at 3285Gold (XAUUSD) on the 4-hour chart has completed a bearish breakout from a Rising Wedge pattern, a formation often associated with potential trend reversals or corrections. The price action had been moving steadily higher within the wedge, but momentum began to slow down near the upper boundary, eventually breaking downward through the support line.
This breakout is visually confirmed with a small consolidation box before the move lower, indicating sellers are gaining control. The breakdown aligns with weakening bullish momentum, and sellers may target key horizontal supports next.
Key Levels to Watch:
Resistance: 3360 - Recent minor swing high and the wedge top.
Immediate Support: 3285 - Horizontal level where price may stall or bounce.
Lower Support Zone: 3210 - Previous structure support and demand area.
Trade Setup (Short Bias):
Entry: After retest of the wedge bottom or minor consolidation below 3285
Target 1: 3285
Target 2: 3210
Stop Loss: Above 3360 or the upper limit of the wedge (tight SL option around 3340)
Bias: Bearish
As long as price remains below the wedge and fails to reclaim 3360, the bearish outlook remains intact. Watch for price reaction at 3285. a clean break of this level could accelerate downside momentum.

UNIUSDT: A Massive Bullish Move Loading… or a Trap?Yello, Paradisers! Is UNIUSDT finally gearing up for a major breakout, or is this just another fake move before a deeper correction? Let’s break it down.
💎UNIUSDT is currently trading within a descending channel, increasing the probability of an upcoming bullish move. The key support zone is holding strong, and we might be witnessing the early signs of a double-bottom formation—a classic reversal pattern.
💎However, confirmation is everything in trading. To increase the probability in our favor, we need to see: Bullish divergence, Bullish I-CHoCH (Internal Change of Character), Bullish reversal patterns such as a W-pattern or inverse head and shoulders from our support zone.
💎If UNIUSDT retraces further, we expect a bounce from the strong support zone—but again, we must wait for clear bullish confirmations before taking any positions.
💎The invalidation level? If price breaks and closes candle below the strong support zone, the entire bullish setup gets invalidated. In that case, we wait patiently for better price action before considering any new trades.
🎖Patience and discipline are key, Paradisers. Many traders will get trapped in bad positions, but those who wait for the right confirmations will be the ones making money. Trade smart & stick to high-probability setups only.
MyCryptoParadise
iFeel the success🌴

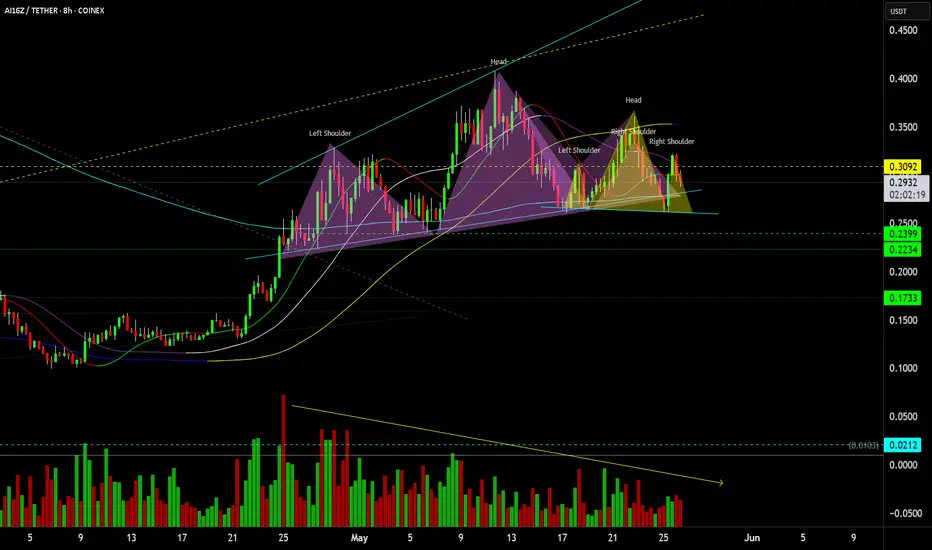
$Ai16z Multi Head & Shoulders top HTFAi16z has formed a HTF Head & Shoulders top with another Head & Shoulders forming within the right shoulder of the HTF H&S with declining volume over the primary formation, all within an Expanding Broadening Wedge top
Total Market Cap . Rising Wedge.Total Market Cap . Rising Wedge.
Visualisation of the Market cap. 4D .

EUR/GBP Bullish Breakout Forming – Falling Wedge & Retest SetupEUR/GBP has been in a prolonged downtrend over the past several weeks, characterized by lower highs and lower lows. However, the recent price action shows signs of exhaustion in selling pressure, as the candles begin to compress into a Falling Wedge pattern — a classic bullish reversal formation.
The wedge is defined by two descending, converging trendlines. As price moves closer to the apex of this wedge, volatility contracts and volume typically dries up (not shown here, but conceptually expected). This signals that market participants are preparing for a directional breakout, most likely to the upside in this context.
🔍 Key Technical Elements:
🔸 1. Falling Wedge Pattern:
The Falling Wedge is a bullish setup that forms during a downtrend and signals a potential reversal when confirmed. Price here has followed a steady decline, but the slowing momentum and structure of the wedge suggest the sellers are losing control.
The wedge acts as a compression zone, where bearish moves are becoming less impactful.
Price touches both upper and lower wedge boundaries multiple times, increasing pattern validity.
A breakout has already occurred, and the pair is now undergoing a textbook retest of the broken wedge resistance (now acting as support).
🔸 2. Retest at Key Support Zone (SR Interchange):
The retest is happening precisely at a former support/resistance flip zone, labeled SR – Interchange on the chart. This is a historically significant area where price has reacted multiple times, adding confluence to the setup.
If this level holds during the retest, it may invite strong buying interest, fueling the bullish breakout move.
🔸 3. Resistance Zones & Targets:
Inner Resistance (~0.8460): First hurdle for bulls; breaching this will signal strong momentum.
Minor Resistance (~0.85618): This is the primary target of the setup, based on previous structure and wedge height projection.
Major Resistance (~0.8740): A longer-term bullish objective if momentum sustains beyond the first two targets.
These zones serve as logical areas for profit-taking and reassessment.
📐 Measured Move & Target Projection:
The projected breakout target of 0.85618 is derived using a combination of:
The vertical height of the wedge at its thickest point.
Previous market structure resistance zones.
Fibonacci and price symmetry (if analyzed further).
This target also aligns with a previous supply zone, making it a strong magnet for price if bullish momentum kicks in.
💡 Trading Plan (Not Financial Advice):
This setup provides a good risk-to-reward opportunity if executed with patience and proper confirmation:
Entry Zone: After bullish confirmation at the retest (e.g., bullish engulfing candle, pin bar, or break of minor lower high).
Stop Loss: Below the SR Interchange zone or recent swing low (~0.8350–0.8360).
Target 1: Inner Resistance (~0.8460)
Target 2: Minor Resistance (~0.85618)
Target 3 (extended): Major Resistance (~0.8740)
🔄 Market Psychology:
This chart setup reflects a shift in momentum and sentiment:
Sellers have driven the price down consistently but have failed to create new significant lows with force.
Buyers are stepping in at key demand zones, creating higher lows within the wedge.
The breakout suggests smart money accumulation, and the current retest offers one of the last low-risk entries before a broader move.
🔔 Confirmation to Watch:
Bullish reversal candlestick patterns at the retest zone.
Break above local lower highs near 0.8440–0.8460.
Momentum indicators (if used) showing divergence or crossover confirmation.
📉 Bias:
Short-Term Bullish
Valid if support at 0.8390–0.8400 holds and price confirms breakout continuation.
🧠 Minds Post (Expanded Explanation)
Title: EUR/GBP Bullish Reversal Developing – Falling Wedge Breakout Retest
EUR/GBP has broken out of a textbook falling wedge on the 4H chart, which often signals the end of a downtrend and beginning of a new bullish phase. The price is currently pulling back, testing the breakout zone — a crucial step in confirming the validity of the breakout.
If this retest holds, we may see a sharp move toward the 0.8460 and 0.8560 levels — both key resistances based on past price action.
This pattern reflects a deeper market psychology shift — from consistent bearish dominance to a potential bullish takeover. Smart money may already be positioning here.
I’m watching for confirmation at the support zone around 0.8390. If price holds and breaks above local highs, a continuation toward the upper resistance is likely.
Let the market come to you. Don’t chase. Wait for structure, then trade with confidence.

EUR/USD Breakdown Imminent – Rising Wedge at Major ResistanceOn the 1H chart, EUR/USD has developed a Rising Wedge pattern, a classical bearish reversal formation. The pair has been moving higher within a tightening structure, marked by converging trendlines—indicating weakening bullish momentum.
What makes this pattern more compelling is that it’s occurring just below a well-defined Major Resistance Zone around 1.1380–1.1400, where previous attempts to break higher have failed. This area has historically acted as a strong supply zone, increasing the probability of a reversal.
🔍 Key Technical Components:
Rising Wedge Pattern: The wedge reflects a temporary uptrend with weakening strength. Bullish candles are getting smaller, and volume appears to be fading (not shown here but typically expected in this setup).
Black Mind Curve Support: A custom support curve illustrating the underlying parabolic trend. Once this is broken, it often leads to a steeper selloff.
Change of Character (CHOCH): Around the 1.1260 level, there's a possible shift from bullish to bearish structure. If price breaks and closes below this level, it will likely confirm a momentum reversal.
Target Projection: The measured move and previous structural support suggest a drop toward 1.11479, which coincides with a prior demand zone. This also aligns with a potential liquidity sweep beneath recent lows.
🔔 Price Action Signals to Watch:
Bearish engulfing candles or strong rejections from the wedge’s upper boundary.
Breakdown below the lower wedge line and the curved support.
CHOCH confirmation – market structure shift from bullish to bearish around 1.1260.
Retest of the wedge breakout level, followed by continuation to the downside.
📌 Trading Plan (Not Financial Advice):
Entry: On break and retest of wedge support.
Stop Loss: Above the wedge high or resistance (~1.1400).
Target: 1.11479 for first take-profit level; partials can be taken at 1.1260 if needed.
📉 Bias:
Short-Term Bearish – Only upon wedge breakdown and confirmation.
🧠 Minds Section (Expanded for Traders' Perspective)
EUR/USD is approaching a critical technical juncture. We are seeing a textbook rising wedge formation into a major resistance zone, signaling exhaustion of bullish strength. While the pair has enjoyed upward momentum, price action is showing signs of slowing, and the structure is no longer sustainable.
This pattern often traps late buyers before reversing. We are closely watching the lower wedge boundary and curved support—a breakdown here will likely trigger bearish momentum, especially with the CHOCH area near 1.1260 acting as a structure-defining level.
If sellers gain control and the breakdown confirms, there’s high probability for a fall to 1.11479, targeting prior demand zones and potential liquidity pockets.
Now is the time to be cautious if long, or begin planning short setups. Wait for confirmation—no need to rush the trade.

JPY/USD Rising Wedge Breakdown – Bearish Reversal in Play🔎 Technical Breakdown:
1. Rising Wedge Formation:
The pair has been trading within a Rising Wedge, a bearish reversal pattern that forms when price makes higher highs and higher lows but with diminishing momentum. The wedge is visible from the swing low on May 13, where price began to climb aggressively but within increasingly narrow price action. This narrowing range signals weakening bullish strength.
2. Key Resistance Zone:
The wedge forms right below a Major Resistance Zone marked earlier in the chart (around 0.007050), where price had previously faced heavy selling pressure. This adds confluence to the bearish bias, as the zone historically acted as a turning point.
3. SR Interchange Zone:
Below the wedge lies a Support-turned-Resistance (SR) Interchange level, a critical price area where past support may now act as resistance if the price attempts to retrace. This is a commonly watched level by institutional and technical traders.
4. Breakdown Confirmation:
The price has broken below the wedge's lower trendline, which is often considered the breakdown signal. A valid breakdown typically includes a close outside the wedge body followed by a retest or continuation.
5. Bearish Target:
The projected move is toward 0.006796, derived by measuring the wedge height and applying it from the breakdown point. This level aligns with a historical support zone, adding more confluence to the target.
🧠 Psychological & Structural View:
Bullish exhaustion: Buyers pushed price higher into resistance, but momentum slowed, signaling exhaustion.
Trapped longs: Traders who entered late in the wedge may now be trapped, potentially accelerating a sell-off as they exit.
Smart money behavior: Rising wedges near resistance often signal distribution by smart money before a drop.
🛠️ Trading Plan Suggestion (Not Financial Advice):
Entry: After a clear wedge breakdown, consider short entries on a retest of the broken trendline or a bearish candle confirmation.
SL: Above the wedge high or major resistance zone.
TP: Staggered exits below 0.006850 and final target around 0.006796.
🔁 What to Watch For:
Retest of the wedge breakdown (potential short entry zone)
Momentum confirmation via volume or bearish candles
Price reaction at SR Interchange and final support target
🧠 Minds Section – Condensed Summary
JPY/USD formed a Rising Wedge below major resistance, signaling bullish exhaustion. Price has broken down from the wedge, confirming bearish momentum. A clean breakdown targets 0.006796, with SR interchange acting as a minor support. A retest of the wedge breakdown could offer a good short opportunity.

Gold (XAU/USD) Technical Analysis – Rising Wedge Breakdown & MMC🧠 2. Introduction to Mirror Market Concepts (MMC):
MMC, or Mirror Market Concepts, is a powerful technique that views price action as symmetrical or repetitive in nature. In this scenario, we notice that the right side of the chart mirrors the left — suggesting that after this bullish climb, the market might repeat its earlier bearish behavior but in a reflected pattern.
This adds confluence to our bearish outlook and makes the forecast more robust.
🔺 3. Rising Wedge Pattern – Bearish Reversal Signal:
The most critical part of this analysis is the formation of a Rising Wedge — a classic reversal pattern. Let’s break down what it means:
Structure: The wedge is formed by two upward-sloping trendlines converging at the top.
Volume Behavior: Volume typically decreases as the wedge matures, showing that bulls are losing strength.
Psychology: Buyers keep pushing the price higher, but each move has less momentum than the last. Sellers are quietly preparing for a breakdown.
The moment price breaks below the wedge’s lower trendline, it usually triggers panic selling or aggressive short entries.
🔄 4. Key Price Levels & Zones:
Minor Resistance Zone: Price rejected near a historical resistance area, showing sellers are still active.
Previous Target Zone: This area acted as a ceiling before the rejection — important for reversal confirmation.
SR Interchange Zone: A classic zone where support becomes resistance — this adds strong confluence to the reversal idea.
🎯 Bearish Trade Plan & Take-Profit Levels:
Once the wedge breaks down, the projected move is based on measured moves and prior support levels. Here’s the breakdown:
✅ TP1 (Take Profit 1): 3,275.30 – This is the first key support level right after the wedge breakdown. Ideal for partial profits.
✅ TP2: 3,205.64 – Previous support zone from earlier consolidation. High probability target.
✅ TP3: 3,169.18 – A more extended target that aligns with historical price memory and full wedge depth.
Each TP level is supported by historical price structure and previous volume clusters.
⚠️ Risk Factors & Trade Management:
While this setup looks strong, always consider:
False Breakouts : Wedges can fake out traders. Wait for candle close confirmation below the wedge.
News Events : Macroeconomic announcements (especially U.S. dollar data) can reverse technical setups.
Risk-to-Reward: Don’t enter without calculating your stop loss above the wedge and aiming for at least a 1:2 ratio.
🧠 Conclusion – What This Setup Tells Us:
This chart is a perfect blend of price action + market symmetry (MMC). The rising wedge signals that bulls are running out of steam, while MMC suggests a mirrored decline could follow.
If price action confirms the breakdown with momentum and volume, this could be a high-probability short setup for swing traders and intraday players alike.

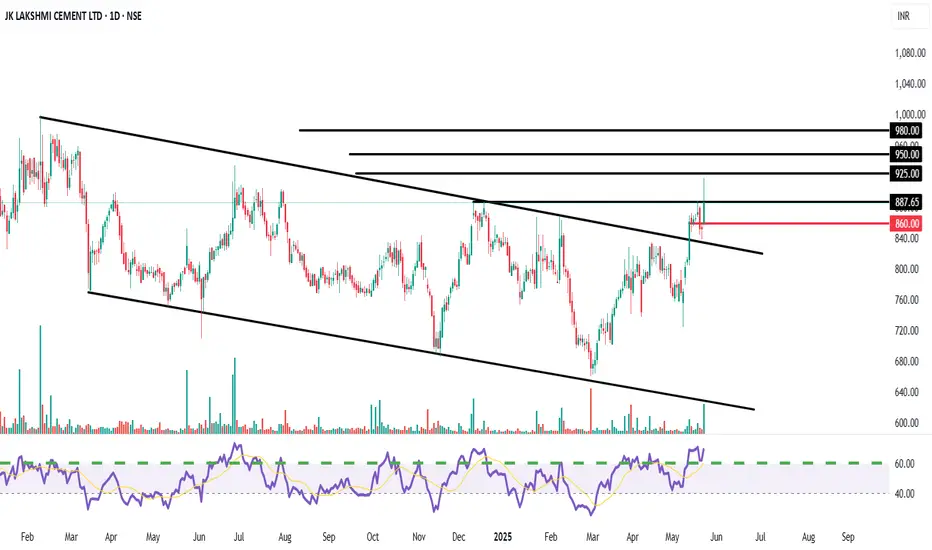
Potential Breakout from a Symmetrical Triangl Descending ChannelEntry Zone: We recommend initiating a BUY position in JK Lakshmi Cement around the current levels, ideally between ₹880 - ₹890. This considers the strong closing above the resistance trendline.
Target 1 (T1): ₹925
Target 2 (T2): ₹950
Target 3 (T3): ₹980 (If momentum sustains above T2)
Stop Loss (SL): ₹860 (Strictly on a closing basis)
Channel Breakout: The stock has decisively broken out of a multi-month descending channel/symmetrical triangle pattern, indicating a potential strong reversal from a corrective phase. This breakout appears to be supported by a noticeable pickup in volumes.
Key Resistance Breach: The stock has also managed to close above a significant horizontal resistance level around ₹880-885, which has acted as a hurdle multiple times in the past. A sustained move above this level confirms bullish intent.
RSI Strength: The Relative Strength Index (RSI) is showing strength, trading well above the 50-mark and moving towards the overbought zone, confirming increasing buying momentum.
Positive Price Action: The overall structure suggests accumulation at lower levels, and the current breakout could initiate the next leg of the uptrend.
Favorable Risk-Reward: The setup offers a compelling risk-reward profile for a short-term trade, with significant upside potential compared to the defined stop-loss.
Key Risk: A failure to sustain above the ₹880 level or a close below the ₹860 stop-loss would invalidate the bullish view and could lead to renewed selling pressure.
Coiling for a Breakout – Watch This LevelAfter a strong upward move, BYBIT:SUIUSDT is currently consolidating in a sideways range, forming what appears to be a falling wedge pattern — a classic bullish continuation setup.
If this pattern plays out, there's a good chance the price will resume its uptrend, supported by a bullish divergence forming within the wedge. The key level to watch is the resistance at 4.0040. A clean breakout above this level should be backed by strong momentum. However, if the price breaks above but quickly drops back below 4.0040, it could signal a lack of buying pressure — increasing the risk of a failed breakout.
This bullish scenario remains valid as long as the price holds above 3.5868. The next potential upside targets are 4.7996 and 5.0552.
Keep an eye out for a high-volume breakout and a strong candle close above 4.0040 to confirm the move.
What’s your take on BINANCE:SUIUSDT ?

"BTC - Time to buy again!" (Update)As mentioned in the previous analysis, the price reached the top of the wedge and broke out with a price increase. Now that Bitcoin's price is above the wedge, it can be said that with a slight price correction, it could follow the pattern and make a measured move where AB = CD.
PREVIOUS ANALYSIS
Give me some energy !!
✨We spend hours finding potential opportunities and writing useful ideas, we would be happy if you support us.
Best regards CobraVanguard.💚
_ _ _ _ __ _ _ _ _ _ _ _ _ _ _ _ _ _ _ _ _ _ _ _ _ _ _ _ _ _ _ _
✅Thank you, and for more ideas, hit ❤️Like❤️ and 🌟Follow🌟!
⚠️Things can change...
The markets are always changing and even with all these signals, the market changes tend to be strong and fast!!

ARB - Beautiful Falling Wedge Pattern---------------------------------------------------------------
Description
---------------------------------------------------------------
+ Perfect falling wedge pattern has formed for ARB, a clear breakout from this falling wedge pattern is imminent.
+ breakout from this falling wedge pattern could push the price to previous All time high.
---------------------------------------------------------------
VectorAlgo Trade Details
------------------------------
Entry Price: 0.39
Stop Loss: 0.16
------------------------------
Target 1: 0.6229
Target 2: 0.9196
Target 3: 1.1430
Target 4: 1.6343
Target 5: 2.1129
------------------------------
Timeframe: 1W
Capital: 1-2% of trading capital
Leverage: 5-10x
---------------------------------------------------------------
Enhance, Trade, Grow
---------------------------------------------------------------
Agree or Disagree with the ideas ? lets discuss in the comments.
Like and follow us for more ideas.
Best Regards,
VectorAlgo

NZDJPY 1H LONGFound falling wedge with bullish divergence
Entry on break on last LH, Projection about 1:1

Be careful with XTZ !!!So if you pay attention to the XTZ chart you can see that the price has formed a Ascending FLAG or wedge which means it is expected to price move as equal as the measured price movement.( AB=CD )
NOTE: wait for break of the FLAG .
Give me some energy !!
✨We spend hours finding potential opportunities and writing useful ideas, we would be happy if you support us.
Best regards CobraVanguard.💚
_ _ _ _ __ _ _ _ _ _ _ _ _ _ _ _ _ _ _ _ _ _ _ _ _ _ _ _ _ _ _ _
✅Thank you, and for more ideas, hit ❤️Like❤️ and 🌟Follow🌟!
⚠️Things can change...
The markets are always changing and even with all these signals, the market changes tend to be strong and fast!!

EUR/JPY Technical Breakdown: Rising Wedge Breakdown + Target🔺 1. Rising Wedge Pattern Explained
A Rising Wedge is formed when:
Price action creates higher highs and higher lows, but
The slope of the support line is steeper than the resistance line.
This signals that buyers are losing strength, and momentum is fading.
In this chart:
The wedge began forming around mid-February 2025.
Price was compressing within converging trendlines.
After multiple failed breakouts near resistance (~165.50), the pair finally broke below the lower trendline, confirming a bearish breakout.
This pattern is considered reliable because it traps late buyers and shifts sentiment from bullish to bearish quickly once the lower boundary is breached.
🔻 2. Key Technical Zones
📌 Major Resistance Zone (~165.00 – 166.00)
Strong supply area; price has rejected here multiple times since late 2023.
Resistance was confirmed again during the wedge formation.
High volume spike noted near this level, followed by a steep drop—evidence of distribution and smart money exiting long positions.
📌 Major Support Zone (~156.00 – 157.00)
Historically held as a demand zone.
Previous bounces suggest it is structurally significant.
However, repeated tests can weaken the zone, increasing the likelihood of a breakdown.
🎯 Target Price: 153.433
Measured by taking the height of the wedge and projecting it from the breakout point.
Coincides with a previously tested level (support turned target).
Bears could aim for this level as a swing target.
📉 3. Market Psychology Behind the Pattern
As price climbs inside a rising wedge, volume often declines, showing buyer exhaustion.
False breakouts near the top of the wedge trap breakout traders, adding fuel to the downside move once price breaks the lower boundary.
The sharp selloff post-breakout is often driven by stop-loss cascades and aggressive short positioning.
🔁 4. Potential Price Path & Trade Plan
Retest in Progress: Price may retest the broken wedge support (now resistance) near 163.00–164.00 before further decline. This retest zone offers a high-probability short entry opportunity with tight risk management.
Immediate Downside Levels: 160.00 (psychological level), 157.00 (support zone), and final target at 153.43.
Bearish Continuation Scenario: If the pair maintains below the wedge and forms lower highs, it confirms ongoing bearish sentiment.
🛑 5. Risk Factors to Monitor
ECB or BOJ monetary policy shifts (rate cuts/hikes, yield curve control updates).
Risk-on vs risk-off flows, especially in times of geopolitical or macroeconomic shocks.
Intervention by the Bank of Japan to protect JPY from excessive weakening.
✅ Conclusion: A Tactical Short Opportunity
The EUR/JPY chart is setting up for a potential medium-term short swing trade following a confirmed rising wedge breakdown. With clear rejection from a long-standing resistance zone and fading bullish momentum, the technicals align for a move toward 153.43 over the coming weeks.
Traders should watch for clean retests and structure-based entries, managing risk around 164.50 with profit-taking at key support zones along the path.

Gold may break resistance level and then continue to growHello traders, I want share with you my opinion about Gold. In this chart, price previously formed a clear triangle pattern, where price was squeezed between two converging trend lines. After a period of consolidation, the market broke above this formation, reaching the resistance zone near 3365, but then started to retrace. Following that breakout, a new structure emerged, an upward wedge. The asset has been moving within this narrowing channel, forming higher lows and approaching the upper boundary with weakening momentum. This type of pattern often signals an upcoming strong move once the price breaks out from either side. Currently, Gold is trading near the resistance line of the wedge and just beneath the seller zone. I expect that the price may fall back to the support line of the wedge around the 3205 - 3185 area. After that, a bounce from this zone could trigger a bullish breakout from the wedge. That’s why I set my TP 1 at the 3420 level, this target aligns with a full wedge breakout and continuation of the upward movement through the resistance level and beyond the seller zone. Please share this idea with your friends and click Boost 🚀
Disclaimer: As part of ThinkMarkets’ Influencer Program, I am sponsored to share and publish their charts in my analysis.

EUR/USD Rising Wedge Breakdown – Bearish Opportunity in Sight🔍 Technical Breakdown
🟦 1. Rising Wedge Pattern (Bearish)
The price has been moving within a tightening upward channel — forming higher highs and higher lows, but with decreasing momentum. This is a typical Rising Wedge, a pattern that signals exhaustion in an uptrend and typically resolves to the downside.
The pattern formed over several days.
Volume has been declining as the price pushed higher — a classic sign of weakening trend strength.
🚨 2. Major Resistance Zone
The wedge culminated near a major historical resistance zone (around 1.1400), which price failed to break multiple times — showing strong seller presence. This adds confluence to the bearish breakdown.
📉 3. Breakdown & Retest
Price broke below the lower wedge trendline, confirming the bearish reversal. After the breakdown, the pair appears to be retesting the previous support line — now acting as new resistance.
This retest is crucial — a successful rejection here typically confirms the breakdown and provides an ideal entry point for short positions.
⚡ Volume Clues
Note the "Volume Burst" earlier in the chart, followed by a sharp move up. But that rally was unsustainable — buyers couldn’t hold above resistance, and volume has since faded. This volume exhaustion is further evidence that bullish momentum is weakening.
🔄 Key Support Zones Below
Around 1.1200: A strong SR flip zone (support-turned-resistance), which could act as temporary support.
Final Bearish Target: Around 1.1070, a strong demand zone where price previously consolidated before the last bullish run.
This is the measured move target from the wedge height applied to the breakdown point.
🧠 Why This Matters (Trader Insight)
This setup combines:
A reliable bearish pattern (rising wedge)
Key horizontal resistance
A volume drop
A clean retest structure
That makes it a high-confluence short trade idea. These patterns don't always play out immediately, but when they do, they often drop hard.
📌 Trade Setup Summary
Bias: Bearish
Pattern : Rising Wedge (broken)
Current Action: Retesting the broken wedge
Entry Zone: 1.135–1.138 (retest confirmation)
First Target: 1.1200 (SR Flip)
Final Target: 1.1070 (Demand Zone)
Invalidation: Break and hold above 1.1410

Bitcoin (BTC/USD) – Rising Wedge Pattern Signals & BreakdownThis chart illustrates a Rising Wedge Pattern on the weekly timeframe for Bitcoin (BTC/USD), which is generally considered a bearish reversal pattern in technical analysis. The pattern appears after a strong upward move and typically signals that the price is losing momentum and may be preparing for a significant correction.
📐 What is a Rising Wedge Pattern?
A rising wedge is a chart pattern formed when the price consolidates between two upward-sloping trendlines – the support line (bottom) and the resistance line (top) – with the two lines converging toward each other.
As price climbs higher, it forms higher highs and higher lows.
However, the slope of the highs is less steep than the slope of the lows, showing a loss of bullish strength.
Eventually, the price breaks below the support line, often leading to a sharp move downward.
🔍 Key Highlights from the Chart:
📌 1. Major Resistance Zone (~$110K–$120K):
BTC is currently facing heavy resistance in this area.
This zone has historically acted as a supply zone where bulls have struggled to break through.
Multiple rejection wicks indicate strong selling pressure.
📌 2. Pattern Touchpoints:
BTC has now formed multiple touchpoints on both the support and resistance lines of the wedge, confirming the structure.
This gives the pattern higher validity from a technical analysis perspective.
📌 3. SR Interchange Zone (~$65K–$70K):
This is a key horizontal zone where past resistance could act as future support.
A successful breakdown may first test this level before continuation.
📌 4. Retesting After Breakdown:
After breaking the wedge support, a retest of the broken trendline is often seen.
If the retest is rejected, it confirms the breakdown and opens the door to deeper bearish movement.
🎯 Target Projection:
If the wedge breaks down and the bearish scenario plays out, we could see Bitcoin fall to the $22,000–$25,000 region – marked as the final target zone on the chart. This level aligns with:
Previous macro-support zones from 2021
Fibonacci retracement levels
Psychological price levels where buyers may re-enter
⚠️ Bearish Factors to Watch:
Bearish divergence on indicators like RSI or MACD (not shown on chart but worth checking)
Volume decreasing as price rises – a classic wedge behavior
Macroeconomic headwinds or Bitcoin halving-related exhaustion
Rejection from major resistance with strong bearish candles
🕒 Timeframe & Patience:
This is a weekly chart, which means the pattern will play out over weeks or months, not days. Patience is key. A clear break, retest, and rejection would be the most reliable confirmation to expect further downside.
✅ Invalidation Scenario:
If BTC breaks above the wedge resistance line with strong bullish volume and holds above the $120K level, this bearish thesis becomes invalid.
In that case, BTC could enter price discovery mode, making new all-time highs.
💬 Final Thoughts:
This analysis is a technical outlook, not financial advice. Always use stop-loss strategies and manage your risk carefully. Market sentiment, news, and macro factors can quickly shift the scenario. However, from a purely technical standpoint, the rising wedge pattern is a powerful signal that should not be ignored.
