Bitcoin can drop from wedge to 100K pointsHello traders, I want share with you my opinion about Bitcoin. After consolidating for an extended period within a triangle pattern, the price eventually broke out with strong bullish momentum. The move was supported by a solid rebound from the buyer zone and a clean breakout above the 92800 - 94200 support area. This breakout initiated a steep climb, forming a new upward wedge structure, defined by narrowing trend lines and rising local highs. Currently, the price is trading near the resistance boundary of the wedge, around the 104000 - 105000 zone. This zone has already triggered one rejection and is showing signs of weakening bullish strength. Given the rising wedge geometry and the fading impulse strength, the risk of a correction is increasing. The current structure typically leads to a pullback, especially after such a steep rise. I expect that BTC may rise to the resistance line of the wedge and then drop below the support line, thereby exiting from this pattern. That's why I set my TP 1 at the 100K points. Please share this idea with your friends and click Boost 🚀
Wedge

Gold Bullish Outlook - Gold BullishFollowing strong buying momentum observed yesterday, gold is currently consolidating within a falling wedge pattern — a typically bullish setup. A breakout from this pattern could trigger a fresh upward move in the price of gold.
Post-Breakout Bullish Targets:
Target 1: 3230
Target 2: 3240
Target 3: 3250
Target 4: 3275
Disclaimer: This is a technical analysis-based outlook. Please assess your risk-to-reward ratio and follow your individual trading strategy. This is not financial advice — trade responsibly and according to your plan.

Long Swing Idea – Waiting on Confirmation at Wedge SupportRefining the previous idea: Price is holding the lower boundary of an Ascending Broadening Wedge, showing signs of support rejection. However, we’re noticing a clear decline in bullish momentum. No rush to enter—we wait for strong confirmation before committing to a swing long. A solid reaction or breakout of a minor structure will be the signal. Until then, patience is the edge.

Bitcoin Ascending Triangle (4H)BINANCE:BTCUSDT might be forming an ascending triangle on the 4H chart, with a horizontal resistance at $105k and support being the resistance of the broadening wedge we identified last week: Bitcoin Ascending Broadening Wedge (4H)
A sustained break above $105k would set the target at $109k, very close to ATH.

OP/USDT Breakout Alert!!🚀 OP Breakout Alert – 100% Potential Incoming?! 👀🔥
Hey Traders! If you're all about high-conviction plays and real alpha, smash that 👍 and tap Follow for more setups that actually deliver! 💹💯
OP has successfully broken out from the falling wedge pattern on the daily timeframe, which historically signals a strong trend reversal. After retesting the breakout zone, price action looks ready for a fresh upside move!
🔹 Entry: CMP and add more up to $0.76
🎯 Targets:
→ $0.98
→ $1.21
→ $1.43
→ Final Target: $1.64
🛑 SL: $0.688
⚙️ Leverage: Low leverage (Max 5x)
📊 Structure:
Falling wedge breakout ✅
Retest holding strong ✅
Volume starting to pick up 📈
We’re watching closely—this setup has the potential to mimic the last 114% rally. Let's see how it unfolds! 🚀
💬 What’s your take on OP from here?

$RR: Broken Resistance, Following SupportAfter a strong run-up, this stock found a solid consolidation range between $1.50 - $2.20, building a healthy base. We've broken resistance three times, creating new levels, but support has been steadily climbing since December – a great sign of underlying strength. I predict we will come back to the latest resistance, creating a new support, for the stock to ride to $3.50
Current Setup:
Bull Flag Formation: Recently broke out of the flag pattern.
Support Flip: Price is retesting previous resistance as new support – a textbook setup for the next leg up.
Volume Pickup: Notice the volume spikes on breakouts, as well as increased continued action these past weeks, confirming interest.
Target: Potential move up to the $3.50+ range if momentum continues.
Risk Management: Watch for a confirmed support hold before entering.
__________________________________________________________________________________
All love and best of luck, traders

Brent Crude Breaks Lower: Iran Deal Could Add 800K BarrelsBrent crude has dropped over 2% following news that the US and Iran may strike a deal, potentially adding 800,000 barrels per day to global supply. We explore the technical setup, including a wedge pattern and the risk of a deeper fall.
This content is not directed to residents of the EU or UK. Any opinions, news, research, analyses, prices or other information contained on this website is provided as general market commentary and does not constitute investment advice. ThinkMarkets will not accept liability for any loss or damage including, without limitation, to any loss of profit which may arise directly or indirectly from use of or reliance on such information.

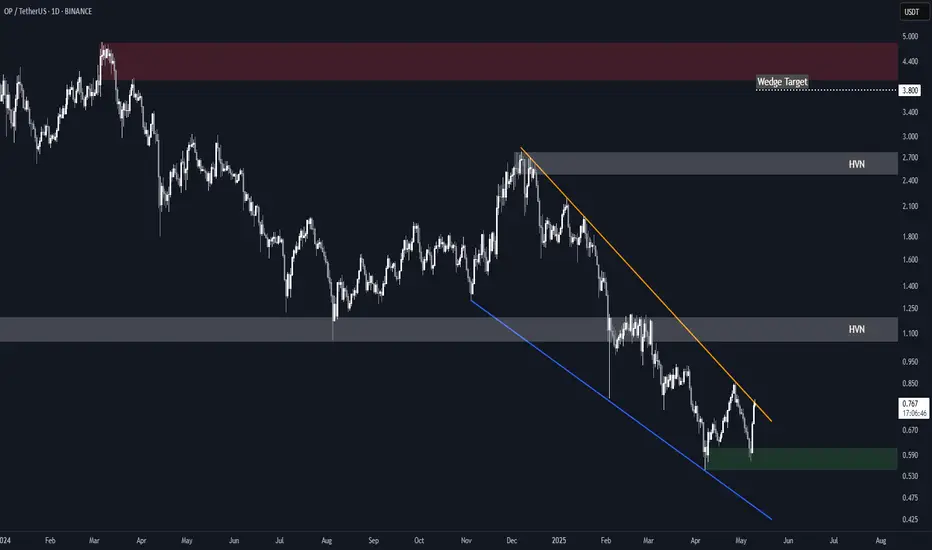
Optimism (OP) Falling WedgeBINANCE:OPUSDT is attempting a breakout from a 14 months long falling wedge.
A sustained break above the resistance in the near term would set the target at $3.80, just shy of the main $4.00-$4.80 supply zone.
Key Levels to Watch
• $0.55-$0.60: Main demand zone and invalidation point for the setup
• $1.00-$1.20: High Volume Node and key S/R dating back to June 2023.*
• $2.50-$2.80: High Volume Node and wedge high point.*
• $4.00-$4.80: Main supply zone.
* These could offer resistance and represent good levels for partial TPs.
$UNG starting to accumulate a position. Swing TradeBuilding a position in unleveraged natural gas AMEX:UNG in $13-14's
Divergence on price/RSI.
Falling Wedge
Would like to see price get over and hold above daily 50MA
Will likely update once that is achieved
After 50MA is achieved and held, breakout the wedge and target the 200MA daily for profit.
Add on down days and be very patient with this one

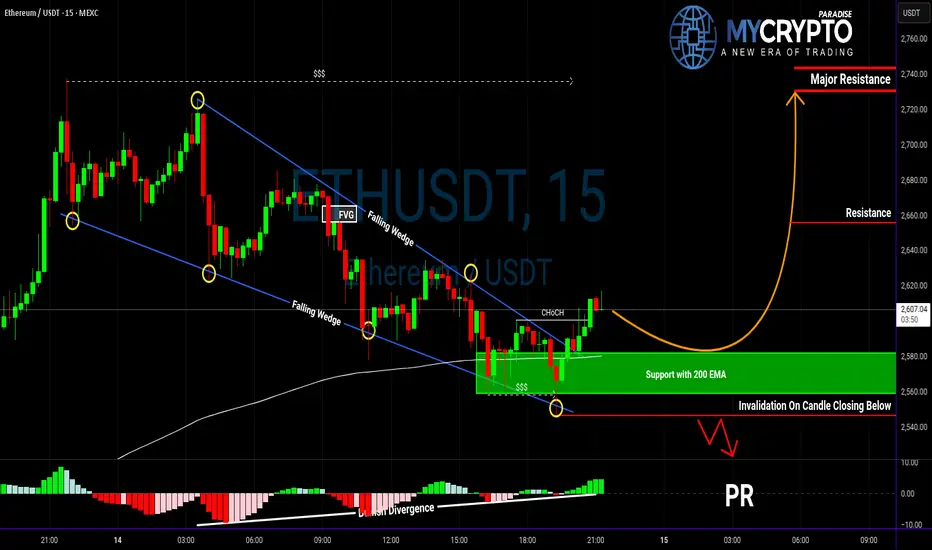
ETH Bulls on Alert: Is This the Move We've Been Waiting For?Yello Paradisers, did you catch that bullish breakout on ETH or are you still stuck waiting for confirmation?
💎Ethereum has officially broken out of its falling wedge pattern, which is a well-known bullish structure often signaling a trend reversal. What gives this breakout even more weight is that ETH has established a support zone exactly at the 200 EMA—an area that historically acts as a key level for institutional traders.
💎Adding to the bullish case, we’ve also identified a bullish divergence on the momentum indicators, which often suggests weakening selling pressure and the potential for upside. More importantly, there has been a clear bullish CHoCH (Change of Character), confirming that market structure is shifting in favor of the bulls. With all of these signals aligning, the probability of a continued bullish move is significantly higher.
💎However, the most disciplined traders understand that no setup is perfect without confirmation. A pullback to the support zone would offer a textbook opportunity for a high-risk-to-reward entry—ideal for bulls who are patiently waiting for a safer entry point rather than chasing the move. This kind of setup allows us to manage our risk properly and act only when the odds are clearly in our favor.
💎That said, if the price breaks down and closes below the support zone, the bullish idea is completely invalidated. This is the level where we draw the line and step aside. Being able to invalidate your own bias is what separates traders who survive from those who don't.
🎖We are playing it safe right now. If you want to be consistently profitable, you need to be extremely patient and always wait only for the best, highest probability trading opportunities.
MyCryptoParadise
iFeel the success🌴
SUIUSDT → False breakdown of support before growthBINANCE:SUIUSDT has entered a consolidation phase within a bullish trend. The chart shows a zone of interest and a trigger area that are worth paying attention to...
The coin looks quite positive. An upward trend is forming, which is also supported by the growth of Bitcoin and a relatively positive fundamental background.
Technically, SUI is consolidating between 4.110 and 3.811. Below the support level, a huge liquidity pool has formed, which has not yet been tested. There is a high probability of a false breakdown before the growth continues, but if the market turns out to be more aggressive, buyers may not let the price fall to 3.811, in which case we can consider a breakout of the resistance at 4.11-4.275 and consolidation of the price above these levels with the aim of continuing growth.
Support levels: 3.811, 3.667
Resistance levels: 4.11, 4.275
The movement of Bitcoin shows that the market is gathering liquidity as part of a local correction against the backdrop of a bullish trend. Yesterday, we all witnessed a local liquidation, but there are no reasons for a decline yet. SUI, in an ideal scenario, may test support at 3.811 and form a false breakdown before continuing to grow.
Best regards, R. Linda!

EURAUD Falling wedge Idea 🧠 Technical Overview:
The chart shows EURAUD trading within a falling wedge pattern — a classic bullish reversal formation.
Price has respected the wedge boundaries multiple times, indicating strong technical structure.
There is also a highlighted demand zone (marked in yellow) around 1.76500–1.77000, which has acted as previous support and resistance.
🔎 Key Elements:
✅ Falling Wedge Pattern
Bullish pattern, suggesting a potential breakout to the upside.
Price is near the bottom of the wedge, making it a good risk-reward zone for a long (buy) position.
A breakout above the wedge resistance would confirm bullish sentiment.
🟨 Horizontal Resistance Zone: 1.7650–1.7700
This zone has acted as a key resistance in the past.
If price breaks out of the wedge, this is the logical target area.
Traders may consider taking partial profits here or watching for rejection signals.
📈 Trading Plan (Example Idea):
Entry (Buy):
Consider buying near the lower wedge support, ideally with a bullish candlestick pattern.
More conservative entry: wait for a break and close above the wedge resistance.
Target:
First target: 1.7650–1.7700 (yellow zone)
Second target (if momentum is strong): possible continuation toward 1.7850+
Stop Loss:
Below the most recent swing low, ideally under 1.7200 for a safe buffer
⚠️ Risk Considerations:
A breakdown below the wedge invalidates the bullish idea.
Watch for AUD strength due to upcoming Australian data or China-related sentiment.
Don’t trade without confirmation (e.g., bullish engulfing candle, volume spike, etc.)
📌 Summary:
Pattern: Falling Wedge (Bullish)
Bias: Bullish – potential breakout and move toward 1.7700
Key Levels:
Support: 1.7200
Resistance: 1.7700
Action: Wait for wedge breakout confirmation or buy near lower boundary with tight stop.

Stellar (XLM) Falling Wedge + Inverse Head & ShouldersBINANCE:XLMUSDT has recently broken out of two major bullish patterns:
• Falling Wedge: The breakout above the descending resistance (orange) confirms the wedge setup, with a measured target around $0.70.
• Inverse Head & Shoulders: Breakout confirmed with a measured target around $0.40.
Key Levels to Watch
• $0.30 – 0.618 Fib level. IH&S neckline and current support. A break below it would invalidate the IH&S setup and potentially lead to a retest of the wedge's resistance as support.
• $0.36 – 0.5 Fib level and previous S/R.
• $0.40 – IH&S measured move target.
• $0.50 – 0.236 Fib level and previous resistance / swing high.
• $0.70 – Wedge measured move target.
Volume Analysis
Breakout volume is not as strong as expected, suggesting the need for further confirmation. A continuation with increasing volume would strengthen the bullish case.

$SOL About to Outperform $ETHToday looks like a good day to flip your CRYPTOCAP:ETH for CRYPTOCAP:SOL 😎
Flirting with the 200DMA,
RSI has bottomed,
feels good man 🐸

Long-Term Buy On The AussieThe most straightforward interpretation is that the down move that started back in February 2021 (red rectangle) was a correction of the previous rally (green rectangle) and ended at 0.5914. If this is correct, then we are in the early stages of a large upward move on the Aussie in the long-term that should reach at least the previous highs of 2021. This view will be in jeopardy if we break back below the previously mentioned support and will be completely negated on a break of the 2020 lows at 0.5510.

BTCUSD FALLING WEDGE PATTERNHere I Created This BTCUSD Chart Analysis
Pair : BTCUSD (Bitcoin)
Timeframe: 15- Minutes
Pattern: Falling wedge
Momentum: Bearish/ SELL
Entry Level : SELL 104000
Resistance zone : 104100
Target Will Be : 102800
Disclaimer : This signal is based on personal analysis for learning purposes. Trade at your own risk and always use proper risk management.

Euro may exit from wedge and then drop to support levelHello traders, I want share with you my opinion about Euro. After a strong impulse to the upside and a retest of the 1.1265 resistance area, the Euro started to consolidate inside a downward wedge. Despite repeated attempts to hold above the 1.1265 - 1.1300 zone, price action gradually shifted lower, creating lower highs within the wedge formation. This pattern often signals continuation or deeper correction, especially when formed after a large bullish move. The recent breakout below both the support area and the lower wedge boundary confirms that bearish pressure is taking control. The rejection from the seller zone and the sharp decline reinforce this shift in sentiment. Now the price is trading near the support line of the wedge and showing weak attempts to recover, forming a potential retest of the broken structure. Given the break of support, I expect the Euro may continue its decline toward the 1.0925 level, which coincides with both the buyer zone and a well-defined support level, thereby exiting from wedge pattern. This zone serves as my current TP 1. Please share this idea with your friends and click Boost 🚀

BTC at Crucial Retest Zone — Bearish Setup in Play!Price Action Alert on #BTC/USDT (4H Timeframe)
#Bitcoin recently broke down from a rising wedge, a classically bearish pattern. Alongside this, we've also identified a bearish RSI divergence, further validating potential downside momentum.
Key Observations:
🔺 Rising wedge breakdown confirmed
📉 Bearish divergence on RSI (4H)
🔁 Price is now retesting the broken wedge from below (a classic bear signal!)
⛔️ Still holding above a key horizontal support — watching for a clean break here for confirmation
📌 Bearish Trade Setup (Waiting for Confirmation):
Entry: Below key support zone (marked on chart)
Target 1: $84,300
Target 2: $75,000
Stop-loss: Above wedge breakout point (100,500)
💼 Always follow proper risk management!
🧠 Why This Matters:
The combination of pattern breakdown, bearish divergence, and a retest zone is a powerful signal — but patience is key. We wait for full confirmation (support break) before executing any short trade.
📣 What do you think — will #BTC break the support or bounce back? Drop your thoughts in the comments! 🗣️
If you found this analysis helpful, like, comment, and follow for more real-time setups! 🚀
#BTC #Bitcoin #CryptoAnalysis #PriceAction #Bearish #ShortSetup #RisingWedge #TechnicalAnalysis #CryptoTrading #TradingView

VIRTUALUSDT can derail support with momentumVIRTUAL is consolidating after the rally, but it cannot continue its growth yet. A descending triangle with a clear base support and a fourth retest relative to 1.877 is being formed, which in general only increases the chances of support breakout and decline
Scenario: if the compression of this format (within the descending triangle) continues and the price continues to compress to the support at 1.877, then in this case it will be possible to catch a breakout through a limit order. A sharp impulse is possible. As the first target I will wait for a decline to 0.5 fibo (1.73)

Technical Breakdown on Gold Spot / USD (XAU/USD) | 1H TimeframeTechnical Breakdown on Gold Spot / USD (XAU/USD) – 1H Timeframe using Volume Profile, Gann, and CVD + ADX
1. Key Observations (Volume, Gann & CVD + ADX Focused)
a) Volume Profile Insights:
Value Area High (VAH): 3,382.24
Value Area Low (VAL): 3,275.00 (approximate visual level)
Point of Control (POC): 3,338.10
High-Volume Nodes: Concentrated around 3,338–3,350 (volume acceptance zone).
Low-Volume Gaps: Sharp drop region near 3,310 to 3,295 indicates a lack of market interest – prone to fast moves.
b) Liquidity Zones:
Stop Cluster Zones:
Order Absorption Zones:
c) Volume-Based Swing Highs/Lows:
Swing High (Volume Spike): Near 3,381–3,382 (sharp rejection, bearish orderflow).
Swing Low (Volume Spike): 3,272–3,275 zone, likely buyer absorption.
d) CVD + ADX Indicator Analysis:
Trend Direction: Downtrend (recent bearish pressure from CVD with price).
ADX Strength:
CVD Confirmation:
2. Support & Resistance Levels
a) Volume-Based Levels:
Support:
Resistance:
b) Gann-Based Levels:
Recent Confirmed High: 3,382
Recent Confirmed Low: 3,272
Retracements from High to Low:
3. Chart Patterns & Market Structure
a) Trend: Bearish-Ranging Hybrid
Confirmed by low ADX (weak trend) but bearish pressure from CVD + lower highs.
b) Notable Patterns:
Bearish Flag: Price consolidating inside a descending channel after a breakdown.
POC Retest Failure: Indicates inability to reclaim value area – bearish bias.
Projection Path: Shows two outcomes – further drift down vs. range reclaim, with downside currently dominant.
4. Trade Setup & Risk Management
a) Bearish Entry (CVD + ADX confirm downtrend):
Entry Zone: 3,325–3,330 (POC rejection zone)
Target:
Stop-Loss (SL): 3,345 (above 1/3 Gann level and rejection wick)
Risk-Reward Ratio (RR): Minimum 1:2
b) Bullish Entry (only if reclaim confirmed above POC):
Entry Zone: 3,340–3,345 (on confirmed reclaim with bullish CVD crossover)
Targets:
Stop-Loss (SL): 3,325 (below reclaim point)
RR: 1:2 minimum
c) Position Sizing: Risk 1–2% of capital per trade.

Has it Bottomed Out or Bottom yet to come?Seems like it bottomed out around 101400 - 105000
Next Expected Reversal Level
93728 - 94188

Nasdaq 100: Bulls in Control for Now, but Key Hurdles RemainNasdaq 100 futures have gapped higher upon the Asia market open, leaving them sitting above the important 200-day moving average. With momentum indicators like RSI (14) and MACD generating bullish signals, it’s an environment that favours buying dips and topside breaks.
However, the coast is not entirely clear for bulls with the price struggling to take out the March 28 high of 20,536. The January 2023 uptrend is also nearby, sitting just above 20,600. Zooming out, the price has also been coiling in a rising wedge pattern, warning there may be an eventual resumption of the bearish trend seen between late February and early April.
While some bulls may be willing to buy above the 200-day moving average with a stop beneath for protection, others may prefer to wait for a decisive push above the top of the resistance zone around 20,650 before establishing positions. Topside levels to keep on the radar include 21,000, 21,420 and 21,969.
If the price were to reverse back below the 200-day moving average and close there, it would swing near-term directional risks lower, invalidating the bullish bias.
Good luck!
DS

Sui broke above the wedge & is already over halfway 2 the targetSUUSD has had a very notable pump on this uptrend which hopefully will end up being the beginning of confirming a real sustained uptrend in the alt market. *not financial advice*
