Short U/JSeveral confirmation align with the over all bearish trend
i think we are going to see a major drop in this market
Wedge

EUR_CHF BEARISH BREAKOUT|SHORT|
✅EUR_CHF broke out
Of the bearish wedge pattern
So we are locally bearish
Biased and we will be
Expecting a further
Bearish move down
SHORT🔥
✅Like and subscribe to never miss a new idea!✅
Disclosure: I am part of Trade Nation's Influencer program and receive a monthly fee for using their TradingView charts in my analysis.

Direct Line Insurance Stock Quote | Chart & Forecast SummaryKey Indicators On Trade Set Up In General
1. Push Set Up
2. Range Set up
3. Break & Retest Set Up
Notes On Session
# Direct Line Insurance Stock Quote
- Double Formation
* ((Wedge Structure)) | Completed Survey
* (Uptrend Argument)) | Entry Area | Subdivision 1
- Triple Formation
* 0.5 & 0618 Retracement & Gap Feature | Subdivision 2
* (TP1) | Subdivision 3
* Daily Time Frame | Trend Settings Condition
- (Hypothesis On Entry Bias)) | Indexed To 100
- Position On A 1.5RR
* Stop Loss At 120.00 USD
* Entry At 133.00 USD
* Take Profit At 150.00 USD
* (Uptrend Argument)) & Pattern Confirmation
* Ongoing Entry & (Neutral Area))
Active Sessions On Relevant Range & Elemented Probabilities;
European-Session(Upwards) - East Coast-Session(Downwards) - Asian-Session(Ranging)
Conclusion | Trade Plan Execution & Risk Management On Demand;
Overall Consensus | Buy

Another look at the wedge/pennant I just postedI decided to do a second chart idea on the pennant I posted in the last chart, this tme including the super pivotal support trendline and moving the emasured move line to the point that support line crosses over the top trendline of the wedge. Will be interesting to see if either of these measured move line projections from this dea and the last one play out. *not financial advice*

Falling Wedge/Pennant on BitcoinThe full wedge extends all the way into August. I certainly hope we break up from it well before then. I place the measured move line around where I think we old break upward from if we can flip the 200ma back to solidified support. It of course could actually take much longer to break up from the wedge but even if it did the lowest price of the wedge is really not that terrifying in my opinion and would instead just be a phenomenal buying opportunity if we were allowed to accumulate mote that cheap. Because of other major supports not shown here however going below 70k for anything but an extremely brief wick seems an incredibly low probability. *not financial advice*

Scenario Analysis of EUR/CHF 4H Chart1. Market Structure
The market was previously in a downtrend but experienced a strong bullish breakout around early March.
Price surged upwards, breaking a key resistance zone (now acting as support).
The current price action appears to be forming a rising wedge, a potential reversal pattern.
2. Key Levels
Support Zone: Around 0.9500, which was previously resistance and now turned into a strong support.
Resistance Zone: Around 0.9650, where price is facing difficulty breaking above.
Current Price: 0.95986.
3. Chart Pattern - Rising Wedge
A rising wedge is visible, which is often a bearish reversal pattern.
Price is consolidating near the upper boundary of the wedge, showing signs of exhaustion.
If price breaks below the wedge, a bearish move towards the 0.9500 level is likely.
4. Confirmation Factors
EMA 50: The price is currently hovering around the 50-period EMA, indicating a possible shift in momentum.
Bearish Rejection Wicks: There are multiple rejection candles at the resistance zone, showing seller strength.
Breakout Zone: If the price breaks below the wedge and the gray support zone, it will confirm a bearish move.
5. Trading Plan
Bullish Scenario: If price breaks above the wedge and sustains above 0.9650, it could push towards 0.9700+.
Bearish Scenario: If price breaks below the wedge and the support zone, a drop towards 0.9500 or lower is expected.
Best Approach: Wait for a breakout confirmation before entering a trade.

EURO - Price can bounce from support line of wedge to $1.1045Hi guys, this is my overview for EURUSD, feel free to check it and write your feedback in comments👊
Some time ago, the price declined to the $1.0475 level and broke it, after which it declined to $1.0360 points.
Then price turned around and started to grow inside the wedge, where it soon reached $1.0475 level and broke it again.
Next, Euro made a retest, after breakout and then continued to move up, and later it reached $1.0835 level.
Price has some time traded below this level, and then it broke it and reached the resistance line of wedge.
After this, EUR long time traded near $1.0835 level and not long time ago it bounced and started to grow.
In my mind, Euro can bounce from the support line and then rise to $1.1045 resistance line of the wedge pattern.
If this post is useful to you, you can support me with like/boost and advice in comments❤️

HelenP. I Bitcoin can drop of resistance line of wedge to $77800Hi folks today I'm prepared for you Bitcoin analytics. A few days ago, the price surged to 99000 before pulling back to the resistance level, which aligned with the resistance zone. Then, BTC broke through the 89500 level, traded below it for a while, and continued its decline toward the support level, which coincided with the support zone. Following this move, Bitcoin started trading inside a wedge pattern and quickly made a strong upward impulse from the support zone, reaching 94900 and breaking the resistance level once again. However, it soon corrected, dropping back below this level, and after attempting to recover, it failed. BTC then began to decline and, in a short time, fell to the support zone, where it reached the trend line. After bouncing off this level, it started to rise again, eventually making a correction to the support level before continuing its upward movement inside the wedge. At this point, I expect BTCUSDT to reach the resistance line of the wedge before reversing and dropping to the trend line, breaking the support level. Based on this, my goal is set at 77800, which coincides with the trend line. If you like my analytics you may support me with your like/comment ❤️

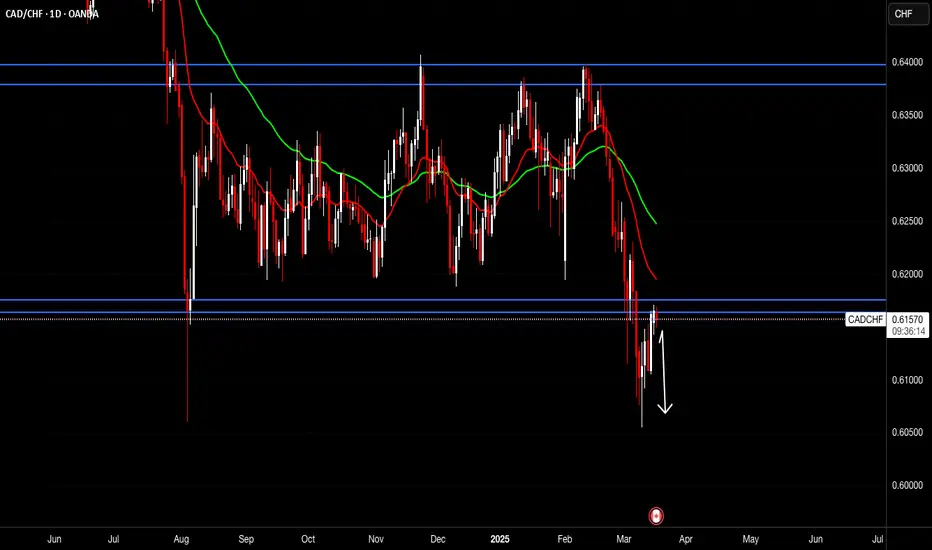
CADCHFPrice broke daily support zone more than a week back and has now come back to retest. H4 looking like a possible double top and H1 has broken a rising wedge pattern. Watching price to break last support zone to look for sell opportunities.
PIUSDT : Head & Shoulders Signals a Major Drop Incoming!Yello, Paradisers! PIUSDT is flashing strong bearish signals! The price has formed a Head & Shoulders pattern right on the resistance trendline of a descending channel—this combination significantly increases the probability of a sharp move to the downside.
💎PIUSDT breaks below the neckline and closed a candle which validates the bearish setup, increasing the likelihood of further downside.
💎However, We have to wait for the proper retest of the neckline, patience is key for the right entry.
💎On the flip side, if PIUSDT breaks above the resistance zone and closes candle above it, the bearish setup will be invalidated.
Stay disciplined and wait for confirmation, Paradisers. A fakeout could trap impatient traders—don’t be one of them! 🎖
MyCryptoParadise
iFeel the success 🌴

SILVER (XAGUSD): Bullish Continuation Ahead
Silver formed a strong bullish pattern on a 4H.
I see a bullish flag with a candle close above its resistance line.
I think that the market is going to continue rising.
Next resistance 34.2
❤️Please, support my work with like, thank you!❤️
I am part of Trade Nation's Influencer program and receive a monthly fee for using their TradingView charts in my analysis.

EURAUD: Pullback From Support 🇪🇺 🇦🇺
There is a high chance to see a pullback from the underlined support on EURAUD.
As a confirmation, I see a bullish breakout of a resistance line of a falling
wedge pattern on an hourly.
The price may touch at least 1.71575
❤️Please, support my work with like, thank you!❤️

OMUSDT → Paranormal behavior. Rally readinessBINANCE:OMUSDT as a whole looks stronger than the market. After a strong rally a correction in the format of a bearish wedge is formed, subsequently the price broke the resistance and is trying to consolidate above the key support
Against the background of a weak market OM coin has good prospects as technically someone is interested in this project and the coin as a whole behaves strongly and looks stronger than the market.
A breakout of the bearish wedge (consolidation pattern within the correction) is forming. If the bulls keep the coin above the previously broken figure resistance and above the base of the 6.752 reversal pattern, the growth may continue in the short to medium term
Resistance levels: 7.39, 7.98
Support levels: 6.752, 6.51
One of the few coins that is rising while bitcoin is falling. Focus on the previously mentioned support levels, as well as on the local resistance 7.05, the break of which may provoke a prolongation of growth
Regards R. Linda!

GBP/USD Chart Analysis: (1H Timeframe)**Chart Analysis: GBP/USD (1H Timeframe)**
**1. Chart Pattern - Rising Wedge 📉**
- The price has formed a **rising wedge**, a bearish reversal pattern.
- A rising wedge occurs when price makes higher highs and higher lows but within a narrowing range, suggesting weakening bullish momentum.
- The price has now broken out of the wedge, signaling a potential downward move.
**2. Key Levels & Targets 🎯**
- **Current Price:** Around **1.29720**
- **EMA Levels:**
- **7 EMA:** 1.29767 (Short-term trend indicator)
- **21 EMA:** 1.29748
- **50 EMA:** 1.29629 (More reliable trend indicator)
- **Bearish Breakdown Targets:**
- **First Target (Red Label):** Around **1.2800**, aligning with previous support levels.
- **Final Target (Green Label):** Around **1.2650**, suggesting a larger move downward if selling pressure continues.
**3. Confirmation of Downtrend? 🔻**
- The breakdown below the rising wedge suggests a potential **downtrend continuation**.
- The **break below 1.2900** would likely confirm a stronger bearish move.
- Volume is increasing on the move down, indicating strong selling interest.
*Possible Trade Setups 📊**
1. **Bearish Scenario:**
- A short position can be considered if price continues breaking below key EMAs and previous support.
- **Entry:** Below 1.2960
- **Stop Loss:** Above 1.3000
- **Take Profit:** 1.2800 (first target) or 1.2650 (final target).
2. **Bullish Reversal Possibility:**
- If price **reclaims the wedge** and breaks above 1.3000, it could invalidate the bearish pattern.
**Conclusion:**
- The **rising wedge breakdown** suggests bearish momentum.
- A move below **1.2900** would confirm further downside.
- **Watch for volume confirmation** before entering a trade.

Day trade XAU- Tue, 18 Mar 2025 Correction wave We have a resistant at 3003-3005 zone. (Temp)
Strong move but FVG not yet fill.
To day we trade correction wave to nearest support zone.
Good luck mates!
TradingMakeSense!

Probability o Rising WedgeBINANCE:BTCUSDT BTC/USDT is currently "forming a rising wedge pattern" , which could indicate a continuation of the downtrend. Since the last peak at $110,000, Bitcoin has been experiencing a decline.
At the moment, BINANCE:BTCUSDT BTC/USDT is highly volatile, with daily price swings of up to 10%. This volatility increases the likelihood of fake breakouts and rapid reversals, especially due to external factors like news.

EUR-CHF Bearish Wedge Pattern! Sell!
Hello,Traders!
EUR-CHF was trading in an
Uptrend but the pair has formed
A bearish wedge pattern so
IF we see a bearish breakout
From the wedge we will be
Expecting a bearish move down
Sell!
Comment and subscribe to help us grow!
Check out other forecasts below too!
Disclosure: I am part of Trade Nation's Influencer program and receive a monthly fee for using their TradingView charts in my analysis.

Shiba INU - Is going to repeat the history ?Shiba INU - Will the history be repeated, I see falling wedge breakout, Elliot 5 waves completed .. Any movement from here is going to be big movement

GBPUSD: UP After the News 🇬🇧🇺🇸
GBPUSD looks bullish after the release of the US news.
I see a bullish breakout of a resistance line of a falling wedge pattern.
The price is going to retest the current high first - 1.2987,
and continue growing to 1.3 level then.
❤️Please, support my work with like, thank you!❤️
I am part of Trade Nation's Influencer program and receive a monthly fee for using their TradingView charts in my analysis.

MARI - PSX - Beginning of a Bull Run MARI is the market leader of PSX. Historically, on time cycles it has shown consolidation period of 43 days before going into a bull run spanning around 32 days. Price after making the falling wedge has broken the structure upwards and now has even crossed the recent Lower High 627.40 as well - which signals a trend reversal towards bull run.
Very good volumes are also experienced which are also confirmed by KVO which is a volume-based oscillator (blue line is almost at 60 degree angle going up). RSI is at 70 without any sign of reversal. Therefore, it would be a fair bet that we might see another cycle of bull run which should cross the previous all-time high (900.23) calculated on the basis of AB=CD or Fib based Extension tool.
A minor retrace at key levels is expected where one should book profit.
Trade Values
Buy-1: 649
Buy-2: 630 (if price dips)
TP-1: 740
TP-2: 840
TP-3: 900
TP-4: 1030
SL: 535

PIPPIN/USDT: LONG TRADE SETUP!!🚀 Hey Traders! PIPPIN Breakout Alert – Big Move Incoming? 👀🔥
If you’re excited for this setup, smash that 👍 and hit Follow for high-quality trade ideas that actually deliver! 💹🔥
🔥 PIPPIN Breakout & Retest – Time to Pump?
PIPPIN has broken out of a falling wedge on the 2H timeframe and is now retesting the breakout level. If this retest holds, we could see a strong rally ahead! 🚀
💰 Trade Setup:
📍 Entry: CMP, add more up to $0.019
🎯 Targets: $0.0225 / $0.0252 / $0.0294 / $0.0334
🛑 Stop-Loss: $0.018
⚡ Leverage: Low (Max 5x)
🔎 Strategy: Enter with low leverage now, scale in on dips, and ride the momentum to key targets!
💬 What’s Your Take?
Are you bullish on PIPPIN’s breakout? Drop your thoughts, analysis, and predictions in the comments! Let’s secure those gains and ride this wave together! 💰🚀🔥

ETH is Trying to SurviveETH has formed a descending wedge formation which could help itself to climb a little bit more higher.
Breaking above the accumulation box could lead to an upwards move for ETH.
You can get a long position around 1950.
Good Luck.

