ARUSDT: Major Move Incoming? Don’t Get TrappedYello, Paradisers! Is ARUSDT setting up for a big reversal, or are we about to see another wave of panic selling? Let’s break it down.
💎ARUSDT has been in a healthy retracement, forming a falling wedge pattern—a classic bullish reversal structure. Right now, the price is approaching a key support zone and the lower trendline of the wedge. This increases the probability of a bounce, but we need confirmation before taking any action.
💎Bullish I-CHoCH, W pattern, or an inverse head & shoulders on lower timeframes—these signals will strengthen the bullish case.
💎If price drops further due to panic selling, the next strong support zone will be critical. Again, we’ll wait for the same bullish reversal signs before making any moves.
💎However, if ARUSDT breaks down and closes candle below the strong support zone, it invalidates the bullish idea. In that case, we step back and wait for better price action before considering any entries.
🎖 Patience is key, Paradisers. Trading is not about guessing—it's about waiting for high-probability setups and executing with discipline. The market will reward those who wait for confirmation, while those who rush in will pay the price. Be the trader who plays it smart!
MyCryptoParadise
iFeel the success🌴
Wedge

McDonald's Long OpportunityIntroduction
This stock report analyzes the current market trends based on trend lines, chart formations, and potential breakouts. Using the provided chart, we identify key levels and possible trading opportunities.
Technical Analysis: Trend Lines and Formations
The chart analysis illustrates several trend lines, indicating a consolidation phase and a potential reversal pattern. Key aspects of the analysis:
Downtrend Channel: The upper resistance line shows a clear series of lower highs, indicating a downward trend structure.
Uptrend Support: The lower orange line represents a crucial support level, highlighting buying interest at lower price levels.
Breakout Signals: Multiple attempts to break above the upper resistance line suggest a potential trend reversal. If the price breaks above this resistance, an upward movement could follow.
Flag and Falling Wedge in Uptrend: The flag and falling wedge chart patterns signal a possible continuation of the existing uptrend. While the flag suggests a short-term consolidation within the trend, the falling wedge indicates a narrowing price range, often leading to a bullish breakout.
Key Zones for Trading
Resistance and Support Zones: The red and green zones mark significant selling and buying areas. A breakout above or below these levels could trigger a strong price movement.
Conclusion and Trading Strategy
The current market structure shows a tight trading range, indicating a possible breakout soon. Traders should watch for a confirmed break of the trend lines. A bullish breakout above the resistance level could present new buying opportunities, whereas failure to surpass this area might signal a continuation of the downtrend.

NVDA | Distribution Pattern to $97Follow up to the rising wedge pattern
After seeing price bounce off of trendline support 4 times then to finally breakout we could see the next moves sell off towards the discount zone
To add more confluence to this setup we're looking at the difference between price and indication and it's signaling a selloff based on divergence and the medium blue signal re-entering the 80/20 channel forecast bearish momentum stepping into play
I'm eyeing targets around $97 and the possibility of seeing movement back towards major resistance ($152) to re-confirm price structure for any further selling beyond $97
Stay posted for any major updates on price action.

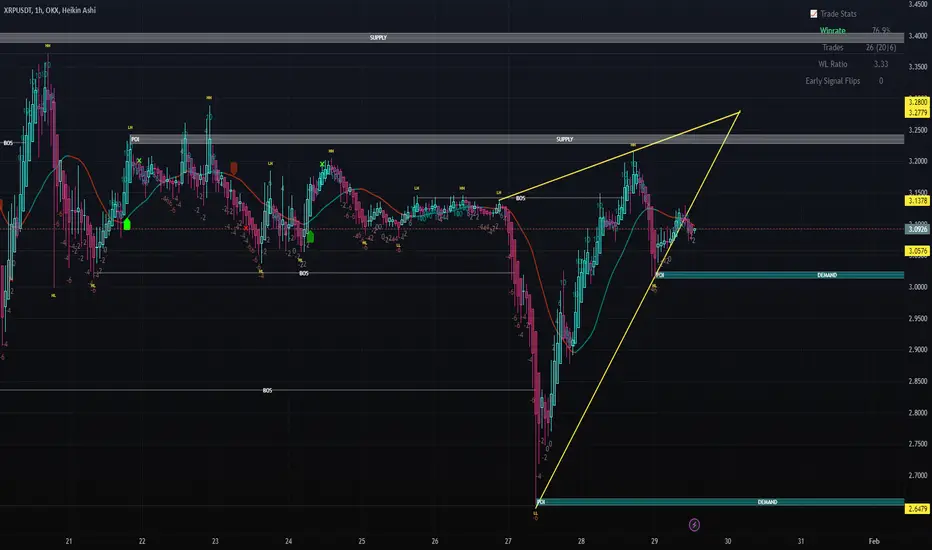
Updated XRP/USDT 1H Chart Analysis – Next 24 Hours OutlookKey Observations:
Rising Wedge Breakdown Risk (Bearish Bias)
XRP is still within a rising wedge, a bearish pattern that often leads to a breakdown.
Price is testing the lower trendline, indicating a crucial decision point.
Supply & Demand Zones:
Supply Zone (Resistance): 3.28 - 3.13 (Price struggled to break above)
Demand Zone (Support): 3.03 - 2.88 (Price approaching this area)
Lower Demand: 2.65, a strong historical level.
Support & Resistance Levels:
Immediate Resistance: 3.09 - 3.13
Immediate Support: 3.03 - 3.05
Next Major Support: 2.88, aligning with demand.
Break of Structure (BOS) & Price Action:
There is a break of structure (BOS) to the downside, indicating potential trend reversal.
If the wedge breaks down, XRP may move lower.
Potential Next Move (24H Forecast)
Bearish Scenario (Higher Probability, ~70%)
A break below 3.03 could send XRP to 2.88
If bearish momentum continues, 2.65 (lower demand zone) becomes a possible target.
Bullish Scenario (Lower Probability, ~30%)
If XRP holds 3.03, a bounce back to 3.09 - 3.13 is possible.
A break above 3.13 could push toward the 3.28 supply zone.
Final Conclusion:
Bearish Bias – XRP is more likely to break down and test 2.88 soon. If buyers don’t step in, 2.65 is the next key level.
FET - Artificial Superintelligence AllianceWeekly chart shows similar pattern formation within a clear ascending channel. We should go long step by step :)

MicroStrategy’s Make or Break MomentThe chart shows a breakdown from a descending wedge pattern, followed by a retest of the broken support turned resistance. A short position has been placed, anticipating further downside. The price is currently testing the retest zone, and rejection from this level could confirm continuation to the downside.
The stop-loss is strategically placed above 455.10, beyond a key resistance level, to minimize risk in case of a failed breakdown. The take-profit target is set near 224.56, aligning with a significant demand zone. The current price of 335.94 indicates minor volatility, but the structure suggests a potential bearish continuation if the price fails to reclaim the resistance zone.
If the breakdown holds, the next move could accelerate towards lower levels, making this a crucial moment for price confirmation. A reclaim of the resistance zone could invalidate the setup and trigger a short squeeze. The market’s reaction at this level will determine the next directional move.

The Next Few Days Will Decide Nikola’s FutureWas that drop to $0.80 just a bunch of stop-loss selling, or is Nikola diluting more shares to stay alive? Honestly, this stock feels like it’s heading either to $0.20 (bankruptcy) or somewhere around $3-$5 if some good news finally drops.
I’m leaning bullish because I think some big news could hit and send this thing flying. Right now:
• 88 million shares and a market cap of less than $85 million.
• The company’s assets alone are supposedly worth $1 billion.
• If there’s any positive news—like no bankruptcy or a glimmer of a future—this thing could easily triple overnight.
A $500 million market cap feels like fair value for a business projecting $150-$300 million revenue in 2025, which would put the stock around $5 per share.
The chart needs to confirm some momentum. Watch for a daily close above the 20MA and breaking out of those falling wedges. Some wedges have been forming since 2023 and others just started more recently, around August and December 2024.
If it starts clearing these levels, we could see a decent move up. This is a gamble but Nikola is already making trucks and bringing in revenue. Companies like that don’t go bankrupt that easily. And even if they run out of cash, their assets are super valuable, and someone would probably step in to buy them out, merge, or loan them money.
The Bottom Line:
It’s risky, and it might go to zero, but there’s a decent chance Nikola could bounce back hard. If they avoid bankruptcy and just get some solid news, this thing could explode.

$NYSE:OKLO breaking a Wedge/Flag with short term 25%-60% upsideNYSE:OKLO is breaking out of a consolidation pattern (falling wedge) And what appears to be a flag pattern.
Confirmation is a 24% uptick in price along with strong volume.
Initial Price Target is ~$34.50 to complete the falling wedge pattern, which is a short term 25% upside.
Secondary Price Target is ~$42.90 to complete the flag pattern, which is a longer term 60% upside
Good Luck!

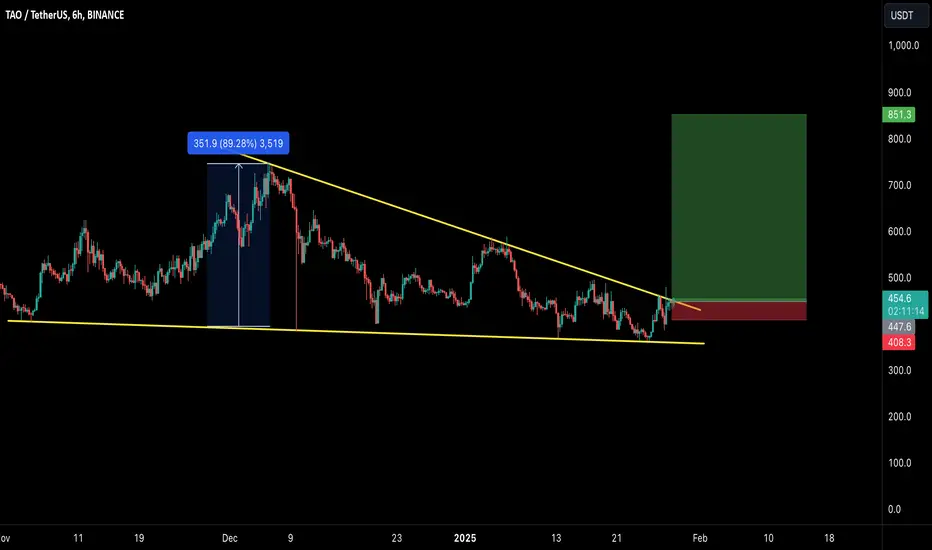
TAO/USDT: LOOKS READY TO GO ABOVE $800 MARK!!🚀 Hey Traders! Ready to Ride the TAO Wave? 👋
If this setup excites you, smash that 👍 and hit Follow for premium trade ideas that deliver real results! 💹🔥
TAO is looking primed for action! Breaking out of a falling wedge pattern on the 6-hour timeframe, it’s signaling a potential 80-90% upside move. 📈🔥
💡 Here’s the Plan:
📌 Entry Range: Current Market Price (CMP) and add more up to $430.
🎯 Targets:
Target 1: $530
Target 2: $620
Target 3: $710
Target 4: $850
🛡️ Stop Loss (SL): $400
⚙️ Leverage: Use low leverage (Max 5x) for a safer approach.
💬 What’s Your Take?
Are you bullish on TAO’s breakout potential? Drop your analysis, strategies, or predictions in the comments! Let’s crush this market and lock in those gains together! 💰🚀
EURO - Price can little correct and then bounce up to $1.0580Hi guys, this is my overview for EURUSD, feel free to check it and write your feedback in comments👊
A few moments ago price traded inside flat, where it reached $1.0450 level and then dropped to $1.0270 level.
After this, Euro turned around and rose to almost $1.0450 level, after which turned around and started to fall in wedge.
Price fell to support line of wedge and then at once bounced up, breaking $1.0270 level one more time.
Next, EUR some time traded near this level and when it reached support line of wedge, it continued to move up.
In a short time, price reached $1.0450 level, broke it, and rose to resistance line of wedge, after which corrected.
So, I think that price can fall to support area and then bounce up to $1.0580, exiting from wedge.
If this post is useful to you, you can support me with like/boost and advice in comments❤️

#ZECUSDT #1h (ByBit) Falling broadening wedge breakoutZcash regained 50MA support and broke out bullish on hourly, looks good for short-term recovery towards 200MA resistance and more.
⚡️⚡️ #ZEC/USDT ⚡️⚡️
Exchanges: ByBit USDT
Signal Type: Regular (Long)
Leverage: Isolated (10.0X)
Amount: 4.8%
Current Price:
49.41
Entry Targets:
1) 48.62
Take-Profit Targets:
1) 52.63
Stop Targets:
1) 46.61
Published By: @Zblaba
$CRYPTO:ZEC BYBIT:ZECUSDT.P #Zcash #Privacy z.cash
Risk/Reward= 1:2.0
Expected Profit= +82.5%
Possible Loss= -41.3%
Estimated Gaintime= 2-3 days

CADCHF ShortBearish break of the market structure symbolizes bears still on the move to the downside. With prices ready for a retest before continuing.

Will Allakos Inc. return 10,000% ?? Maybe even 20,000%
This is a 20,000% return idea from current price action. If you missed out on the QUBT trade (below) and find yourself filled with regret at the inaction taken… Then Merry Christmas...
On the above 15 day chart price action has corrected a massive 99.5% from $166 since early 2021. A number of reasons now exist to take advantage of this discount. They include:
1) Price action and RSI resistance breakouts.
2) Strong regular positive divergence. Recognise this divergence prints at a time price action resistance breaks out and prints support on past resistance from a 4 year active resistance downtrend.
3) No share splits!
4) “Off-Exchange Short Volume Ratio 39.57%” - who are these people?
5) The forecast comes from the wedge breakout. Top and bottom touch points are used to measure the forecast area
Is it possible price action continues to correct? Sure.
Is it probable? No
Ww
Type: Trade
Risk: You decide
Timeframe for long: QUBT danced around 60 cents for a month or so, people got bored, others left in frustration… do you want to see my inbox as price blasted past $6 ?? Filled with regrets from folks unable to exercise patience.
Return: 2,500% in the first wave
Stop loss: Will say elsewhere


EURUSD -Bullish Falling WedgeHello Traders !
On the daily time frame,
The EURUSD price formed a falling wedge pattern.
At the moment, The lower high is broken !
So, I expect a bullish move📈
_______________
TARGET: 1.05630🎯

Be careful with LINKUSDT !!!The price couldn't break the wedge and is now consolidating until the trendline. After that, we can say that we might reach above the wedge again.
Give me some energy !!
✨We spend hours finding potential opportunities and writing useful ideas, we would be happy if you support us.
Best regards CobraVanguard.💚
_ _ _ _ __ _ _ _ _ _ _ _ _ _ _ _ _ _ _ _ _ _ _ _ _ _ _ _ _ _ _ _
✅Thank you, and for more ideas, hit ❤️Like❤️ and 🌟Follow🌟!
⚠️Things can change...
The markets are always changing and even with all these signals, the market changes tend to be strong and fast!!
