BONK Bullish Reversal in PlayAfter a clean 5-wave advance from the April low, CRYPTO:BONKUSD corrected 55%, then carved out a higher low last month. Now it’s eyeing a breakout above the May peak as the next leg higher begins.
Wedge

AAVE Breakdown Could Trigger Major DropYello Paradisers — did you spot the bearish setup forming on AAVEUSDT? If not, you might already be a step behind, but there’s still a high-risk-reward opportunity on the table — if you approach it with discipline.
💎Currently, AAVEUSDT is looking increasingly bearish. The asset has confirmed a bearish Change of Character (CHoCH), broken down from a rising wedge pattern, and is showing clear bearish divergence on the chart. These combined signals suggest that the probability of further downside is increasing.
💎From here, there are two main scenarios we’re monitoring. First, AAVE could attempt a pullback to fill the Fair Value Gap (FVG) above, which would offer a clean short-entry zone with strong risk-reward potential. Alternatively, price could reject directly from the nearby Bearish Order Block (OB), offering another chance for well-structured entries. Both setups depend on confirmation and timing, so patience is key.
💎However, if AAVE breaks and closes decisively above the current resistance zone, the bearish thesis becomes invalid. In that case, the best move is to wait on the sidelines and allow new, higher-quality price action to form before re-engaging.
💎This market demands patience and discipline. You don’t need to catch every move — just the right ones. Stay sharp, stay focused, and let the market come to you.
Strive for consistency, not quick profits. Treat the market as a businessman, not as a gambler.
MyCryptoParadise
iFeel the success🌴

Gold will exit from pennant and then rise to resistance levelHello traders, I want share with you my opinion about Gold. Recently, the price formed a pennant pattern after a sharp bullish impulse from the buyer zone (3275–3285 points). That upward movement started after the price bounced off the strong support level (3285) and broke out from the wedge structure formed earlier. This bullish momentum indicated strong demand near the lower boundary, reinforcing the current market structure. Now, the price is consolidating inside the pennant formation, slowly approaching its apex. At the same time, we are still above the support trendline and close to the upper border of the pattern. This suggests a possible breakout to the upside. I expect that gold will soon exit the pennant and start rising again toward the resistance level at 3385, which also matches the seller zone (3385–3395 points). This area previously acted as a major reversal zone, so if price reaches it, I will consider locking profits at that point. Given the breakout structure, recent bounce from the buyer zone, and current bullish consolidation, I remain bullish and expect GOLD to continue growing toward TP 1 at 3385. Please share this idea with your friends and click Boost 🚀
Disclaimer: As part of ThinkMarkets’ Influencer Program, I am sponsored to share and publish their charts in my analysis.

MarketBreakdown | USDJPY, USDCAD, BITCOIN, SILVER
Here are the updates & outlook for multiple instruments in my watch list.
1️⃣ #USDJPY daily time frame 🇺🇸🇯🇵
The market nicely respected a rising trend line
and bounced from that, forming a high momentum bullish candle.
I think that the pair will continue rising and reach 145.8 level soon.
2️⃣ #USDCAD daily time frame 🇺🇸🇨🇦
The price is currently approaching an important confluence
zone based on a falling trend line and a horizontal support.
I will expect a pullback from that.
3️⃣ #BITCOIN #BTCUSD daily time frame
The price successfully violated a resistance line of a bullish
flag pattern and closed above that.
It is a critical bullish signal. I believe that the price will test
a current high then and will violate that with a high probability.
4️⃣ #SILVER #XAGUSD daily time frame 🪙
The market broke a resistance line of a bullish flag.
Uptrend is going to continue, and the price is going to reach 37,14 level soon.
Do you agree with my market breakdown?
❤️Please, support my work with like, thank you!❤️
I am part of Trade Nation's Influencer program and receive a monthly fee for using their TradingView charts in my analysis.

GOLD → Consolidation after a trend break...FX:XAUUSD , after breaking out of a downtrend, is consolidating, which may continue for some time due to Thursday's news and low liquidity on Friday.
Gold stabilized after a correction, but volatility risks remain. After falling from a weekly high of $3,366, gold prices found demand again in Asia on Friday. Strong US employment data cooled expectations of an imminent Fed rate cut, which supported the dollar and limited gold's gains. Additional pressure is coming from the hawkish shift in Fed expectations, but US budget risks and weak liquidity due to the holidays could increase price volatility in the coming days.
Technically, the focus is on the boundaries of the current consolidation at 3311 and 3357. In addition, within the range there is an important level of 3325, which divides the market into bearish and bullish zones...
Resistance levels: 3350, 3357, 3393
Support levels: 3325, 3311
It is important to understand the situation: due to the holiday in the US, liquidity is lower, making it easier to move the price. The rest of the world, interested in gold, can easily push the price up. The trigger will be the zone 3350 - 3350. There is a chance that the market will try to break through the resistance without a pullback and continue to rise to 3393.
However, the most likely scenario is that after yesterday's volatility, gold will remain within 3325 - 3357 before rising next week
Best regards, R. Linda!

EIHotel,1W , Bullish it has formed a flag Pattern and ready to breakout of pattern , wait until weekly strong close and take the trade with proper risk management and proper position sizing .
Follow for more Swing Ideas Like this

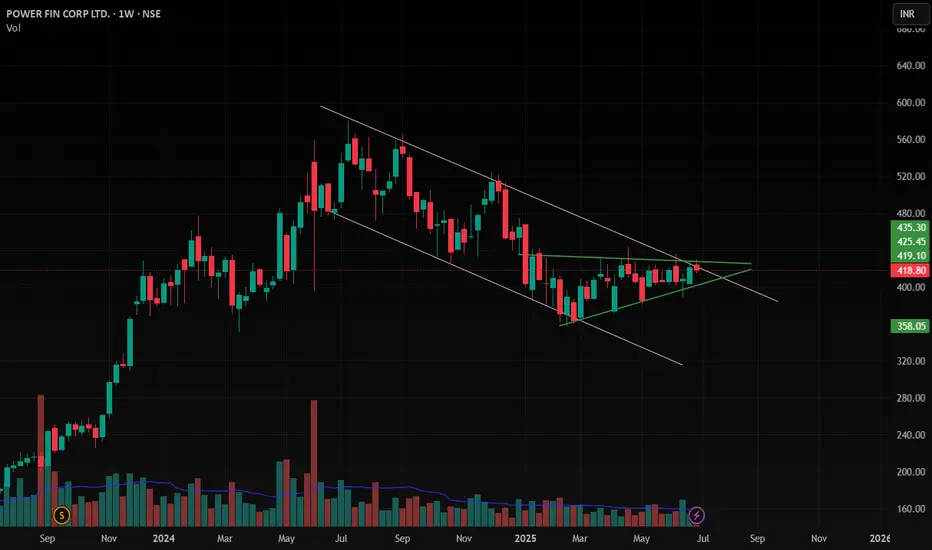
PFC , 1W , Bullishit has formed a Very Good Pattern and Ready to giving a Breakout and Wait patiently for Weekly close , after that enter into Trade , follow proper position sizing and follow risk management
follow for more Swing Ideas like this
AjantaPharma ,1W , Bullish it has Formed a Very Good Pattern in Weekly and giving Breakout ,Take the Trade after Strong Weekly Close and put the Sl below its Swing low and Follow Proper Risk Management
Follow for More Swing Ideas like this

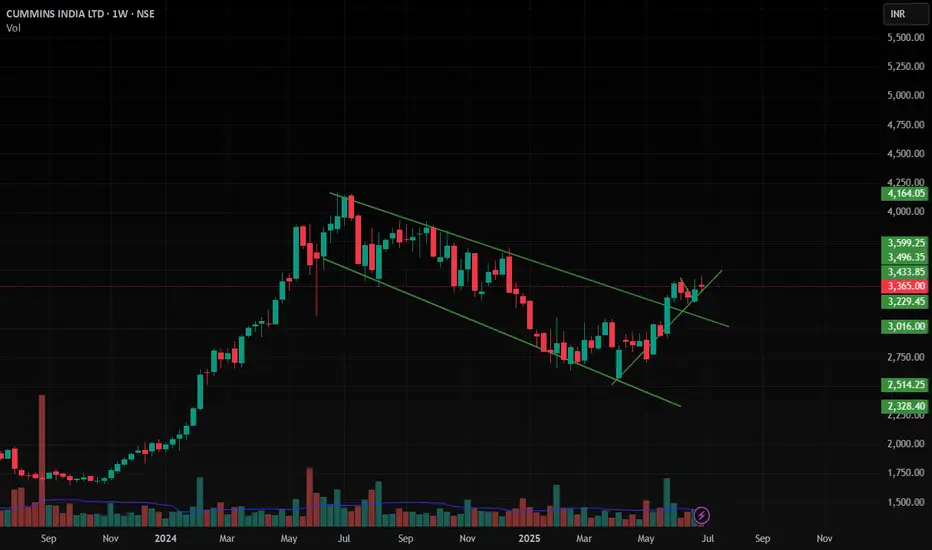
Cumminsind , 1W, Bullishit has Formed a very Good Pattern and Given a Breakout with Good Volume and now it is Trending to Up side ,
Follow proper position sizing and Risk Management
Follow for More Swing Ideas Like this
Ultracemco , 1W , Bullish As Ultracemco is Formed pattern and giving Breakout Now , Watch Carefully after Weekly Confirmation and Take Trade and follow proper Position Sizing and Risk according to your account size
follow for More Swing Ideas like this

UPL , 1W , Weekly Bullish As the UPL pattern is looking very Good and Giving Breakout and Enter only after the Close of Weekly time frame .
follow your risk Management , proper Position Sizing

XAUUSD Forming Triangle Pattern – Eyeing Breakout After Wave (e)🚨 Gold (XAUUSD) Technical Analysis – 3H Chart
Gold is currently forming a classic contracting triangle pattern (ABCDE), with wave (e) in progress. Price is bouncing from a strong buyers’ zone near 3269.60, showing signs of upward pressure.
📊 Current Structure:
Wave count: (a)-(b)-(c)-(d)-(e)
Consolidation within a symmetrical triangle
Key support: 3269.60
Resistance zone to watch: 3408.00
📈 Potential Scenario:
If price holds above the buyer’s zone, we can expect a bullish wave (e) push towards the upper trendline at 3408, potentially leading to a breakout continuation.
📍 Trade Plan (Educational Purpose):
Long Setup Valid Above: 3269.60
Target: 3408.00
Stop Loss (SL): Below 3260 (based on your risk profile)
---
🧠 Why This Matters?
This triangle setup often leads to strong breakout moves, especially in commodities like gold during fundamental uncertainty or dollar index shifts. The market is compressing — be prepared for the breakout move.
---
📢 Follow for more clean Elliott Wave + Price Action setups!
💬 Drop your analysis in the comments. Let’s grow together!

XRP Alert: $3 Bets Dominate as Massive "Wedge" Pattern SignalThe Anatomy of a Sleeper Awakened: Analyzing the $3 XRP Bet and the Decisive XRP/BTC Technical Pattern
In the relentless and often forgetful cycle of the cryptocurrency market, assets can fall into long periods of dormancy. They become laggards, overshadowed by newer, faster-growing projects, their communities tested, and their price action a flat line of disappointment on a chart full of parabolic curves. For years, XRP has been the quintessential example of such an asset. Plagued by a protracted legal battle with the U.S. Securities and Exchange Commission (SEC) and consistently underperforming its large-cap peers, it became the subject of both unwavering belief from its dedicated "XRP Army" and derision from the wider market.
However, the quietest corners of the market often hide the most tension. Beneath the surface of sideways price action, a confluence of powerful forces is beginning to emerge, suggesting that this slumbering giant may be on the verge of a violent awakening. This shift is not signaled by mainstream headlines or celebrity endorsements, but by the sophisticated and often predictive language of derivatives markets and inter-market technical analysis.
Two specific, potent signals have captured the attention of astute market observers. The first is a stunning development in the XRP options market, where call options with a $3 strike price are inexplicably dominating trading volumes. This is not a modest bet on a 20% gain; it is an audacious, seemingly irrational wager on a 500-600% price explosion. The second is a multi-year technical pattern on the XRP/BTC chart—a massive falling wedge that suggests XRP is coiling for a major rally, not just in dollar terms, but against the market's undisputed king, Bitcoin.
This analysis will conduct a deep dive into these two phenomena. We will dissect the implications of the $3 options bet, exploring the psychology and mechanics behind such speculative fervor. We will then meticulously break down the XRP/BTC wedge pattern, explaining its significance as a measure of relative strength and its potential to unleash a powerful wave of capital rotation. Finally, we will connect these market signals to the underlying fundamental drivers—the aftermath of the SEC lawsuit, Ripple's ongoing business development, and the broader market cycle dynamics—to construct a holistic thesis. While the road ahead is fraught with risk and uncertainty, the evidence suggests that the narrative surrounding XRP is undergoing a seismic shift, moving from a story of legal battles and stagnation to one of profound, speculative optimism.
________________________________________
Part 1: Decoding the Options Market Frenzy - The Audacity of the $3 Bet
To the uninitiated, the options market can seem like an esoteric and complex casino. In reality, it is a sophisticated mechanism for hedging risk and placing directional bets, and the data it generates provides an invaluable window into the collective mind of the market. The current activity in the XRP options market is not just a flicker of interest; it is a roaring fire of speculative conviction centered around a single, audacious number: $3.
Understanding the Language of Options
Before dissecting the significance of this event, it is crucial to understand the basic mechanics at play. A call option gives the buyer the right, but not the obligation, to purchase an asset at a predetermined price (the strike price) on or before a specific date (the expiration date).
For example, a trader buying an XRP call option with a $3 strike price is betting that the price of XRP will rise significantly above $3 before the option expires. If XRP were to reach, say, $4, the trader could exercise their option to buy XRP at $3 and immediately sell it for $4, pocketing the difference.
The key takeaway is that these options are leveraged instruments. A trader can control a large amount of XRP for a small upfront cost (the premium). However, if the price of XRP does not exceed the strike price by the expiration date, the option expires worthless, and the trader loses their entire premium. This makes buying far out-of-the-money (OTM) call options—where the strike price is significantly higher than the current market price—an extremely high-risk, high-reward strategy.
The Significance of the $3 Strike Price
The current market price of XRP hovers around $0.50 to $0.60. A $3 strike price, therefore, is not a bet on incremental gains. It is a bet on a monumental, life-changing rally of approximately 500%. This is what makes the situation so extraordinary. The fact that this specific strike price is the most traded in terms of volume indicates a massive concentration of speculative interest.
This phenomenon can be interpreted in several ways:
1. Extreme Bullish Conviction: The most straightforward interpretation is that a significant number of traders, from retail speculators to potentially larger funds, harbor a deep-seated belief that a major catalyst is on the horizon. This could be related to a final, favorable resolution in the SEC case, a major partnership announcement by Ripple, or the anticipated effects of a full-blown crypto bull market lifting all boats, with XRP expected to be a primary beneficiary. They are willing to risk a small premium for a chance at an exponential payout.
2. "Lottery Ticket" Mentality: A more skeptical view is that these are akin to lottery tickets. The premiums on these far OTM options are relatively cheap. A trader might spend a few hundred dollars on $3 calls, fully accepting that they will likely expire worthless. However, in the infinitesimally small chance that XRP does experience a black swan event to the upside, that small investment could turn into tens of thousands of dollars. It is a bet on volatility and a low-probability, high-impact event, rather than a nuanced analysis of fair value.
3. Potential for a Gamma Squeeze: This is a more complex but critical possibility. When a large number of call options are purchased, the market makers who sell these options are left with a short position. To hedge their risk, they must buy the underlying asset (XRP). As the price of XRP begins to rise and approach the strike price, the market makers' risk increases exponentially, forcing them to buy more and more XRP to remain hedged. This reflexive loop—rising prices forcing more buying, which in turn pushes prices even higher—is known as a gamma squeeze. The massive open interest at the $3 strike, while currently far away, builds a foundation of potential explosive fuel. If a rally were to gain serious momentum and push past $1, then $1.50, the hedging pressure on market makers would begin to mount, potentially turning a strong rally into a parabolic one.
4.
Analyzing the Volume and Open Interest
"Dominating trading volumes" means that more contracts for the $3 strike are changing hands daily than for any other strike price, whether it's a more conservative $0.75 or $1.00 call. This indicates active, ongoing betting. Open interest, on the other hand, refers to the total number of outstanding contracts that have not been settled. High open interest at the $3 strike signifies that a large number of participants are holding these positions, not just day-trading them. They are maintaining their bet over time, waiting for the anticipated price move.
The sheer concentration of both volume and open interest at such a high strike price is a powerful sentiment indicator. It tells us that the "smart money" or, at the very least, the most aggressive speculative capital, is not positioning for a minor recovery. It is positioning for a complete and total repricing of the asset. While this does not guarantee the outcome, it creates a self-fulfilling prophecy dynamic. The knowledge that this much speculative interest exists can itself attract more buyers, who want to front-run the potential squeeze.
________________________________________
Part 2: The Technical Tale of the Tape - XRP/BTC's Coiled Spring
While the options market provides a glimpse into the speculative sentiment surrounding XRP's dollar value, a far more profound story is being told on the XRP/BTC chart. This trading pair is arguably one of the most important long-term indicators for any altcoin, as it measures its performance not against a fiat currency, but against the crypto market's center of gravity: Bitcoin.
The Crucial Importance of the XRP/BTC Pair
When XRP/USD rises, it can simply mean the entire crypto market, led by Bitcoin, is in an uptrend. However, when XRP/BTC rises, it signifies something much more powerful: XRP is outperforming Bitcoin. This means that capital is actively rotating out of the market leader and into XRP, seeking higher returns. A sustained uptrend in the XRP/BTC pair is the hallmark of a true "altcoin season" for that specific asset and is often the precursor to the most explosive, parabolic moves in its USD valuation.
For the past several years, the XRP/BTC chart has been a painful sight for XRP holders. It has been in a brutal, grinding downtrend, meaning that even when XRP's dollar price rose, holding Bitcoin would have been a more profitable strategy. This long period of underperformance, however, has forged one of the most powerful bullish reversal patterns in technical analysis: a falling wedge.
Anatomy of the Falling Wedge
A falling wedge is a technical pattern that forms when an asset's price makes a series of lower highs and lower lows, with the two trendlines converging. The key characteristic is that the lower trendline (support) is less steep than the upper trendline (resistance).
• Psychology Behind the Pattern: The pattern represents a battle between buyers and sellers where the sellers are gradually losing their momentum. Each new push lower by the bears is met with more resilience from the bulls, and the price fails to fall as far as it did previously. The contracting range signifies that volatility is decreasing and energy is being stored. It is a period of consolidation that often precedes a major trend reversal. The bears are getting exhausted, and the market is coiling like a spring.
• The Breakout: The bullish signal is triggered when the price breaks decisively above the upper trendline (resistance) of the wedge. This breakout indicates that the balance of power has finally shifted from the sellers to the buyers. A valid breakout is typically accompanied by a significant increase in volume, confirming the conviction behind the move.
• Price Target: Technical analysts often measure the potential price target of a wedge breakout by taking the height of the wedge at its widest point and adding it to the breakout point. Given that the XRP/BTC wedge has been forming for several years, its height is substantial, suggesting that a successful breakout could lead to a rally of 200-300% or more against Bitcoin.
Analyzing the XRP/BTC Chart
The multi-year falling wedge on the XRP/BTC weekly and monthly charts is a textbook example of this pattern. It encapsulates the entire bear market and period of underperformance since the previous cycle's peak. The price has been tightening into the apex of this wedge for months, signaling that a resolution is imminent.
A breakout from this pattern would be a technical event of immense significance. It would signal the end of a multi-year bear market against Bitcoin and the beginning of a new cycle of outperformance. Traders and algorithms that monitor these patterns would interpret it as a major "buy" signal, potentially triggering a flood of new capital into XRP.
This technical setup provides a logical foundation for the seemingly irrational optimism seen in the options market. The traders betting on $3 XRP are likely looking at the XRP/BTC chart and seeing the same thing: the potential for a violent and sustained reversal. A 200% rally in XRP/BTC, combined with a rising Bitcoin price in a bull market, could easily provide the momentum needed to propel XRP's dollar valuation into the multi-dollar range. The two signals are not independent; they are two sides of the same coin, reflecting a deep and growing belief in an impending, historic rally.
________________________________________
Part 3: The Fundamental Undercurrents - The 'Why' Behind the 'What'
The explosive options activity and the powerful technical pattern are the "what." They are the observable phenomena. But to build a robust thesis, we must understand the "why." What fundamental shifts are occurring to justify this renewed optimism? The answer lies in a combination of legal clarity, steady business development, and predictable market cycle dynamics.
The Aftermath of the Ripple vs. SEC Lawsuit
The single greatest cloud hanging over XRP for years has been the SEC lawsuit, filed in December 2020, which alleged that XRP was an unregistered security. This created massive regulatory uncertainty, leading to its delisting from major U.S. exchanges and causing institutional capital to shun the asset.
In July 2023, a landmark summary judgment was delivered by Judge Analisa Torres. The key takeaways were:
1. Programmatic Sales of XRP on exchanges do not constitute securities transactions. This was a monumental victory for Ripple and the XRP community. It provided the legal clarity that exchanges needed to relist XRP, and it affirmed that for the average retail buyer, XRP is not a security. This removed the primary existential threat to the asset.
2. Institutional Sales of XRP were deemed securities transactions. This was a partial victory for the SEC, but it was confined to Ripple's direct sales to institutional clients in the past.
While the case is not fully over—with final remedies and penalties for institutional sales still being determined—the market has correctly interpreted the main ruling as a decisive win. The risk of XRP being declared a security across the board has been neutralized. This clarity is the single most important fundamental catalyst. It allows exchanges, investors, and partners to engage with XRP with a level of confidence that was impossible just a few years ago. The market is now looking past the remaining legal wrangling and focusing on the future.
Ripple's Unwavering Business Development
Throughout the entire legal battle, Ripple, the company, never stopped building. Its core mission is to use blockchain technology to improve cross-border payments, a multi-trillion dollar industry ripe for disruption. XRP, the digital asset, is central to its flagship product, Ripple Payments (formerly On-Demand Liquidity or ODL). This service uses XRP as a bridge currency to enable instant, low-cost international payments without the need for pre-funded nostro/vostro accounts.
Ripple has been steadily expanding its payment corridors, securing licenses in key jurisdictions like Singapore, Dubai, and Ireland, and forging partnerships with financial institutions around the globe. Furthermore, the company is actively involved in the development of Central Bank Digital Currencies (CBDCs), piloting its technology with several nations.
The recent announcement of a Ripple-issued stablecoin pegged to the U.S. dollar further expands its ecosystem. This move positions Ripple to compete in the massive and growing stablecoin market, leveraging the XRP Ledger's speed and efficiency.
This steady, behind-the-scenes progress provides a fundamental anchor to the speculative bets being placed. Unlike many crypto projects that are built on hype alone, Ripple has a real-world use case, a functioning business, and a clear strategy for capturing a share of the global payments market. The resolution of the SEC case allows this fundamental value proposition to finally come to the forefront.
The Inevitable Laggard Rotation
Finally, the optimism surrounding XRP can be explained by classic crypto market cycle dynamics. A typical bull market cycle follows a predictable pattern of capital rotation:
1. Bitcoin Leads: Capital first flows into Bitcoin, the market's most established and trusted asset.
2. Rotation to Ethereum: As Bitcoin's gains begin to slow, profits are rotated into Ethereum, the leading smart contract platform.
3. Large-Cap Altcoins: Capital then flows from Ethereum into other large-cap altcoins.
4. The Laggard Rally: Finally, in the latter stages of a bull run, traders seek out assets that have underperformed, or "lagged," the market. These laggards, often older coins with strong communities, can experience explosive catch-up rallies as a flood of speculative capital seeks the next big move.
XRP is the archetypal laggard. It has massively underperformed both Bitcoin and Ethereum for years. The bets being placed now—both in the options market and on the XRP/BTC chart—are a clear anticipation of this final, powerful stage of the market cycle. Traders are positioning themselves to front-run the great capital rotation into one of the market's most well-known but long-neglected assets.
________________________________________
Part 4: A Sobering Perspective - Risks and Counterarguments
No analysis would be complete without a balanced look at the potential risks that could invalidate the bullish thesis. While the confluence of signals is powerful, success is far from guaranteed.
1. The Options Trap: The most obvious risk is that the $3 call options are simply a mirage. The vast majority of far out-of-the-money options expire worthless. This could be nothing more than a wave of irrational exuberance from retail traders that ultimately amounts to nothing, leaving a trail of lost premiums.
2. The False Breakout: Technical patterns can fail. The XRP/BTC wedge could experience a "fakeout," where the price briefly breaks above the resistance line only to be aggressively sold back down, trapping hopeful buyers and resuming the downtrend.
3. Lingering Legal Headwinds: While the main ruling was a victory, the final penalty in the SEC case could be larger than anticipated, generating negative headlines and creating short-term selling pressure. Any future regulatory actions targeting other aspects of the crypto space could also have a chilling effect.
4. Adoption and Competition: Ripple's success is not preordained. The cross-border payments space is fiercely competitive, with traditional players like SWIFT innovating and other blockchain projects vying for market share. The ultimate success of Ripple's business model—and by extension, the utility-driven demand for XRP—is still a long-term question.
5. Centralization and Supply Concerns: A long-standing criticism of XRP is the centralized nature of its ledger and the large portion of the total XRP supply held in escrow by Ripple Labs. While Ripple has a predictable schedule for releasing this escrow, it represents a potential source of selling pressure and a point of concern for those who prioritize decentralization above all else.
Conclusion: The Convergence of Evidence
The case for a significant XRP rally is a tapestry woven from multiple, converging threads of evidence. It is not based on a single indicator but on a powerful confluence of speculative sentiment, technical structure, and fundamental catalysts.
The frenzied buying of $3 call options is the market screaming its ambition, a raw and unfiltered signal of extreme bullishness. It is a bet not just on recovery, but on a complete paradigm shift in the valuation of XRP. This audacious sentiment finds its technical justification in the multi-year falling wedge on the XRP/BTC chart—a coiled spring of potential energy that, if released, would signal a historic rotation of capital into the long-suffering asset.
Underpinning these market signals is a strengthening fundamental picture. The crucial legal clarity from the SEC lawsuit has removed the single greatest obstacle to XRP's progress, allowing the market to finally price in the steady, persistent work Ripple has done in building a global payments network. Combined with the predictable dynamics of a crypto bull cycle, where laggards eventually have their day in the sun, the stage appears to be set.
The journey to $3—and beyond—is still a marathon, not a sprint. It is fraught with the risks of failed patterns, expiring options, and the inherent volatility of the crypto market. However, for the first time in years, the narrative is not one of defense but of offense. The signals are clear: the market is no longer asking if the sleeper will awaken, but is now placing massive, leveraged bets on the magnitude of the roar it will make when it does. The current moment represents the starting gun, and for traders and investors who have been watching from the sidelines, the race for XRP's repricing may have just begun.

VOXIES Breakout Alert: Falling Wedge Pattern ConfirmedVOXIES has finally broken out of the falling wedge pattern, a bullish signal.
Price was getting squeezed inside this wedge for weeks, but now it’s showing signs of strength. If momentum continues, we could see a solid move toward the next resistance zone.
The breakout looks clean, and as long as it holds above the wedge, upside potential remains intact.
Keep an eye on it, this might just be the start.
DYOR, NFA

GOLD - Price can continues rise to resistance level and break itHi guys, this is my overview for XAUUSD, feel free to check it and write your feedback in comments👊
Price made an upward impulse from the support line of the triangle and rose to the resistance line, breaking two levels.
Then the price dropped back, after which repeated impulse and exited from the triangle, reaching the resistance area.
After this movement, Gold started to trades inside a wedge, where it dropped from the resistance line to the support line.
Next, the price in a short time rose from this line to the resistance line again, breaking $3230 and $3400 levels.
But recently, it made a correction to the support line, breaking $3400 level again, and then started to grow.
Now, I expect that Gold can little decline and then continue to move up to $3470, breaking the resistance level.
If this post is useful to you, you can support me with like/boost and advice in comments❤️
Disclaimer: As part of ThinkMarkets’ Influencer Program, I am sponsored to share and publish their charts in my analysis.

PEPE/USDT – Falling Wedge Breakout!Hey Traders — if you're into high-conviction setups with real momentum, this one’s for you.
CRYPTOCAP:PEPE has finally broken out from the falling wedge structure on the 4H chart after weeks of consolidation. This is a bullish reversal pattern that historically leads to explosive upside moves.
✅ Breakout Confirmed
✅ Above the 100 EMA
✅ Volume picking up post-breakout
🎯 Targets:
$0.0115/0.0126 / 0.0138 / 0.0147+
🛑 Stop Loss: 0.00975
⚡ Leverage: 5x-10x max (Scalp/Short-term swing)
If momentum sustains, we might see 40%+ move.
Let’s ride the wave. Stay sharp!

BTC Dominance – History Repeating? Altseason 2025 Loading? Hey Traders!
If you’re finding value in this analysis, smash that 👍 and hit Follow for high-accuracy trade setups that actually deliver!
This chart is SCREAMING for attention 👀
We’re at a critical inflection point on the weekly BTC Dominance chart — and if history has taught us anything, it’s that altseasons are born when dominance collapses from resistance.
🧠 Key Observations:
🔺 Macro Resistance Trendline:
Rejected in 2017 → Altseason 🔥
Rejected in 2021 → Altseason 🔥
Now (2025?) — BTC.D is again touching this same red trendline...
🟢 Support Trendline:
BTC.D formed a clean long-term support from which previous dominance drops have bounced — currently lining up around 42–45%.
📉 Previous drops after rejection:
2017: –50.79%
2021: –45.10%
2025 projection? –36.91% (which would bring us to the same support zone again)
🟡 What It Means:
If BTC.D gets rejected from this resistance again, it could mark the start of the long-awaited Altseason 2025. A breakdown from this wedge would likely result in capital rotation from BTC into altcoins — just like in previous cycles.
🔍 What to Watch:
A confirmed rejection from this red resistance line
Drop below the yellow wedge support
BTC sideways / ETHBTC strength = green light for ALTS
💥 This could be the altcoin opportunity of the next couple of years.
Conclusion:
All eyes on BTC Dominance — because when it falls, altcoins usually FLY.
📊 Stay updated, stay ready.

ABC Flat correction? Verifiably had Elliot wave impulse wave that reach completion. Going sideways was the correction. There’s either gonna be a breakout, which is likely, Or a correction to the downside.
Since it is Fourth of July weekend, There’s plenty of room for global markets to greatly impact weekend trading. We’ll know by Monday, what Trump has said, what Elon has done, And with the wars results are.
Hold on tight.
Any correction to the downside is opportunity for institutions to further increase their anchor hold greater chunks of market liquidity.
That’s all for today.
Welcome back,
Sincerely yours
Paul Dorz

Fallihg Wedge on AeroUSDT Reason to buy:
1. There's a falling wedge pattern in daily timeframe
2. Good volume
3. Stochastic oversold
4. Risk reward ok

XRPUSDT → Resistance retest. Coin inside the flatBINANCE:XRPUSDT is rising towards resistance at 2.3288 due to a shift in the fundamental background to positive and a rally in Bitcoin, but there is always a but...
On the daily chart, XRP is trading below strong trend resistance, and there is also a fairly strong and voluminous liquidity pool at 2.3300 ahead, which could provide strong resistance. Bitcoin is also approaching its critical level of 110500, which may temporarily hold back growth, and a correction in the flagship could trigger a correction in the rest of the market...
Focus on resistance and the liquidity pool at 2.3288. A sharp approach and capture of liquidity without the possibility of continuing growth could lead to a correction by half or the entire local range (to 2.16).
Resistance levels: 2.3288, 2.357, 2.45
Support levels: 2.25, 2.213, 2.16
If the retest of resistance at 2.3288 ends in a false breakout, then subsequent consolidation below the level could trigger a correction to the above support and interest zones.
Best regards, R. Linda!

AUDCHF AUDCHF is preparing to break through support and fallWeak market structure. Gradually declining lows and no reaction to support at 0.5211. Buyers are trying to keep the price above 0.5211, but under market pressure their strength is weakening.
Relative to 0.5211, we see the formation of consolidation, which is of a “pre-breakdown” nature.
Accordingly, a break below the 0.5211 support level could trigger the activation of buyers' SL orders, leading to liquidation and a downward price distribution.
Potential targets include 0.518 and 0.5164.

GOLD → Retesting resistance may lead to a breakout.FX:XAUUSD breaks the downward resistance line on the senior timeframe and tests the upper limit of the trading range amid the falling dollar and Powell's speech. The metal may continue its upward movement.
The dollar's rise was short-lived after Fed Chairman Jerome Powell hinted at an imminent interest rate cut, but not in July... The probability of a rate cut in July fell to 22%, and in September to 72%.
Markets are awaiting fresh employment data (ADP and Nonfarm Payrolls), which could influence the prospects for rate cuts. Weak reports could revive interest in gold, but for now, the asset remains under pressure due to the short-term strengthening of the dollar and uncertainty surrounding Fed policy.
Technically, if the pre-breakout structure remains intact and gold continues to attack resistance within the local range of 3347-3330 (3335), the chances of further growth will be high...
Resistance levels: 3347, 3358
Support levels: 3336, 3316, 3311
The global trend is upward, and locally, the price is also returning to growth. If the bulls can maintain the current trend, break through the resistance at 3347, and hold their ground above this level, then the next target will be 3390-3400. I do not rule out a correction to 3325, 3316 (liquidity hunt) before the growth continues.
Best regards, R. Linda!

We hit. We failed. Now we drop.OANDA:GBPAUD
Inside this price channel, the market is forming a flag in an attempt to break out.
But given the market cycle and three failed breakout attempts,
I believe it's time for sellers to take control.
📉 I’m siding with the bears on this one!
